|
|
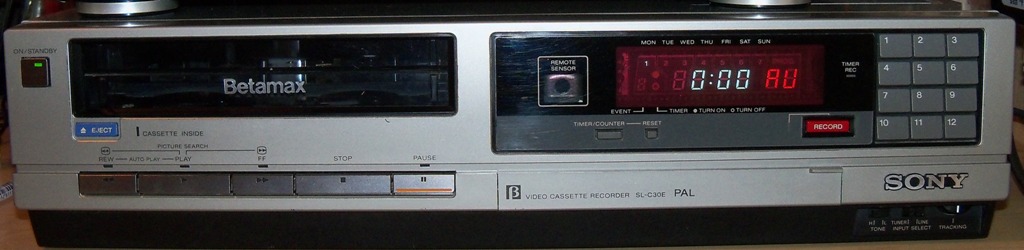
What's this page all about? I enjoy experimenting and messing around with all manner of electronics. This page is like a diary where I document what I get up to and what I find interesting. Quicklinks: > 11-13 April 2012 I did some transfers of Betamax material to digital using my Sony SL-C30E Betamax VCR. The snapshots below are from this vcr playing recordings it made from DSTV. As you can see the heads are obviously still fine and playback quality is excellent. What strikes me is how vivid the colour of Betamax is. I often use cartoons to test vcrs due to the saturated colours and sharp well defined edges.
MNET MNET started broadcasting in SA in 1986/87 and decided to use the subscription TV model. This meant viewers needed a de-scrambler or decoder, as it's called in SA, to receive and decode the scrambled signal. Each subscriber would buy a decoder with a unique number allowing MNET full control over whether the decoder is enabled or disabled. Every subscriber would pay a monthly subscription fee. What I find particularly interesting is that MNET has been using digital sound since 1986. The choice was made to use digital sound as it would deter piracy. MNET used encryption technology from OAK technologies in the USA, adapted for the PAL system. The analogue MNET signal was switched off March 2018. It seems MNET is now only available via DSTV.
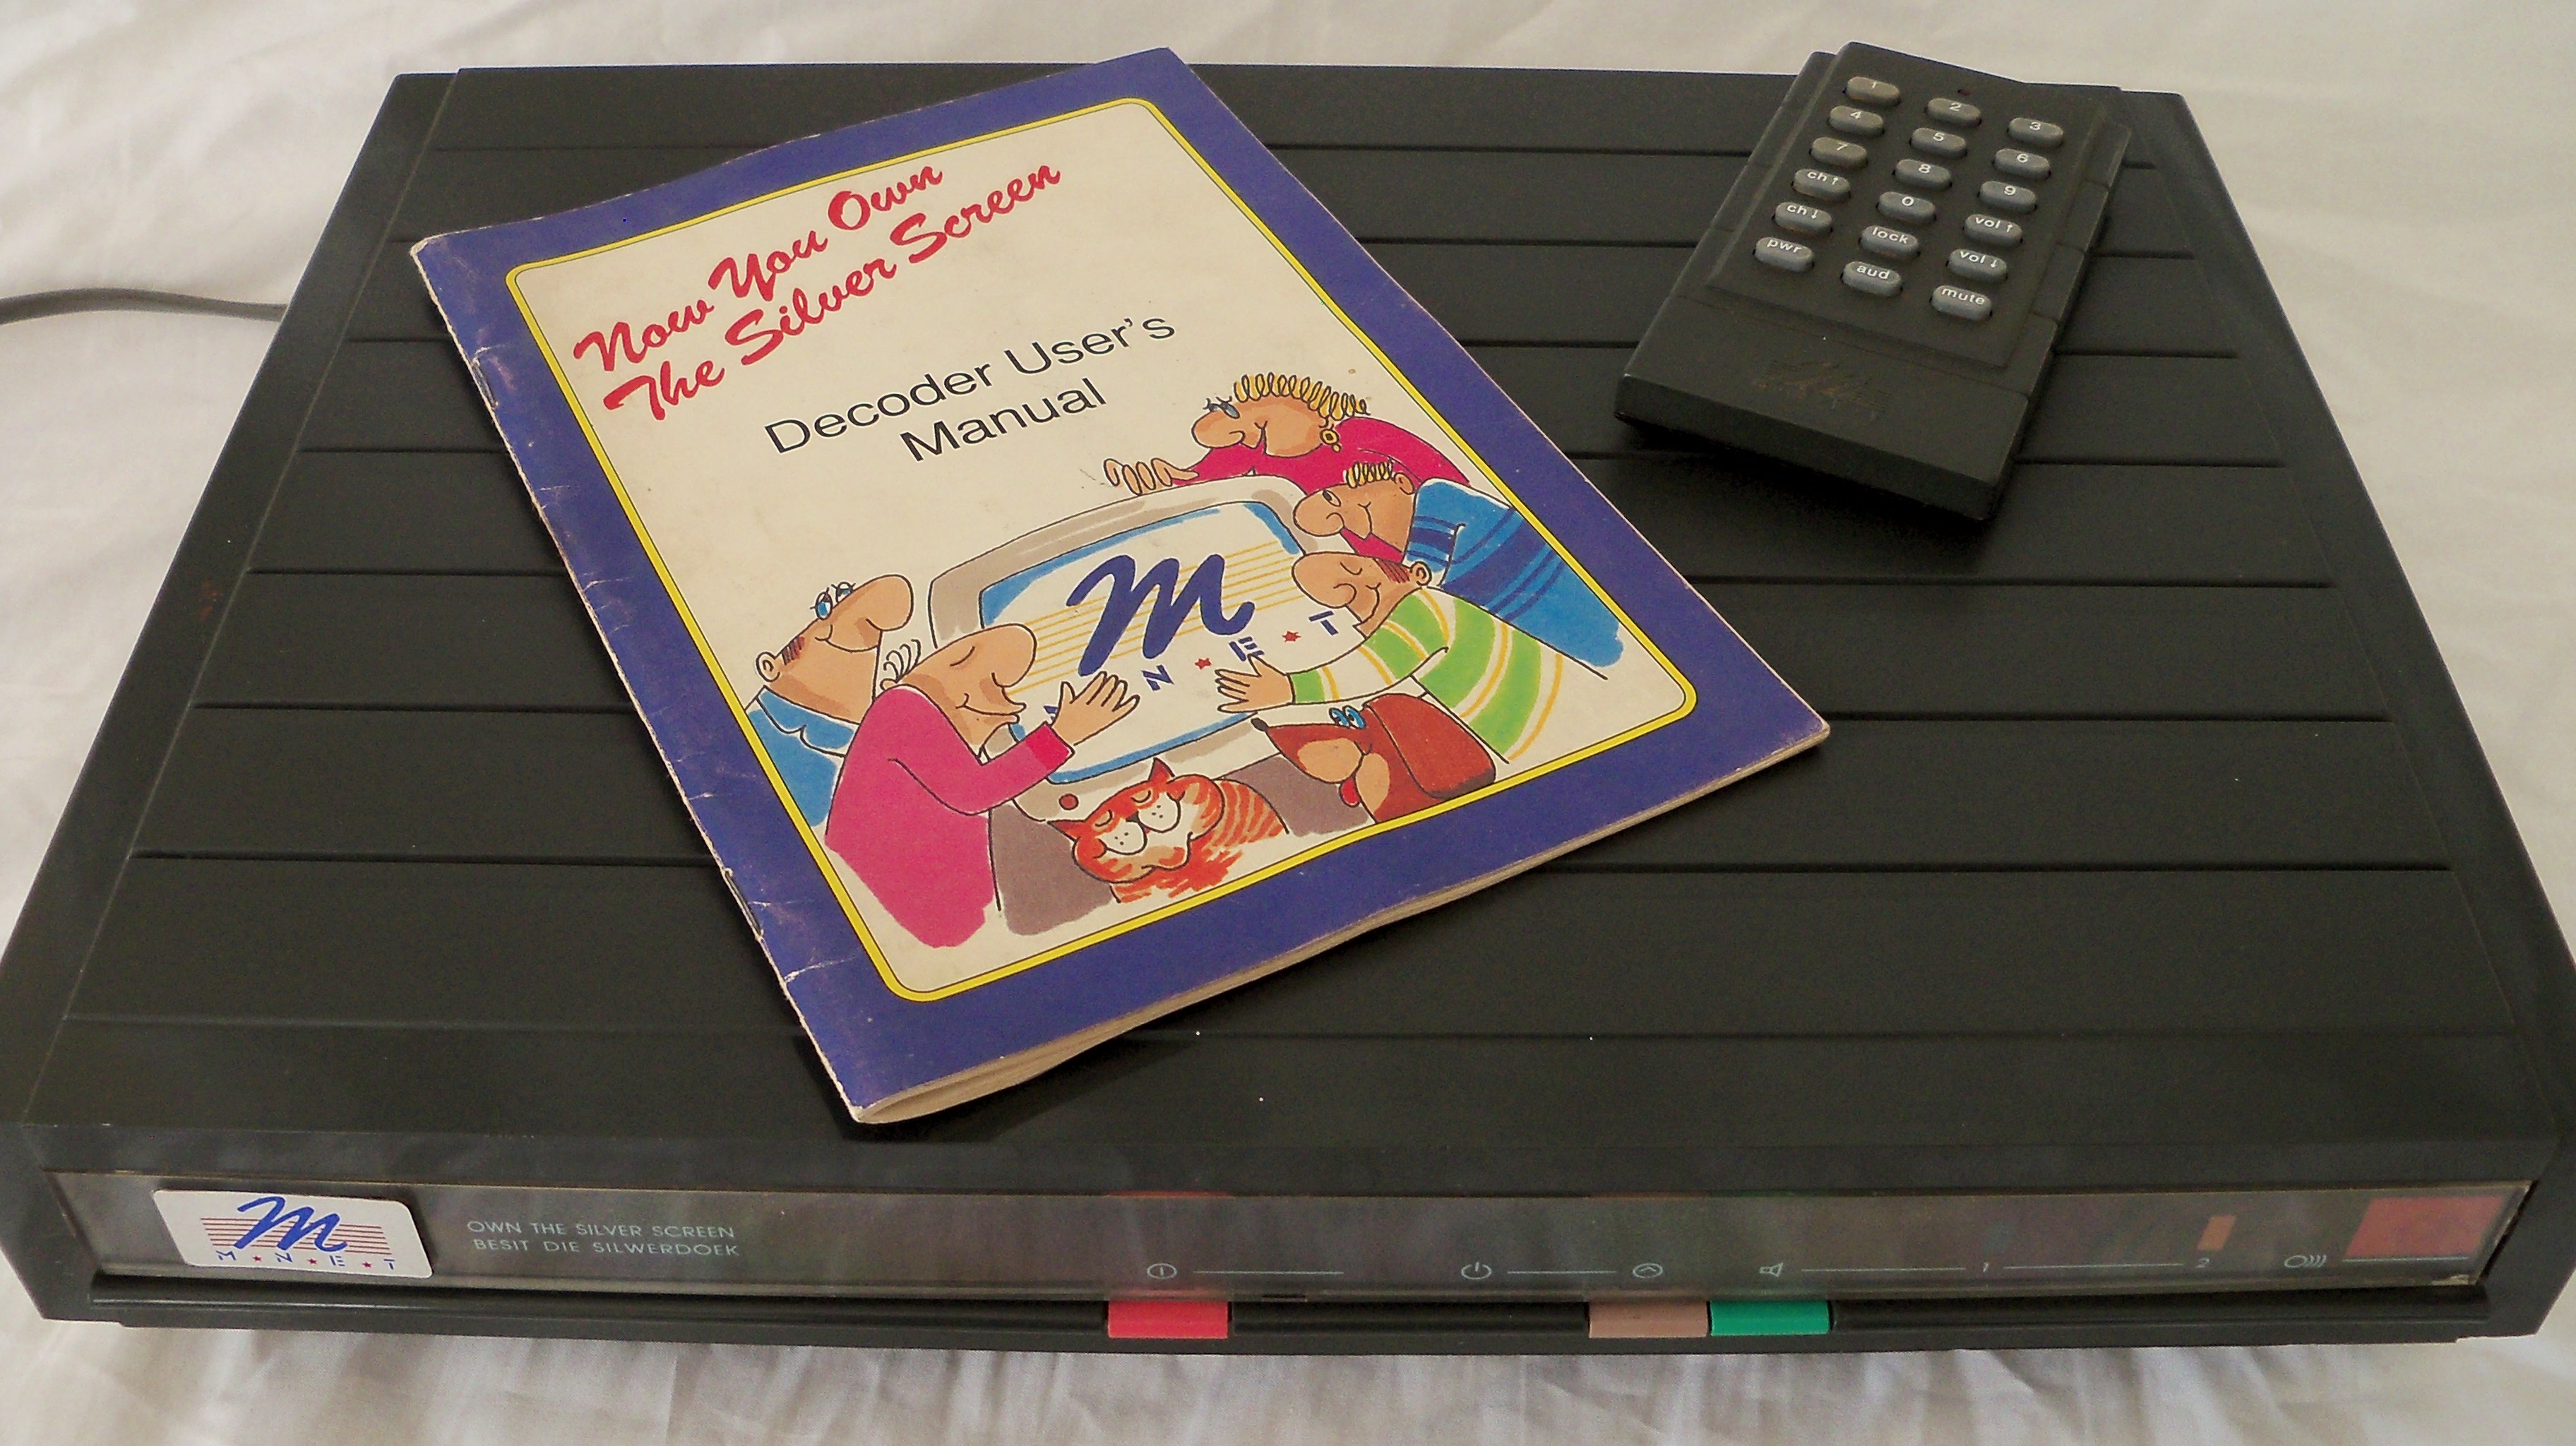
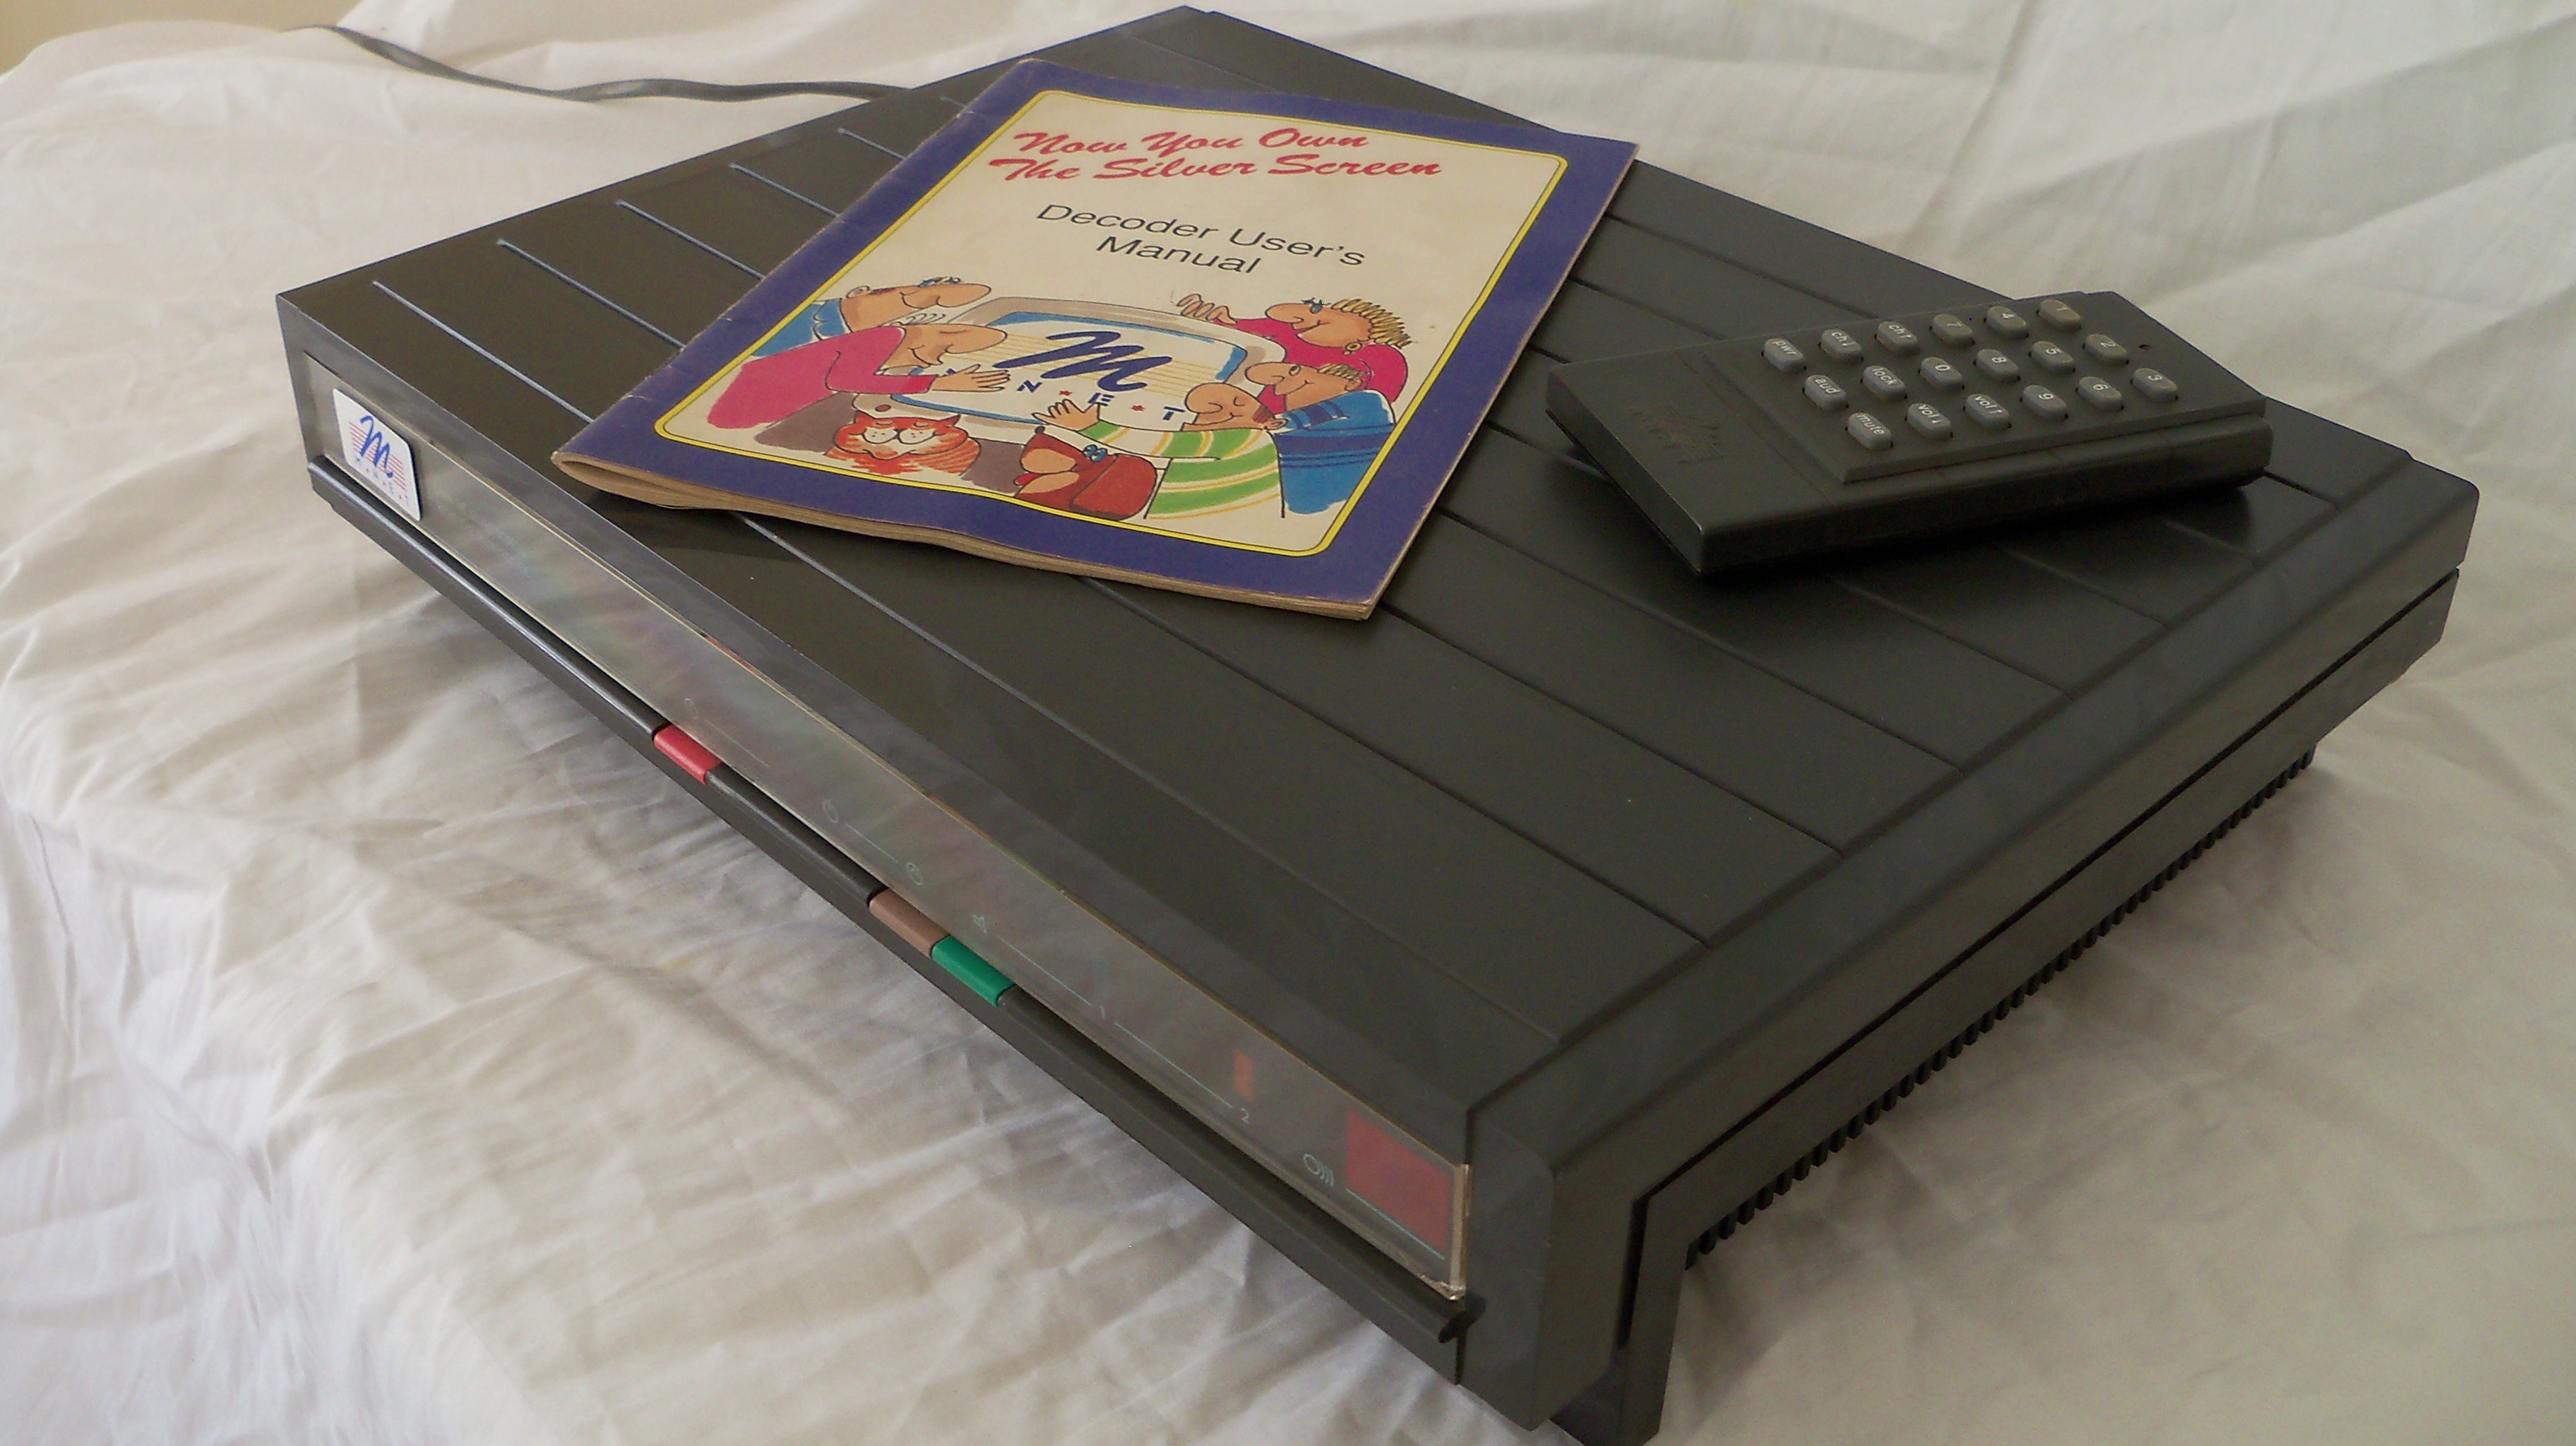
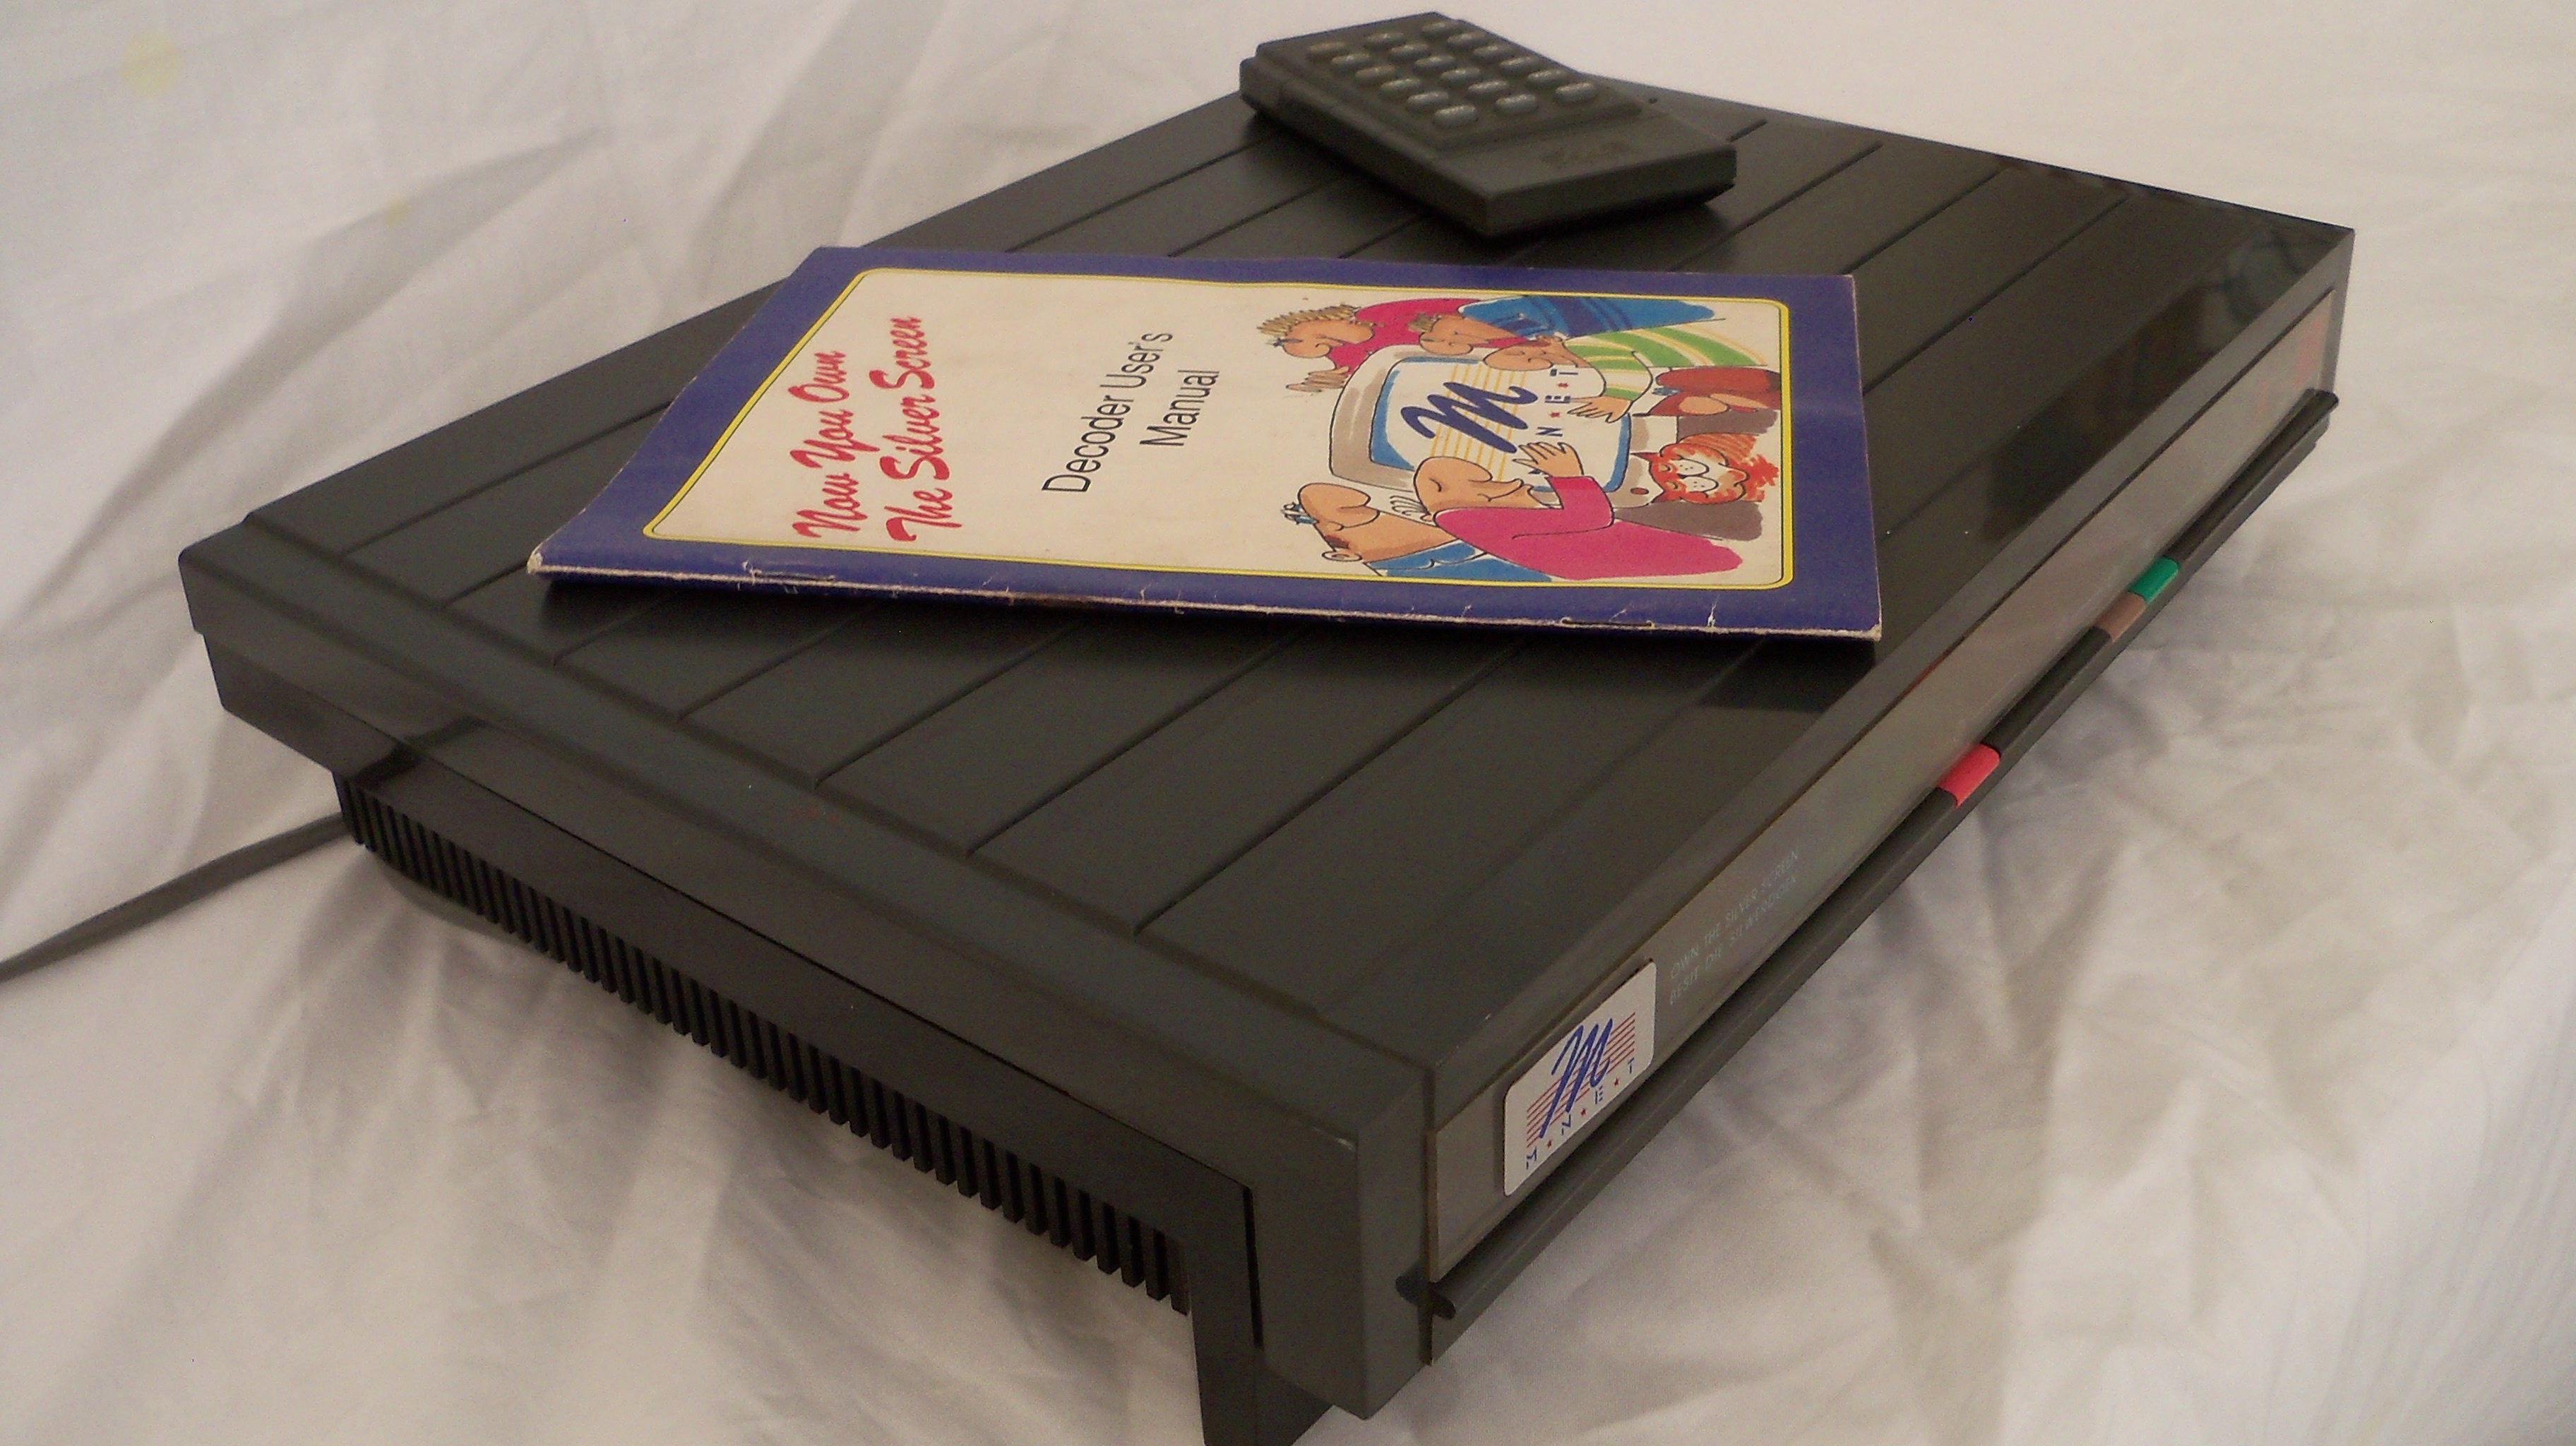
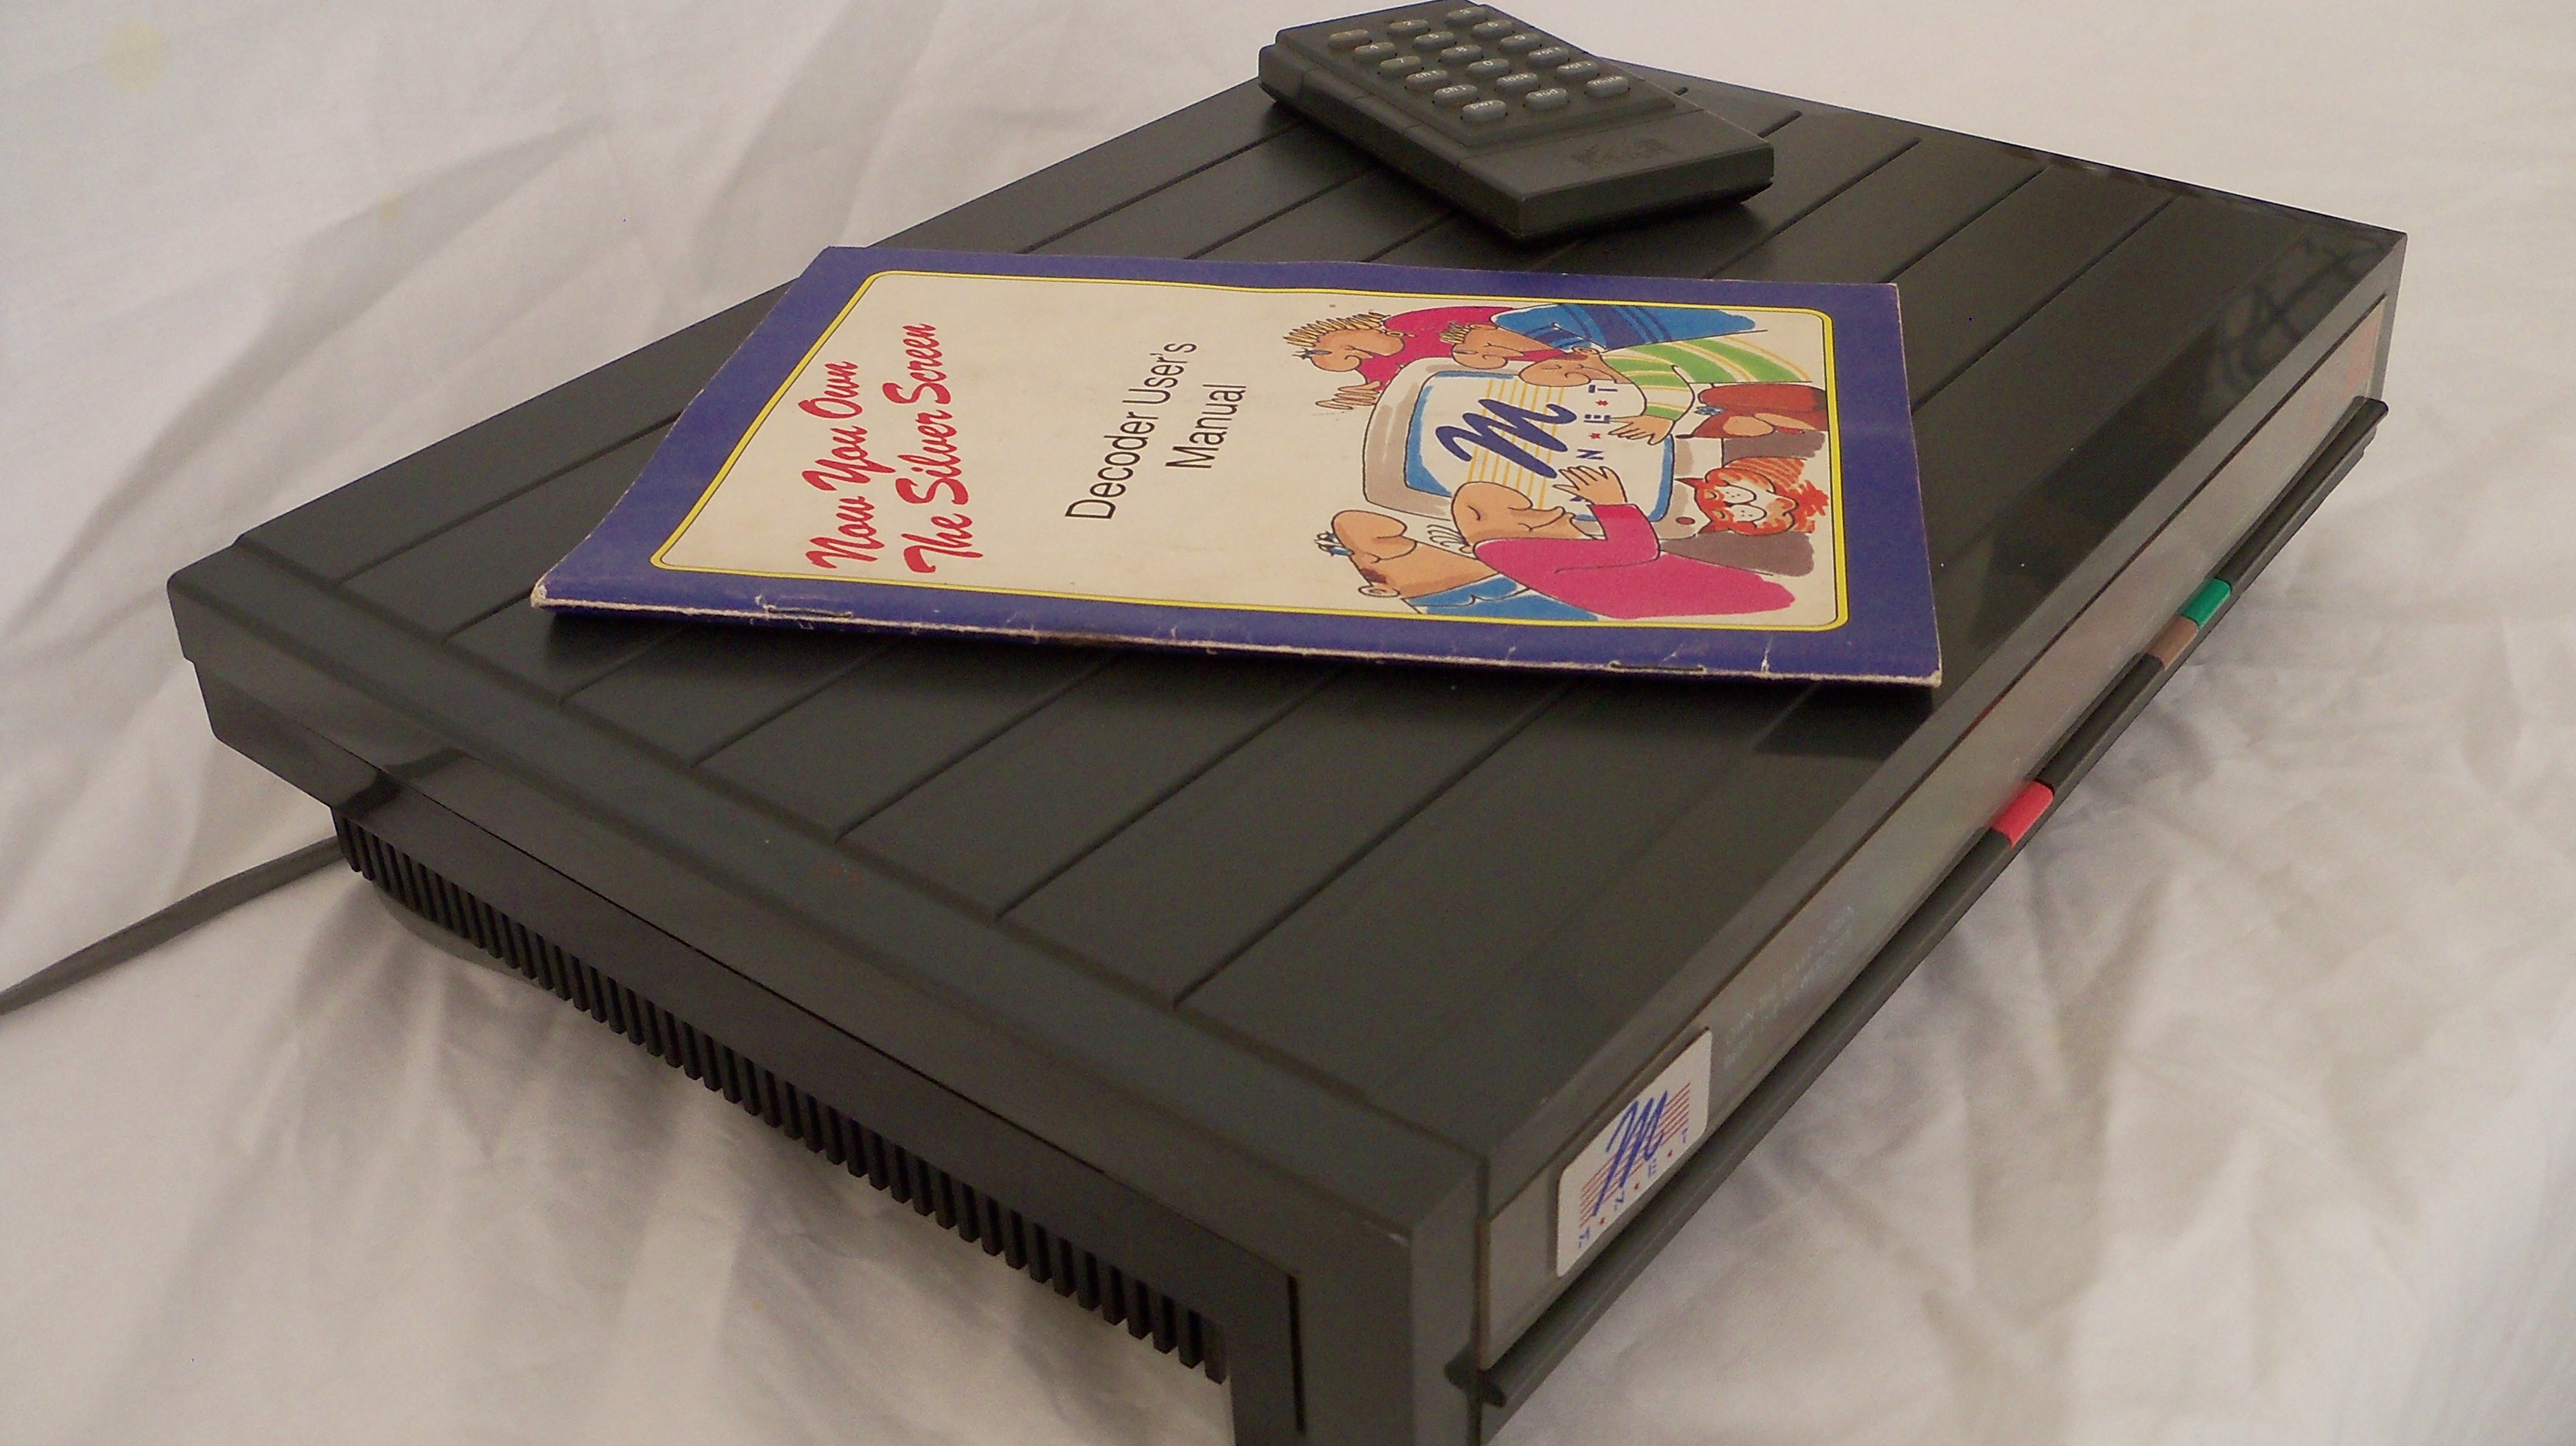
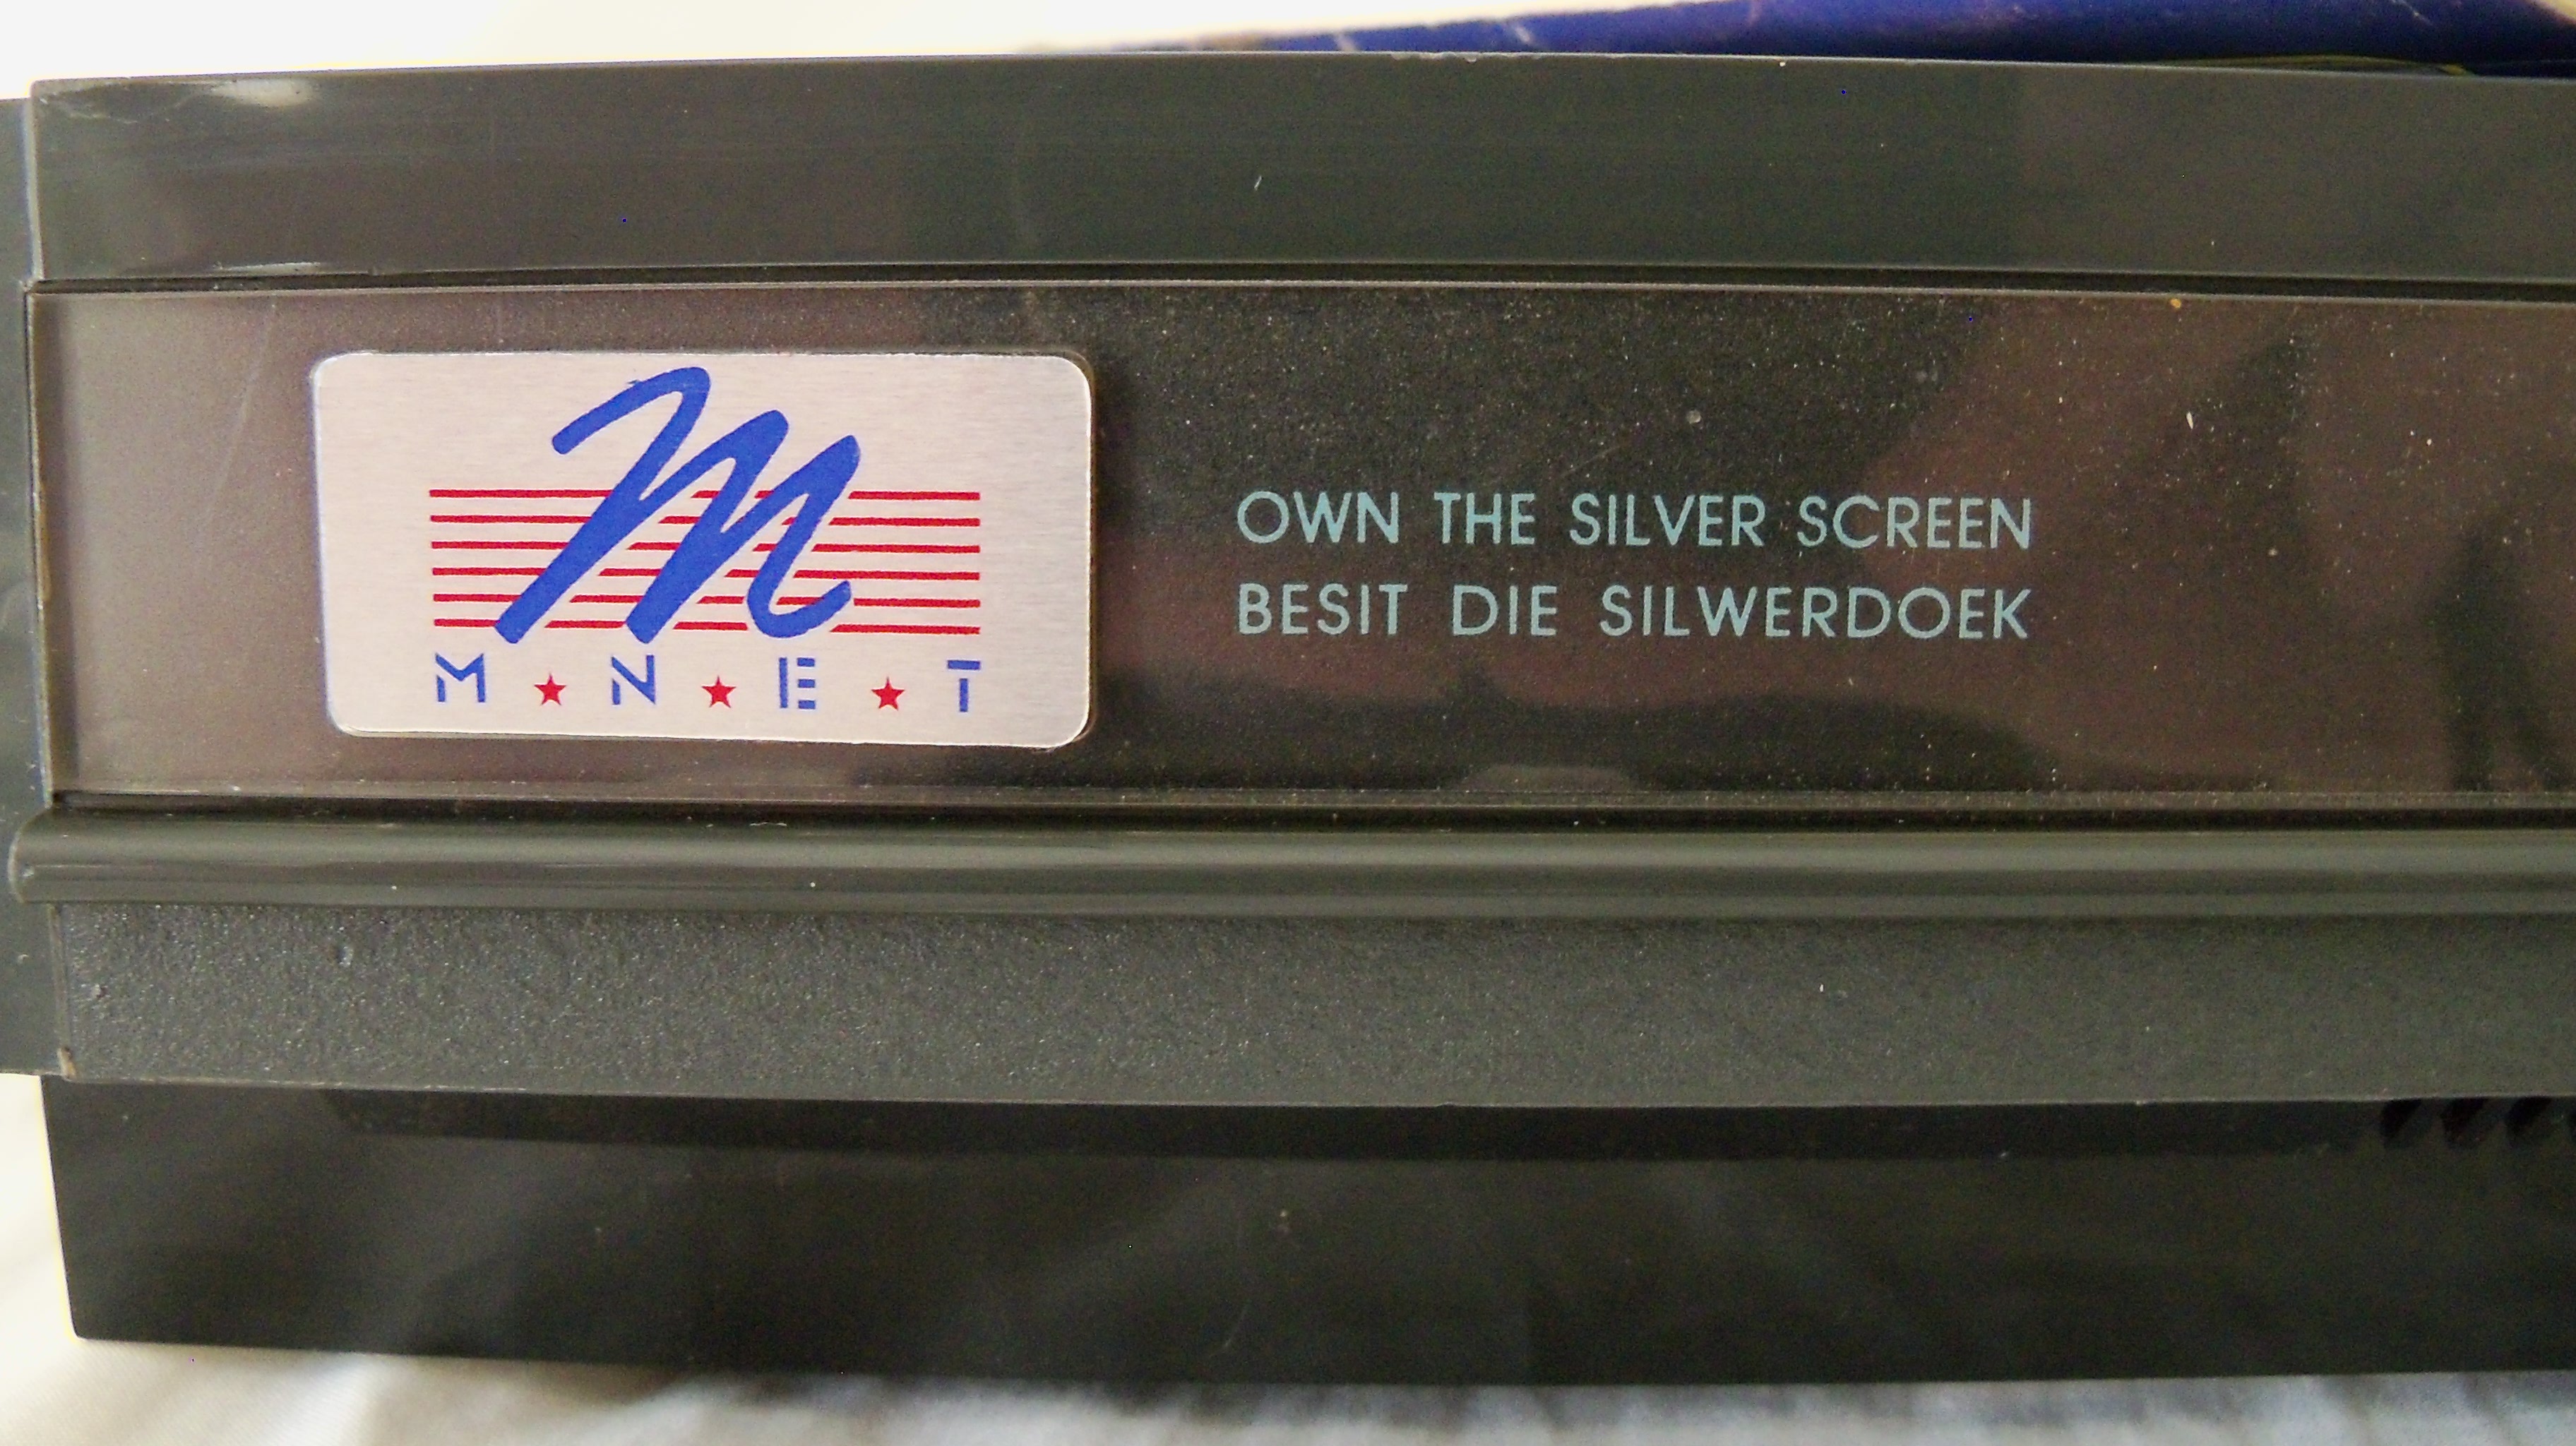
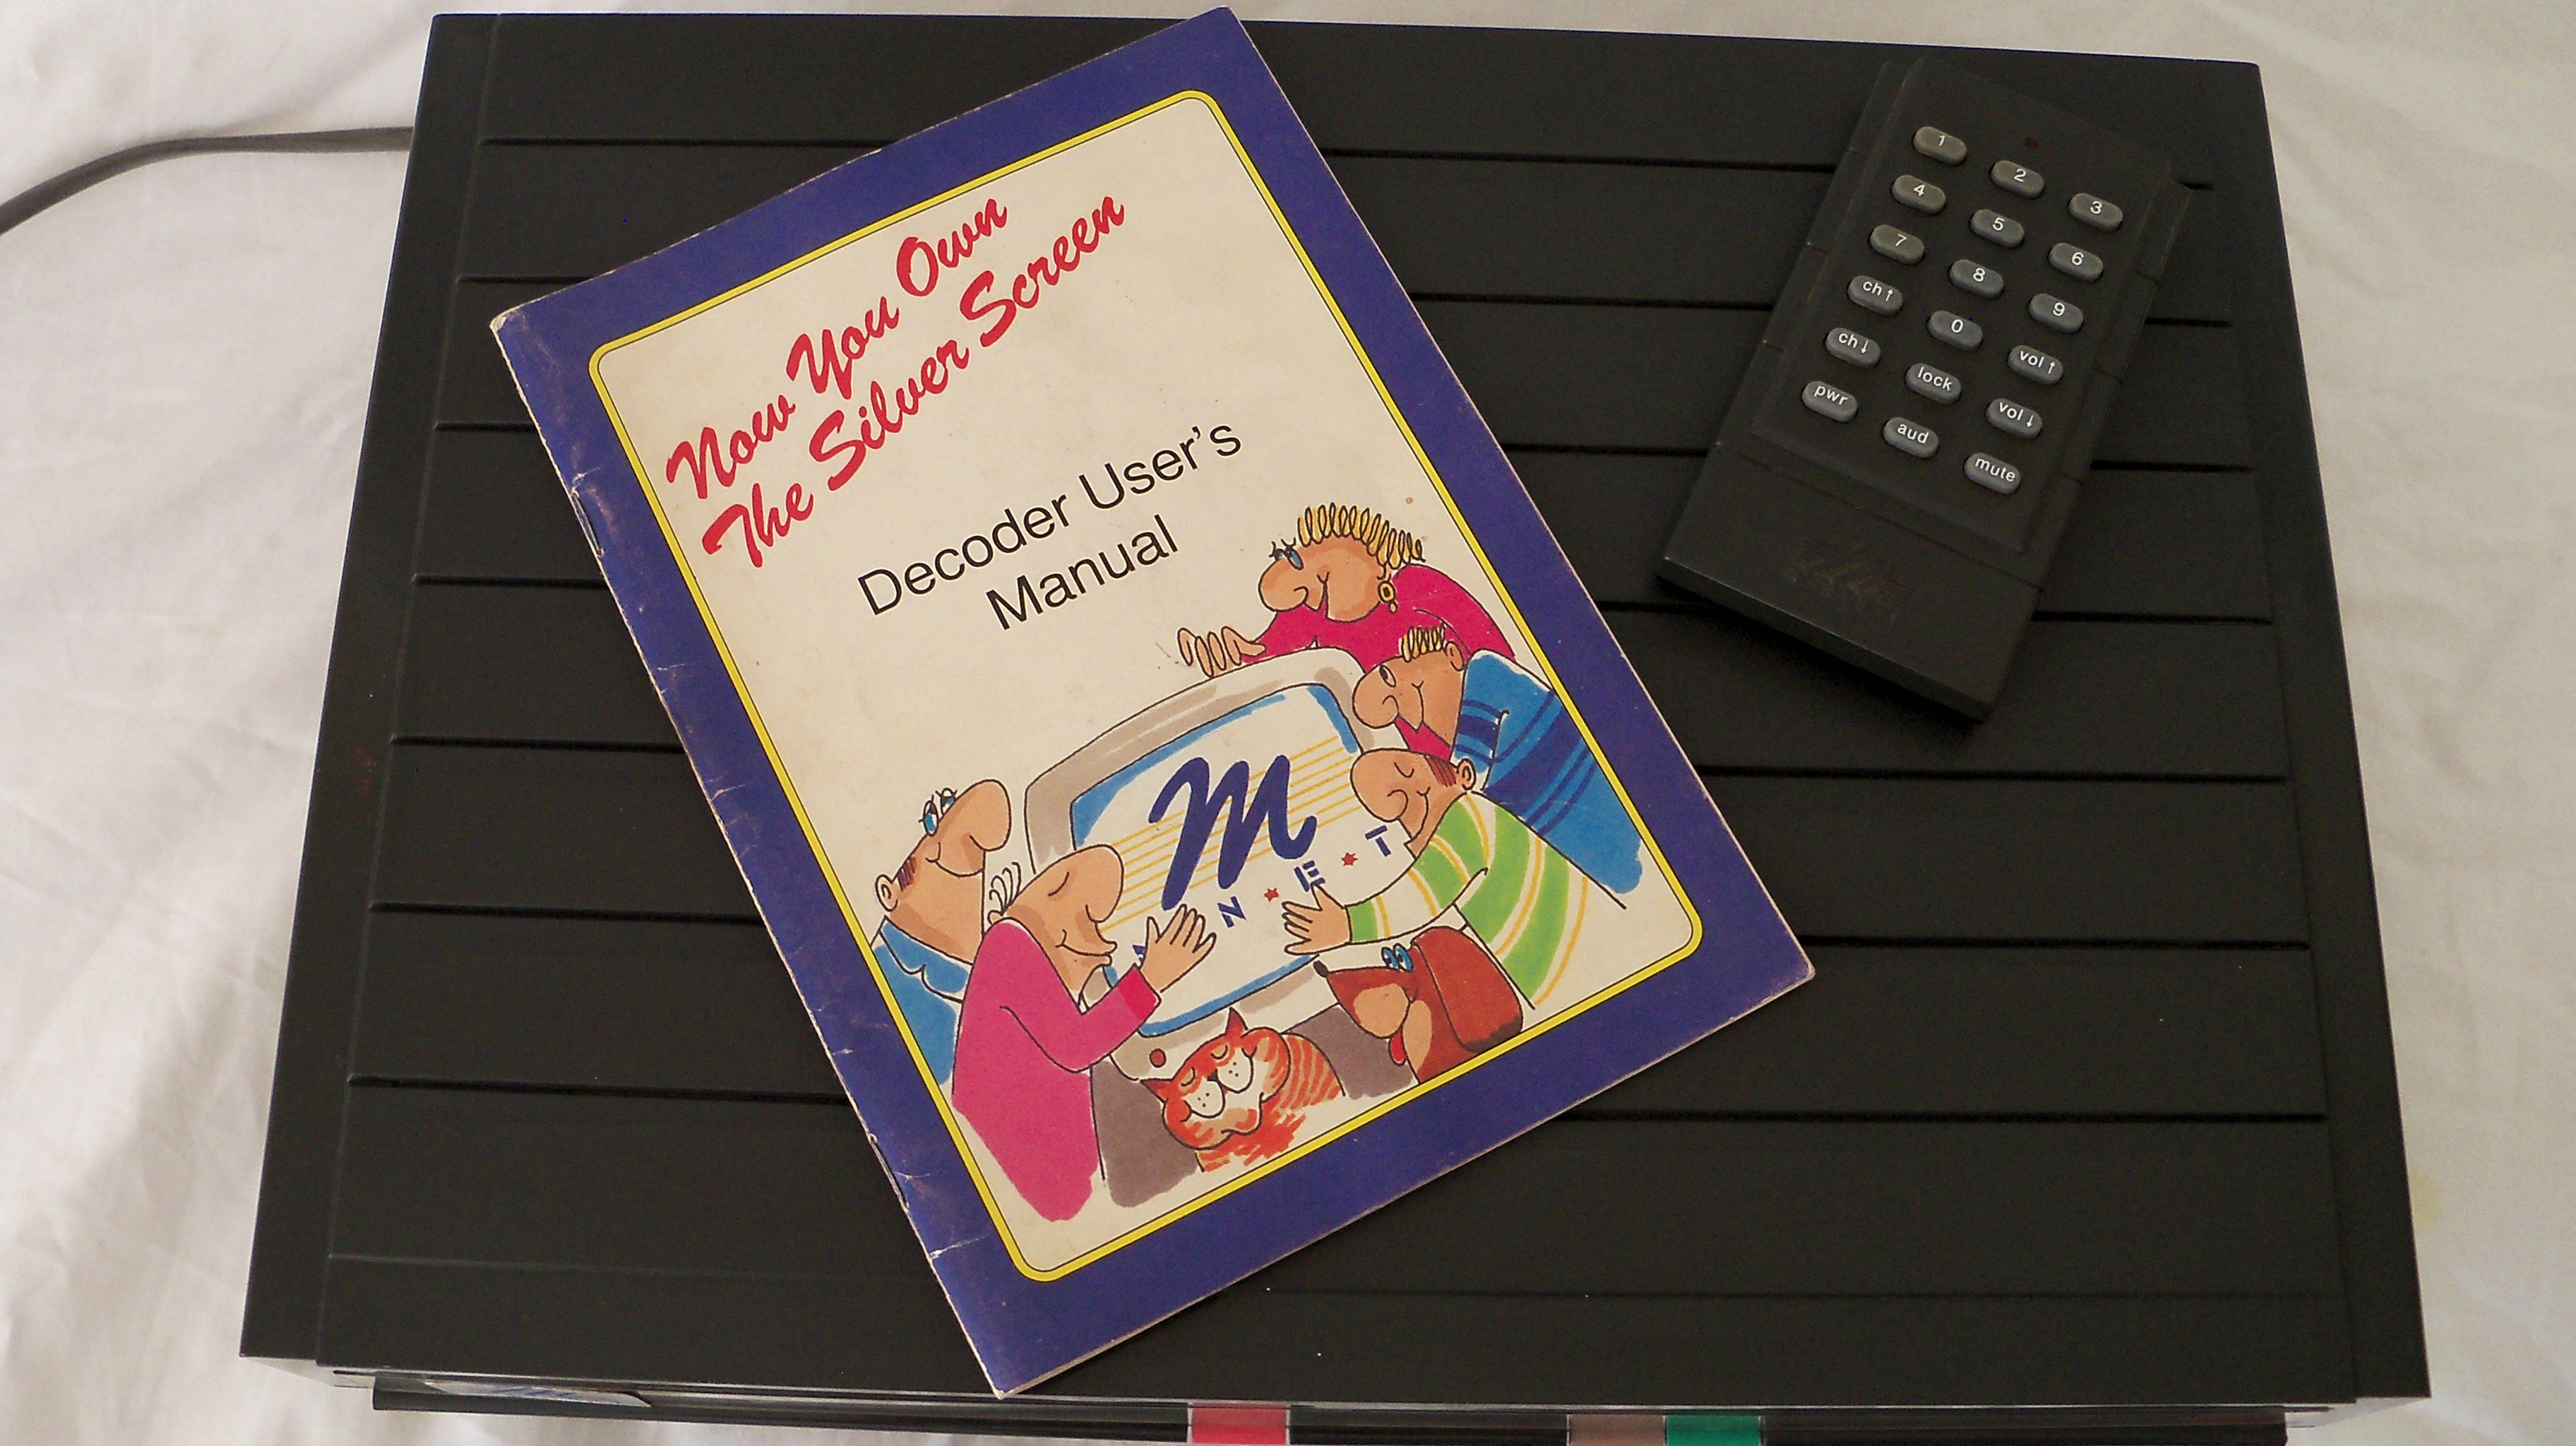
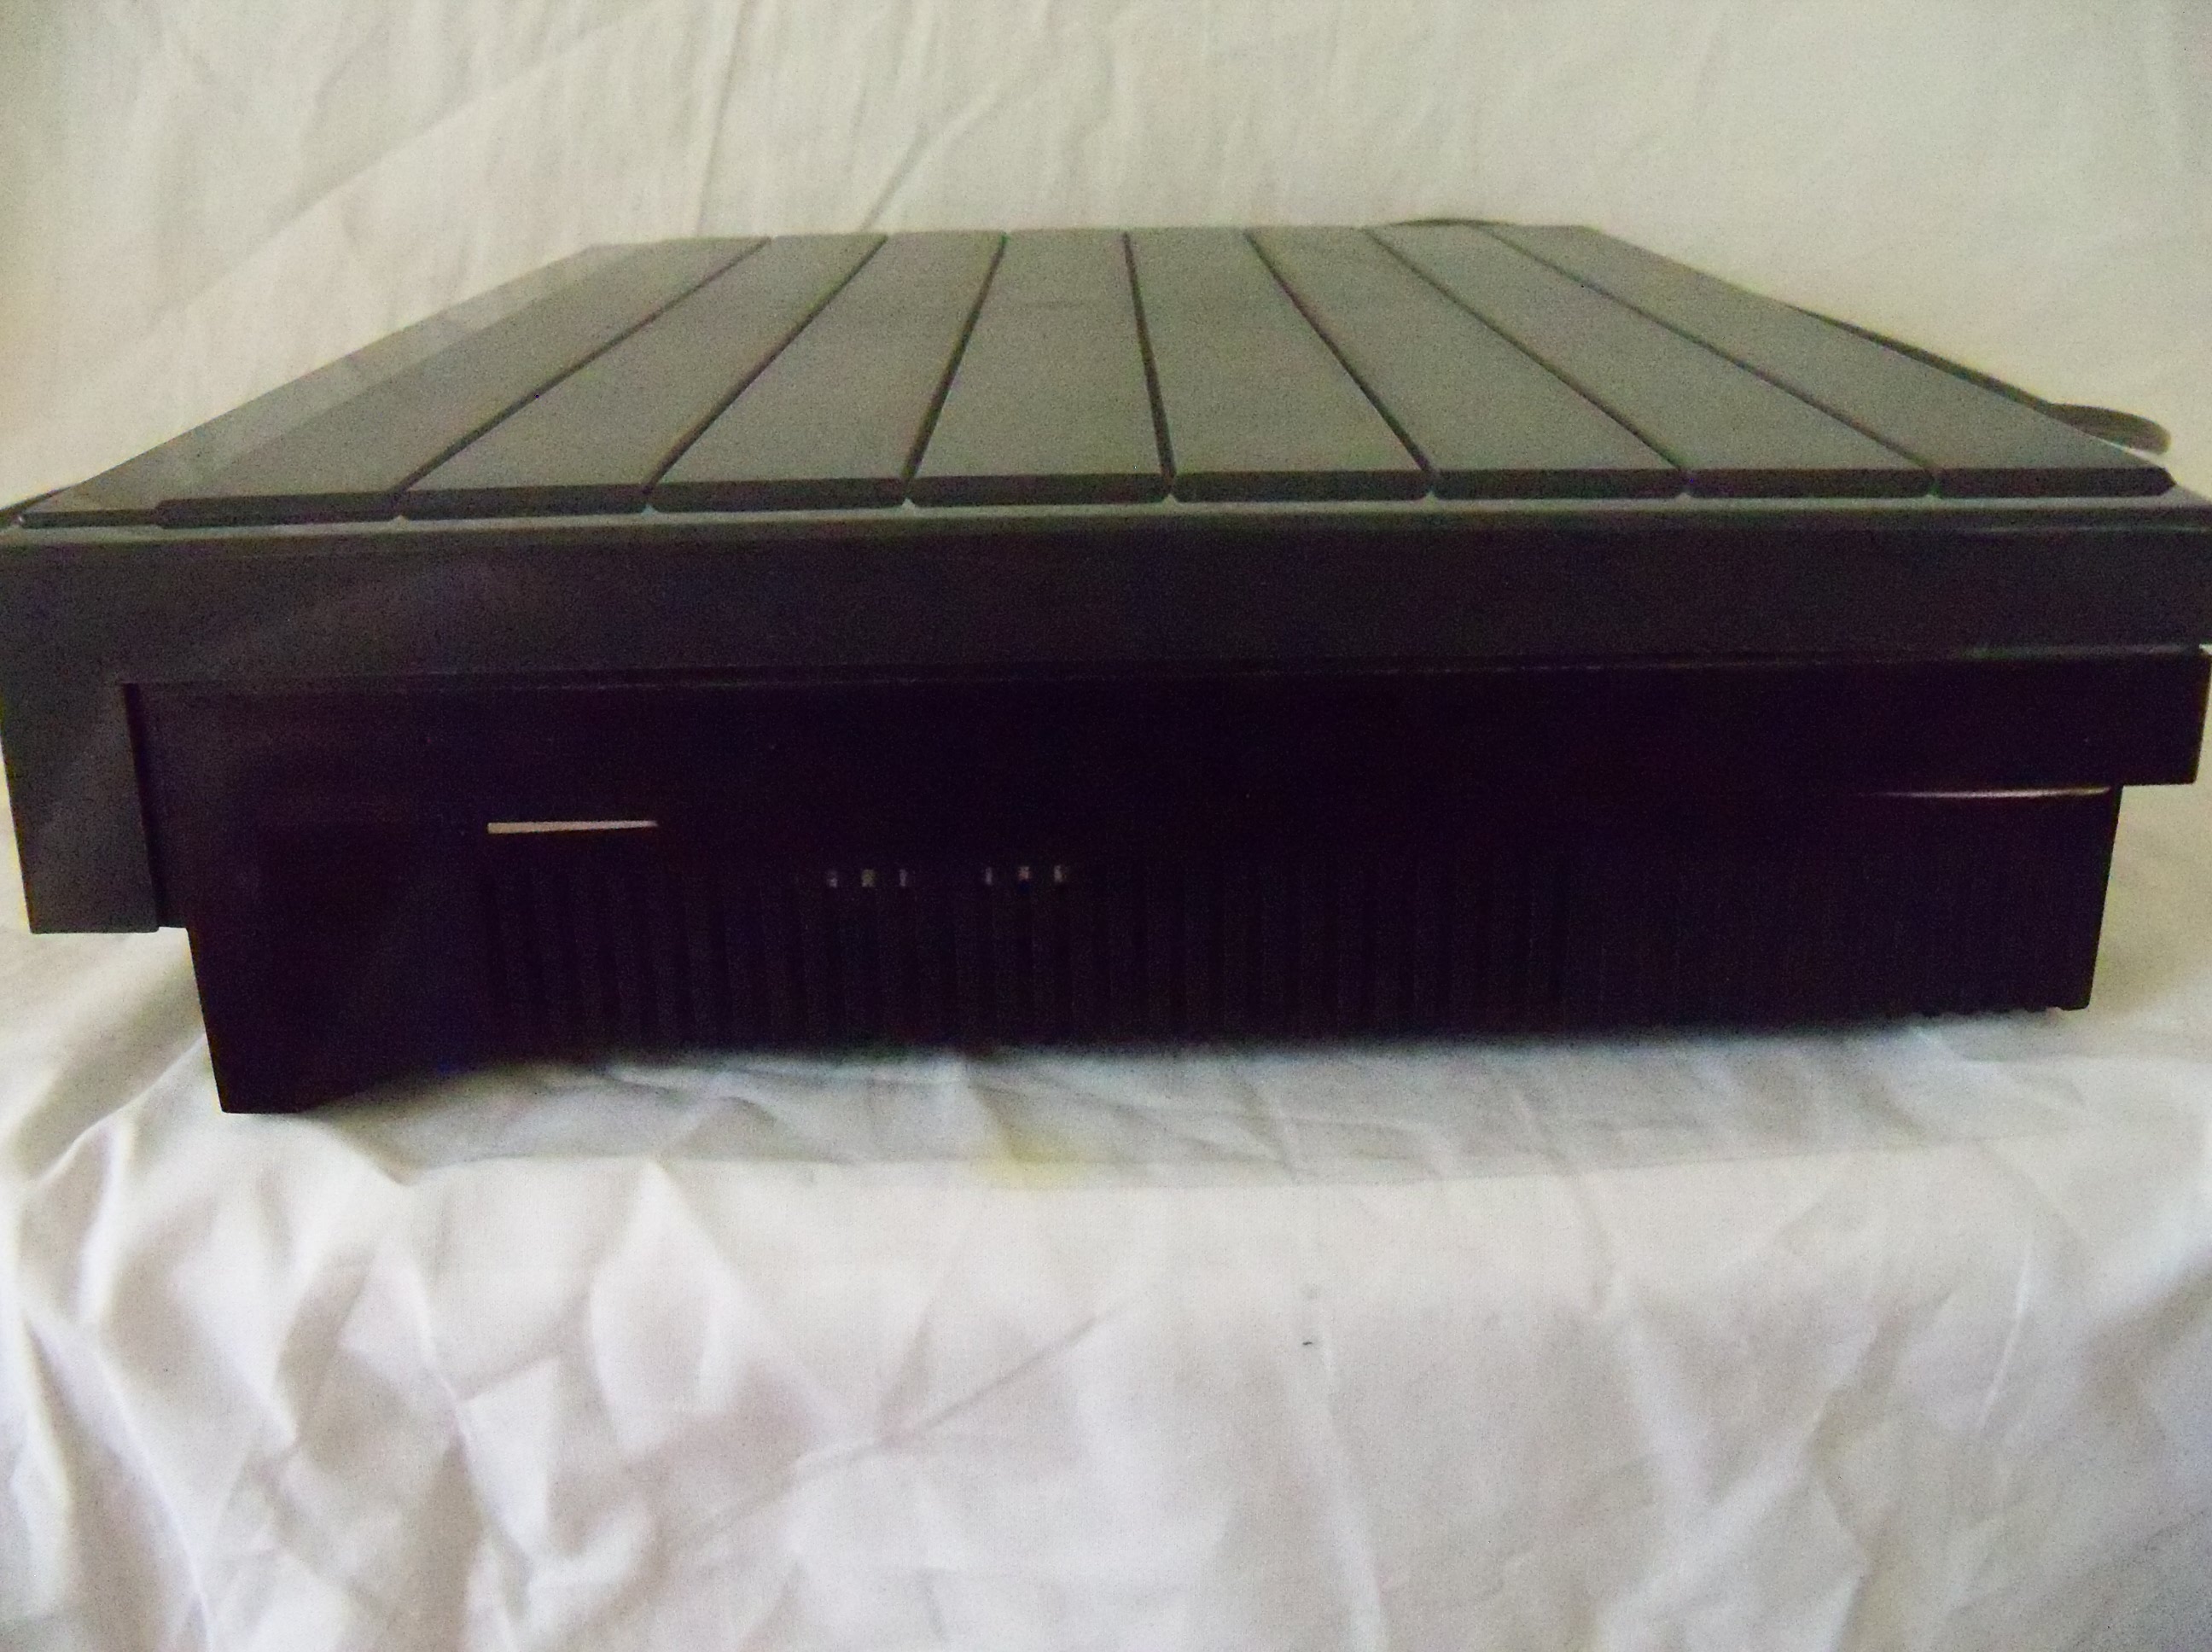
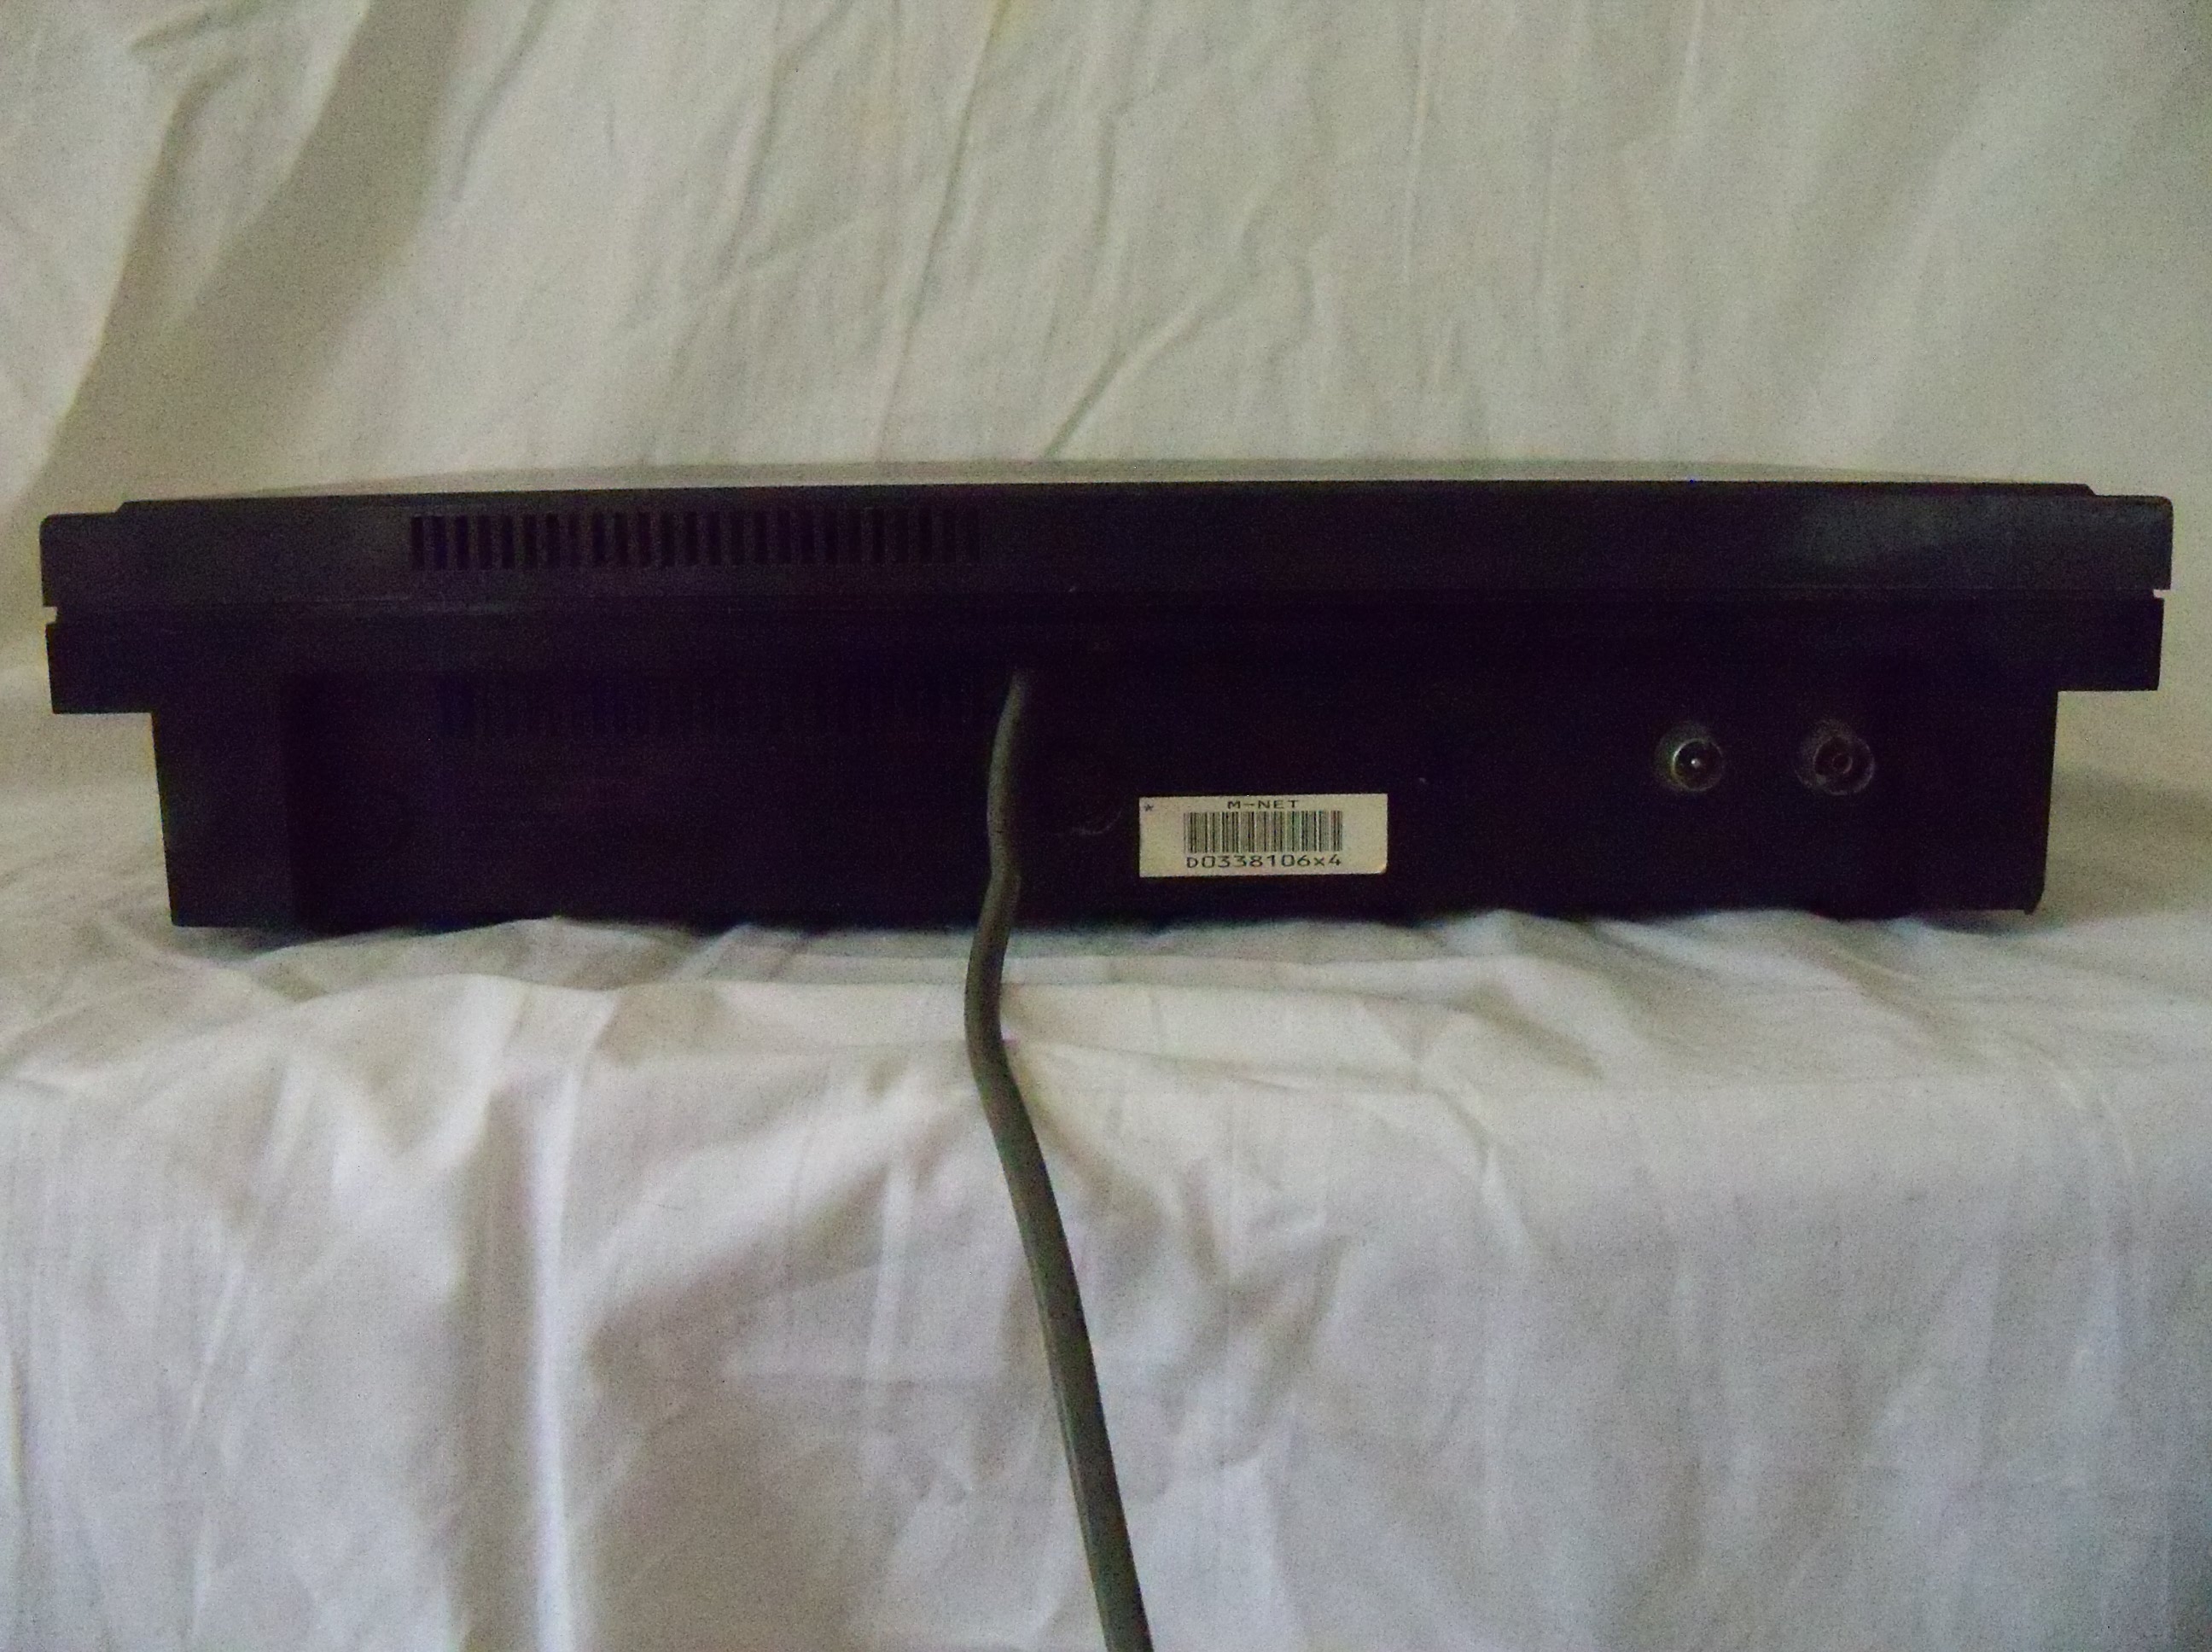
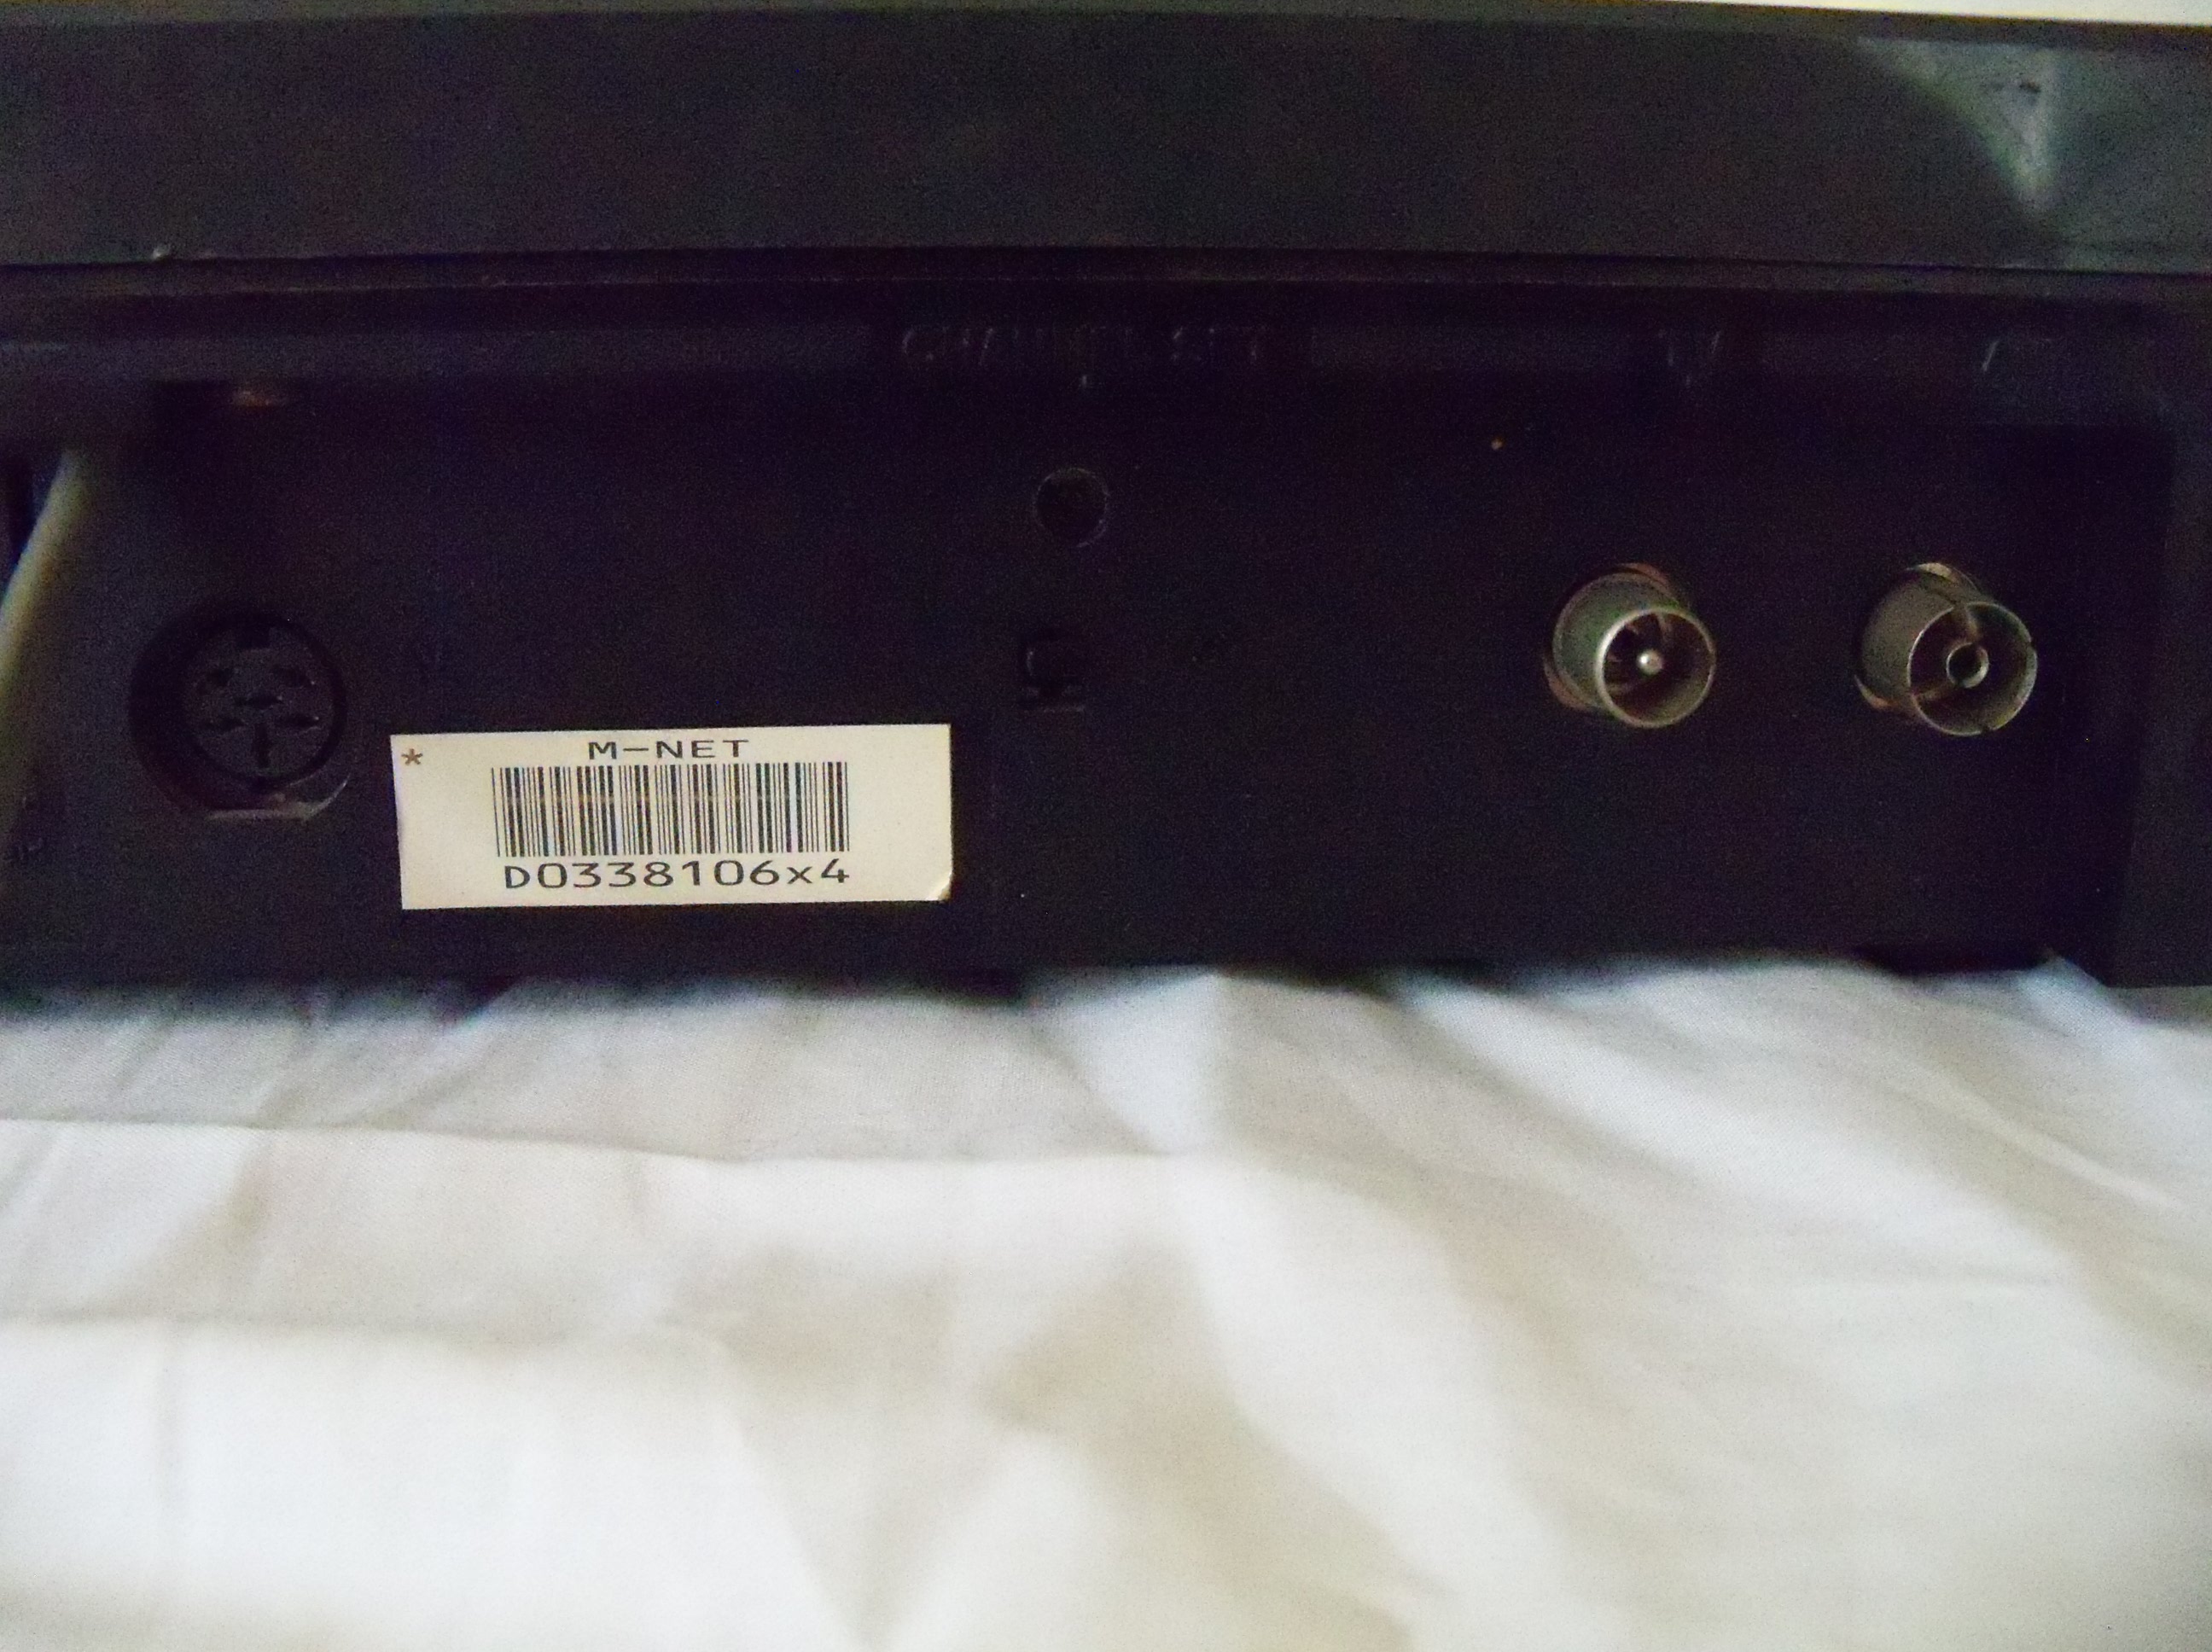
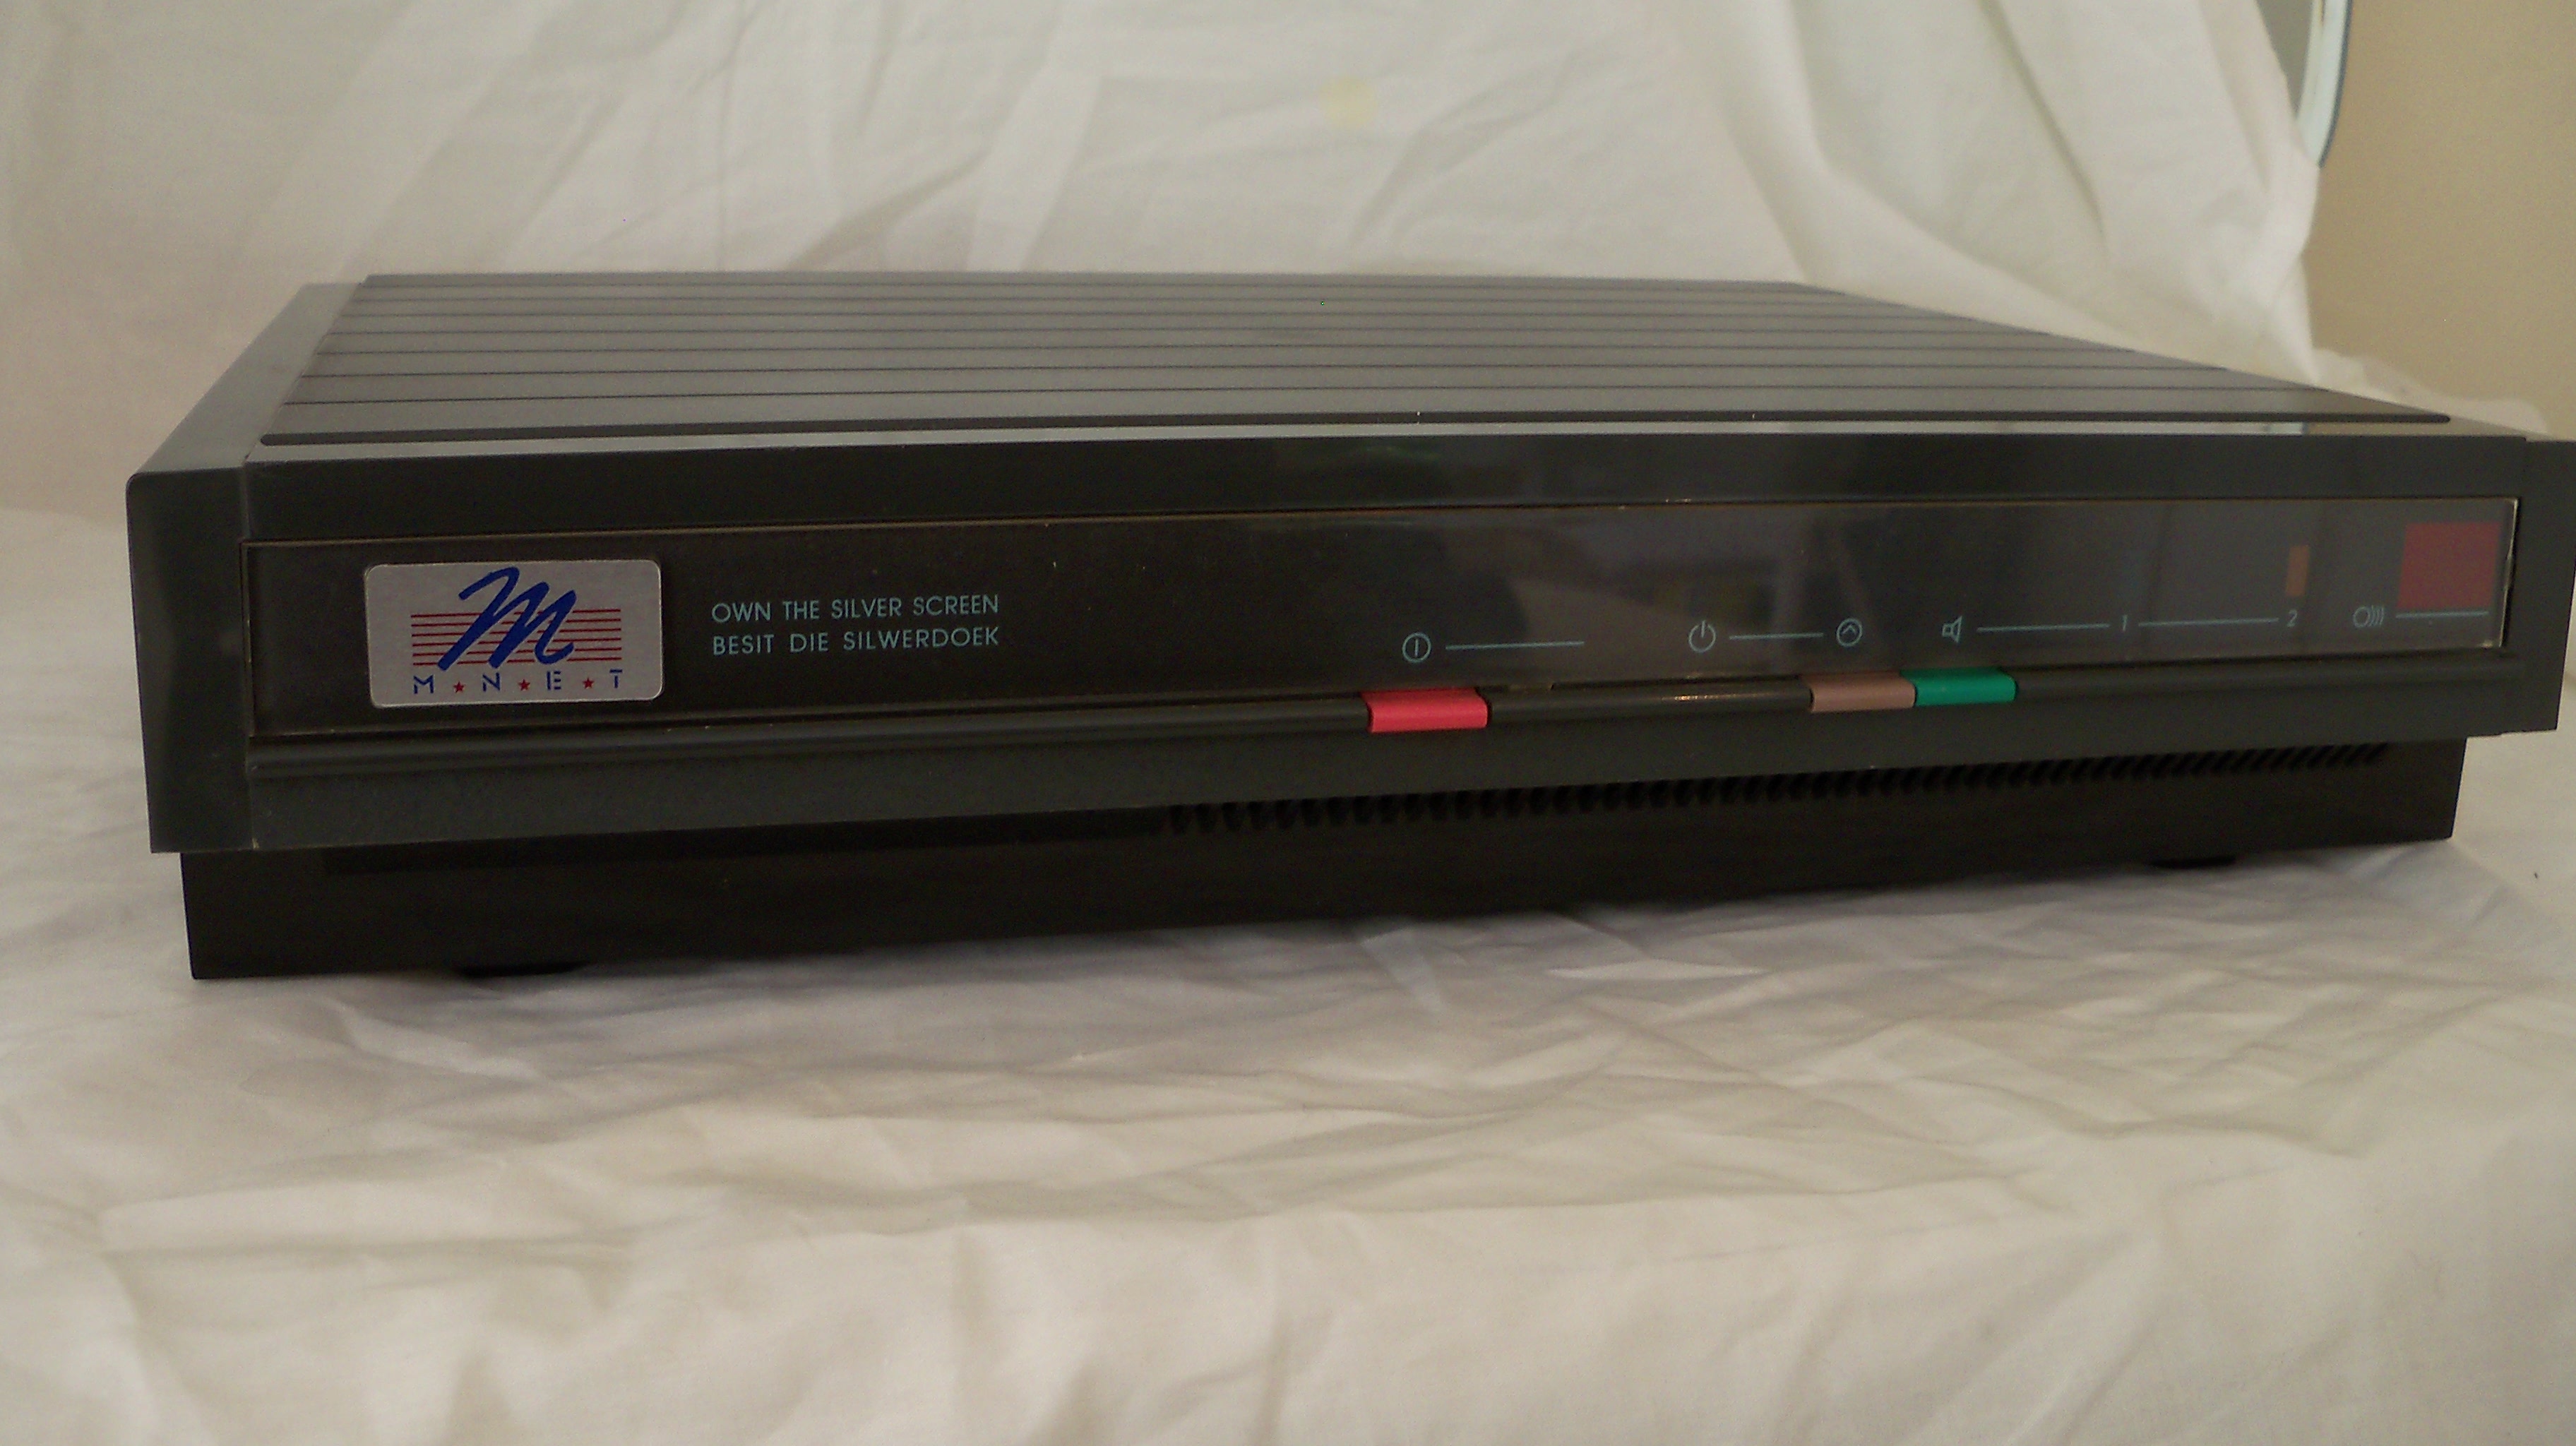
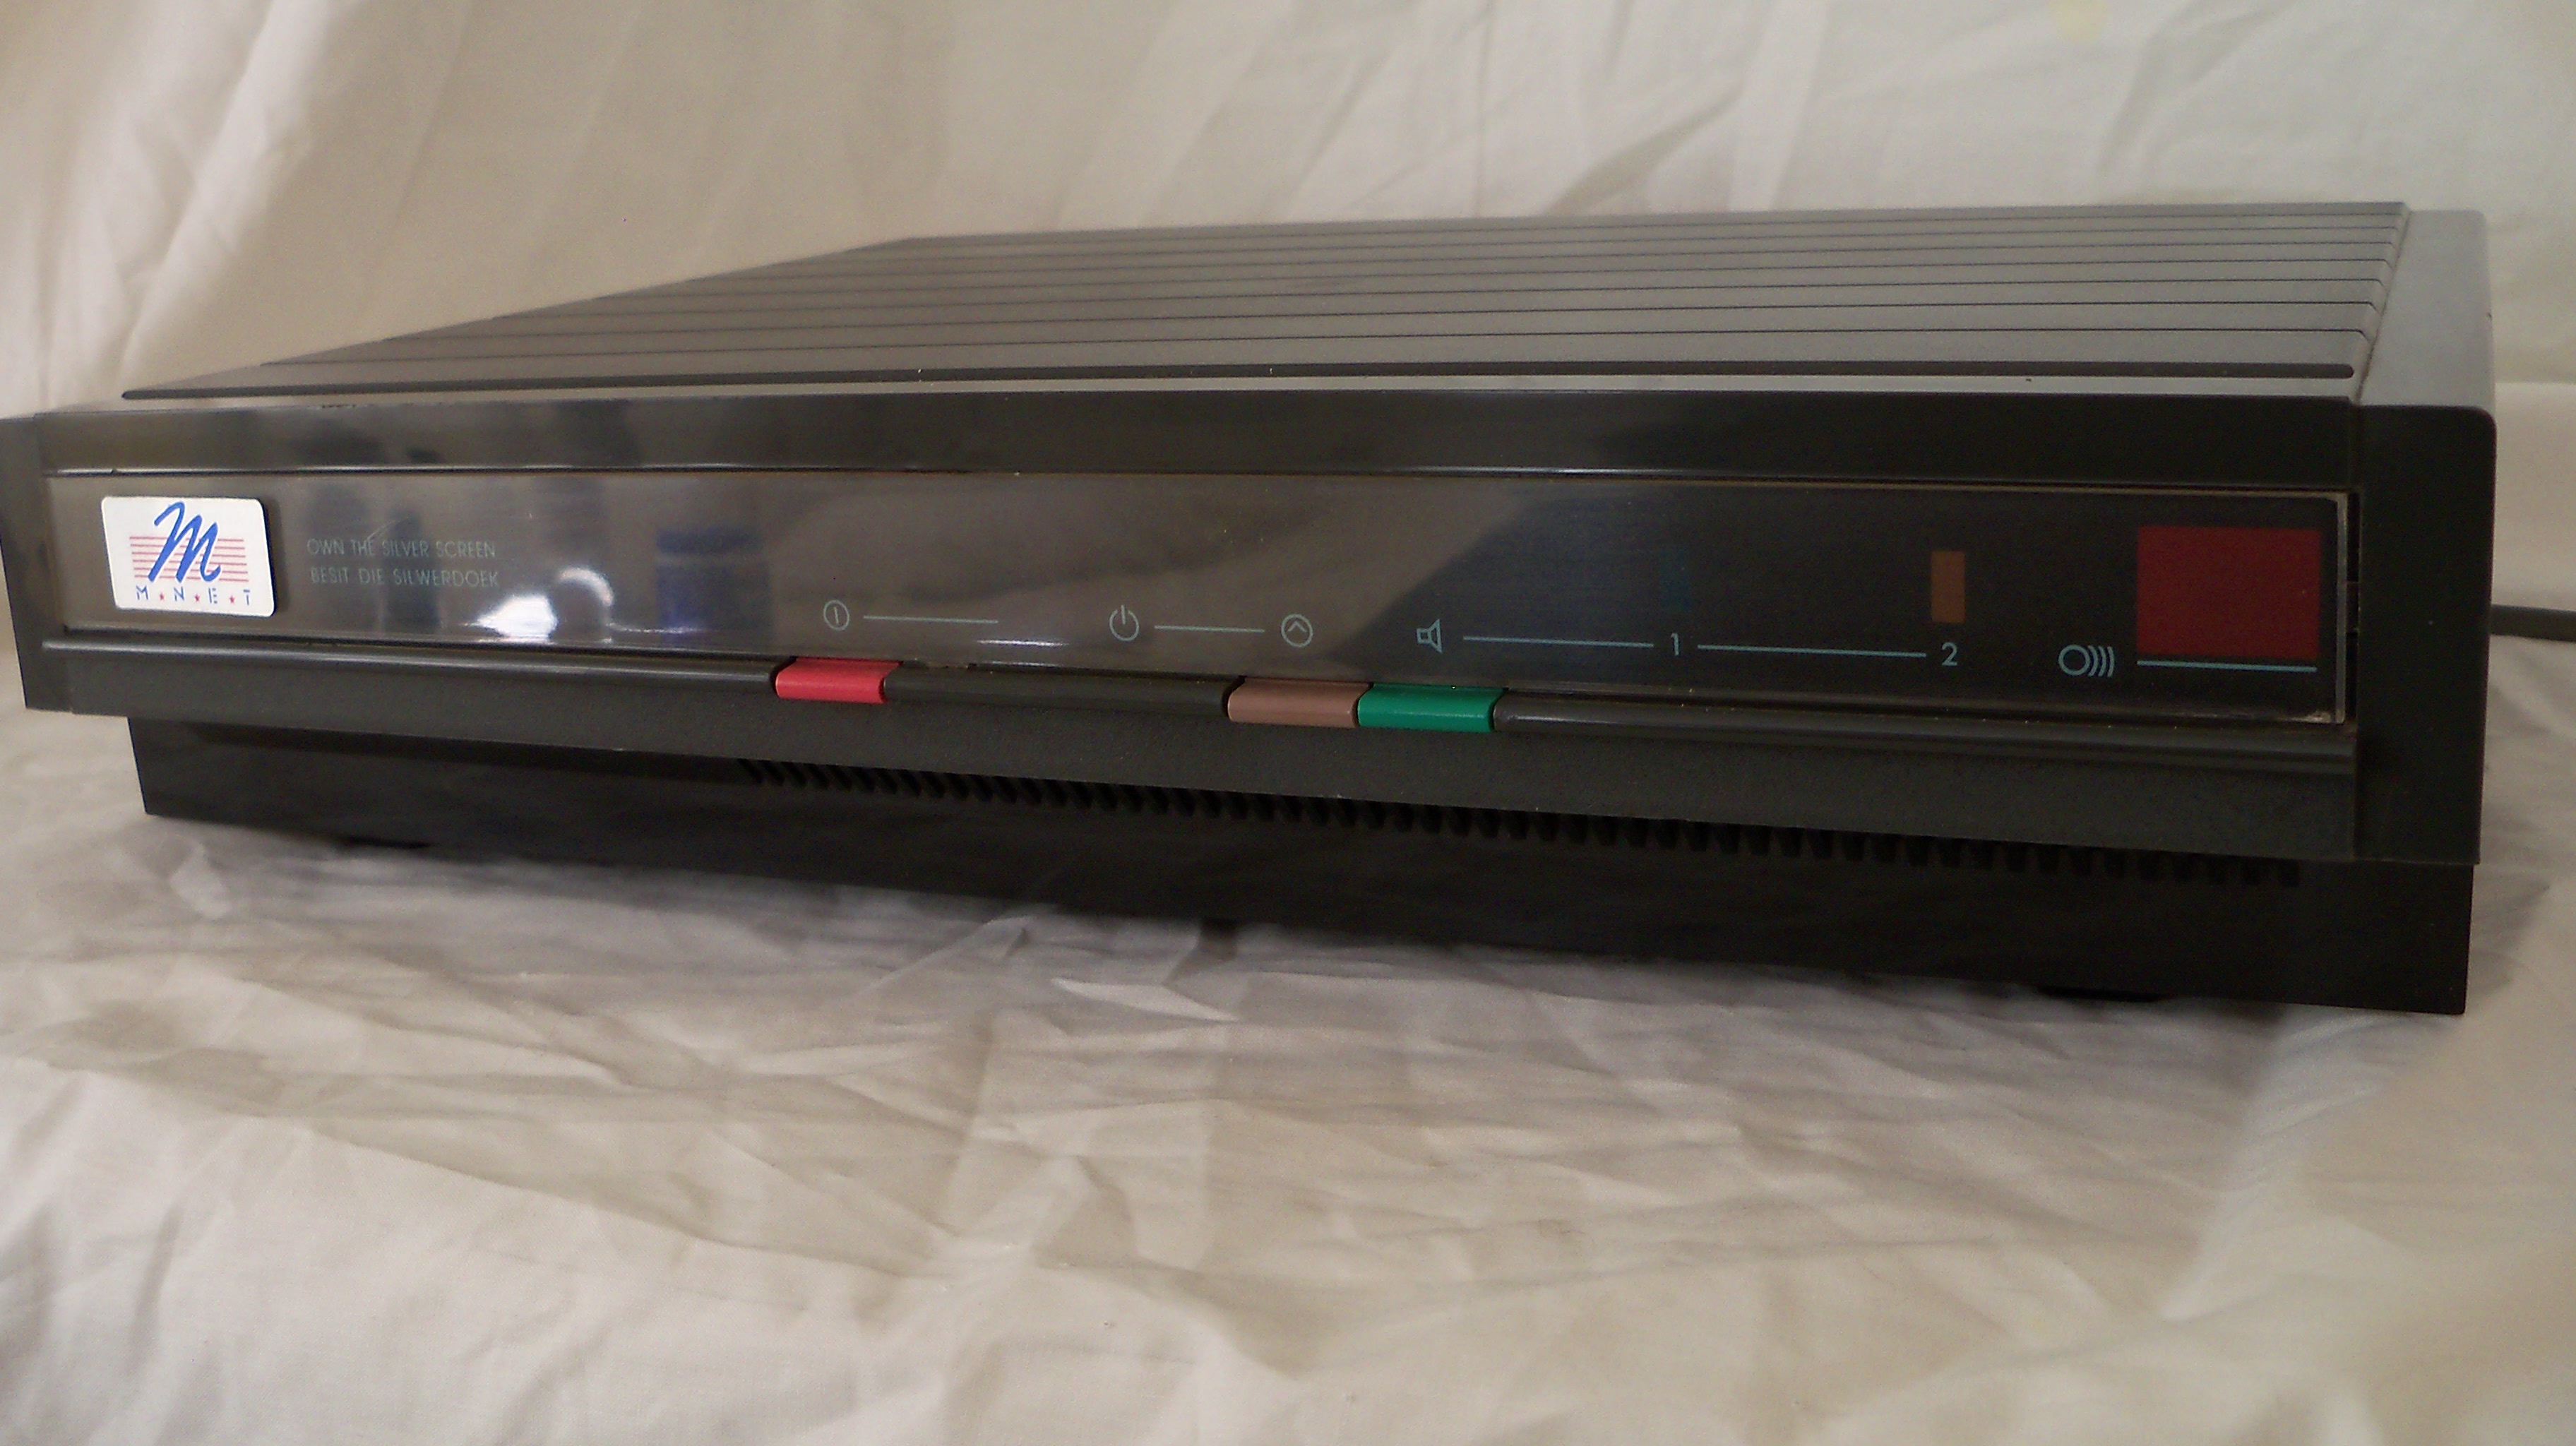
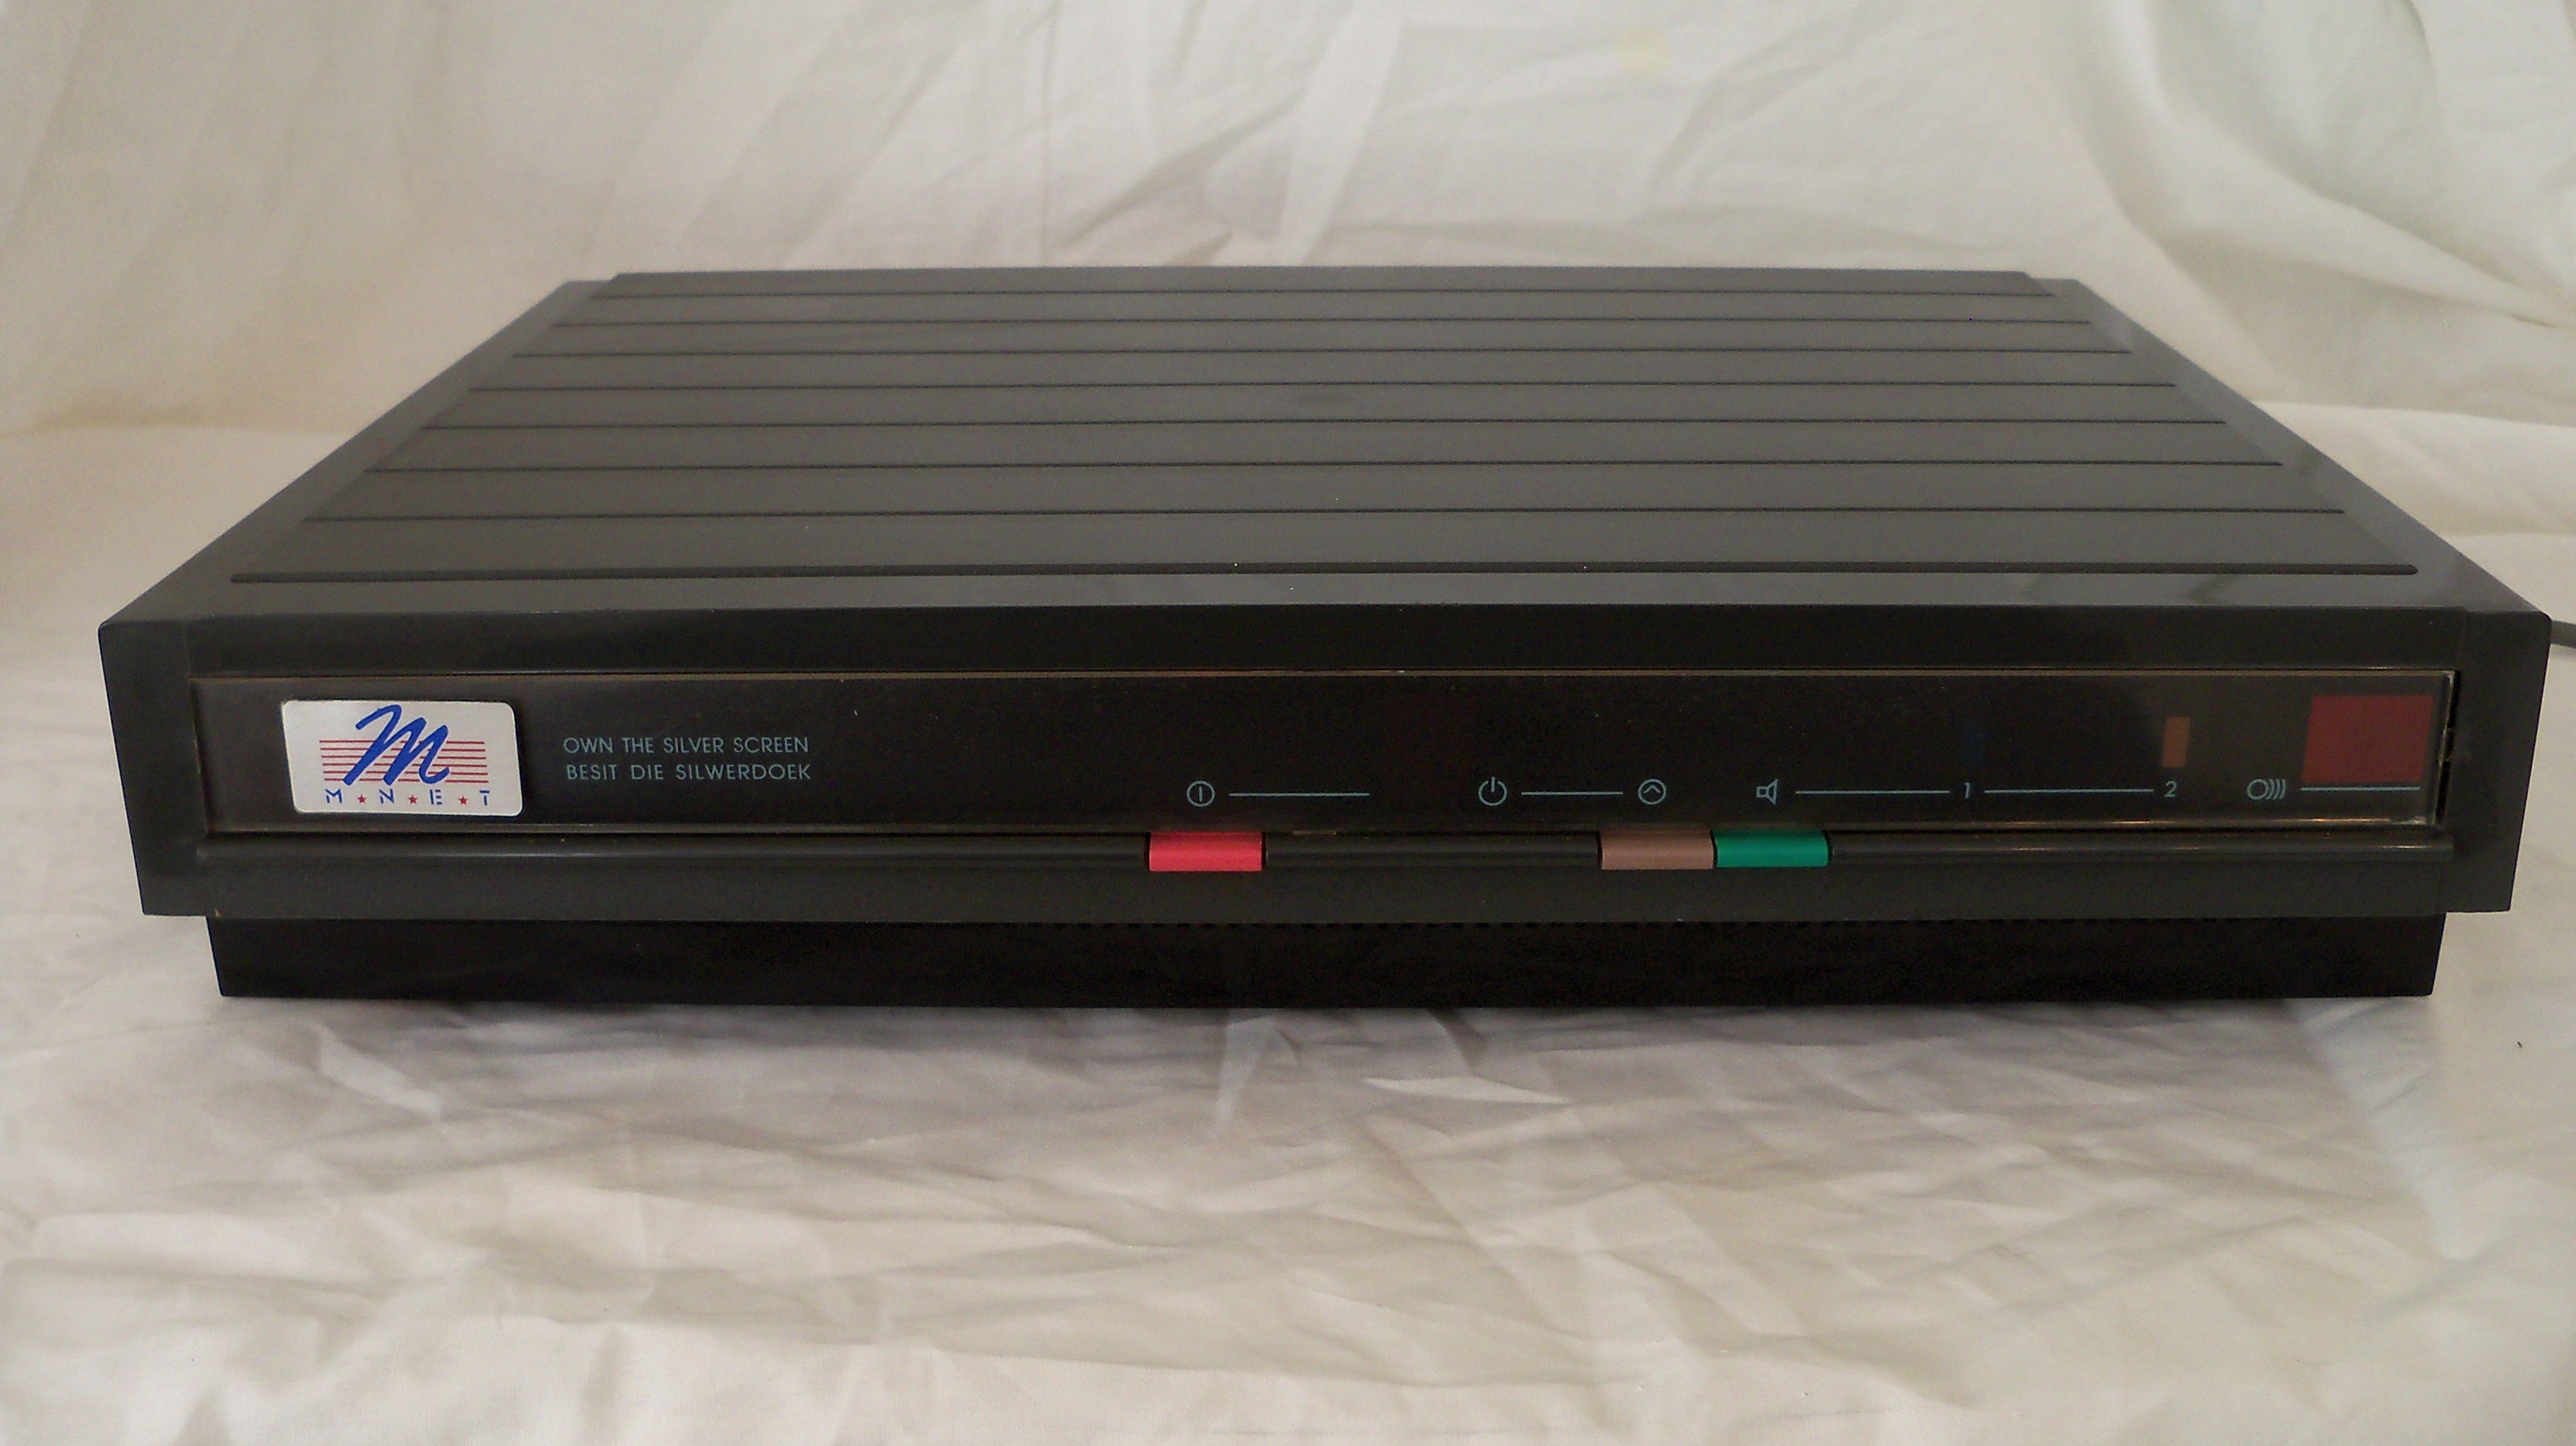
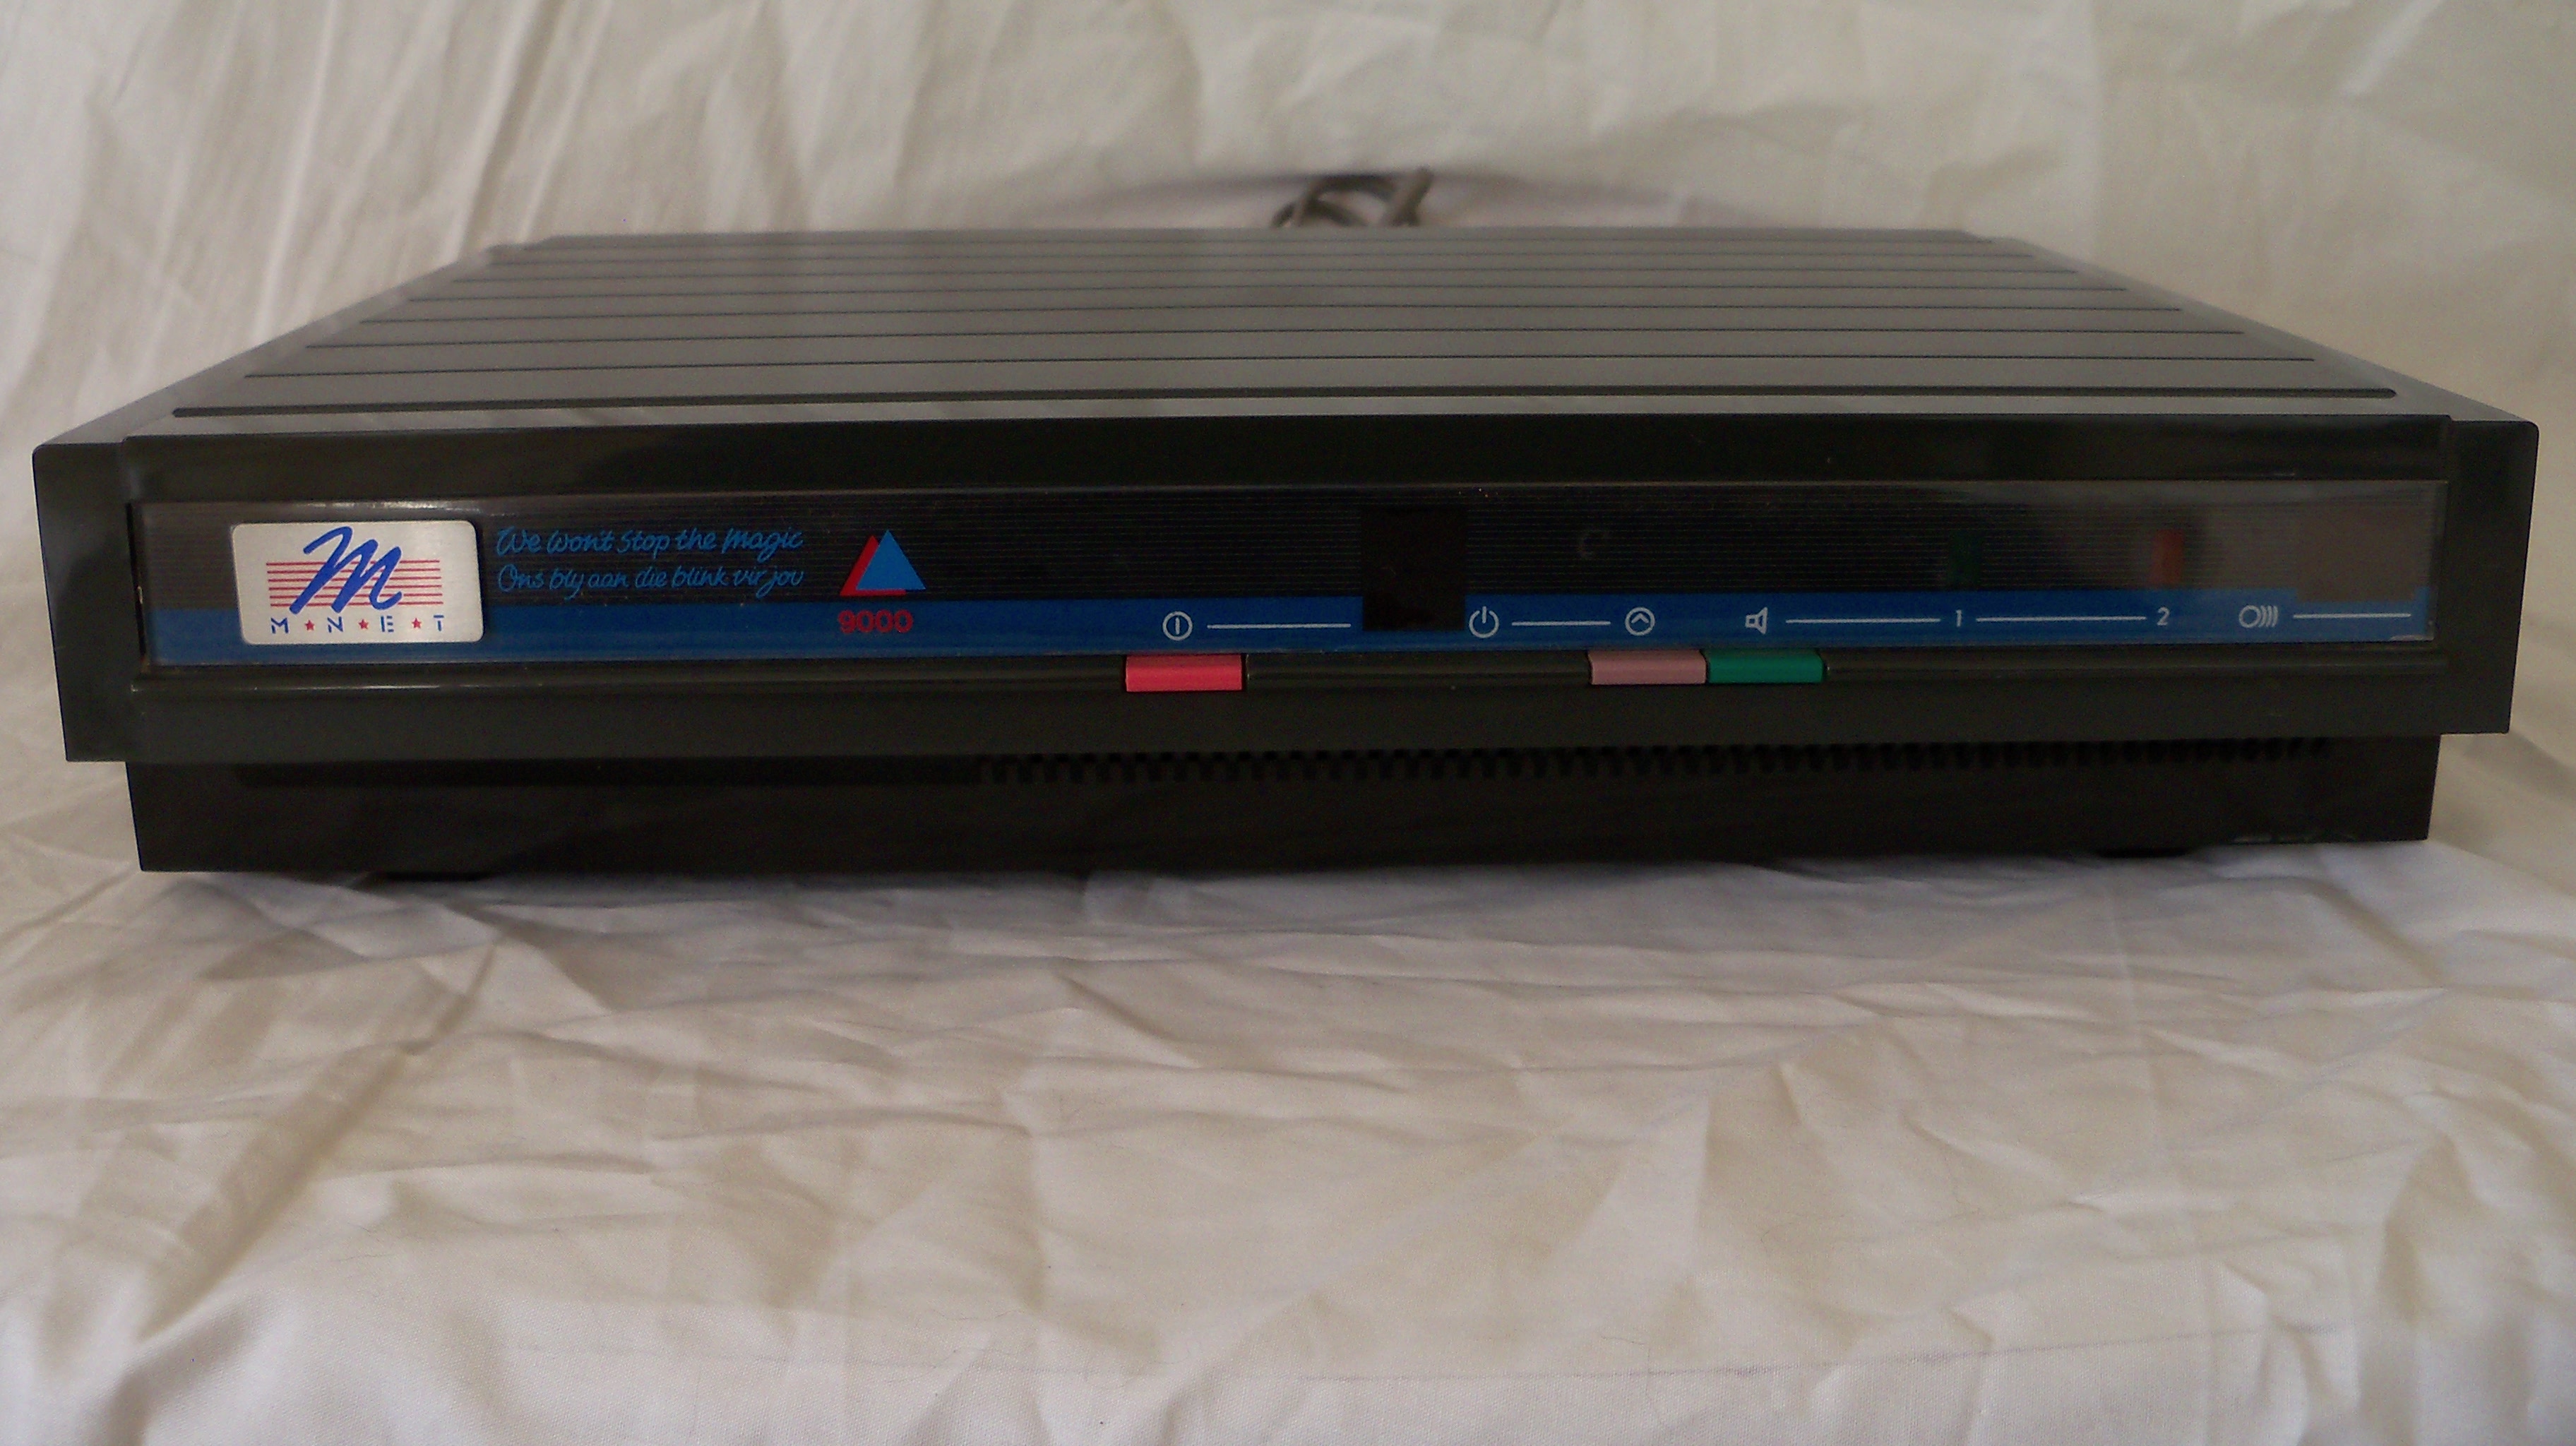
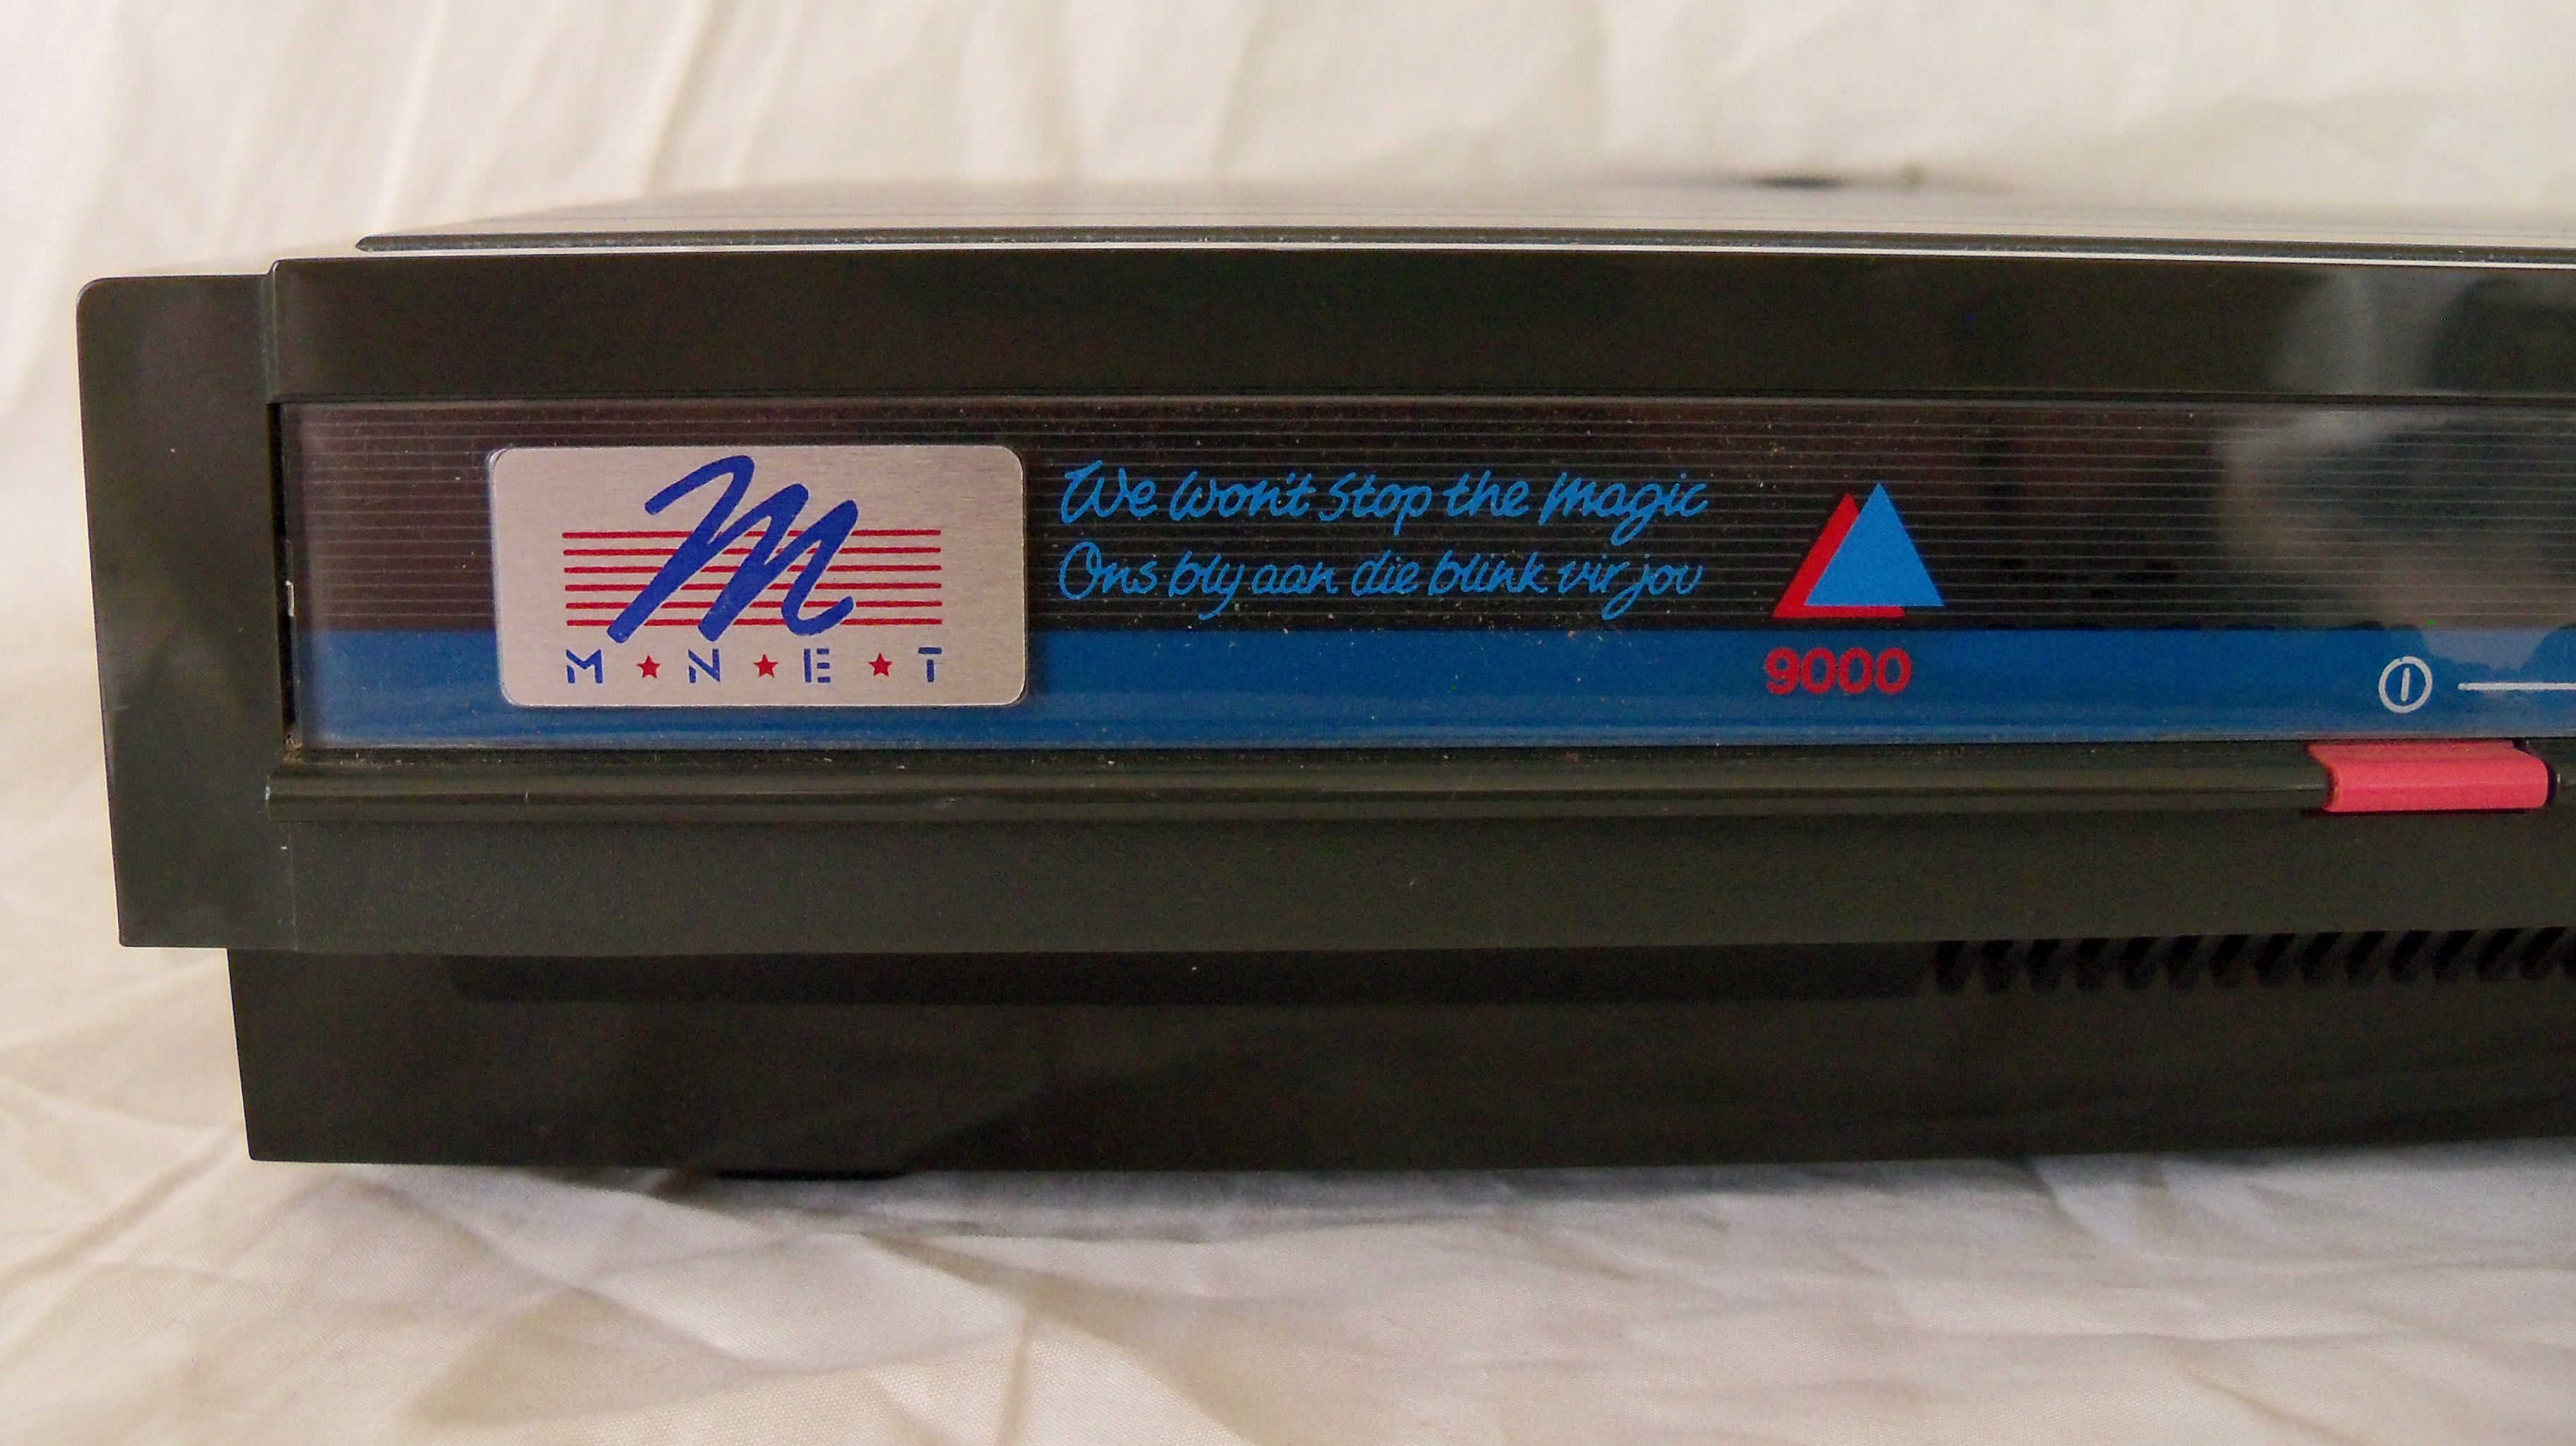
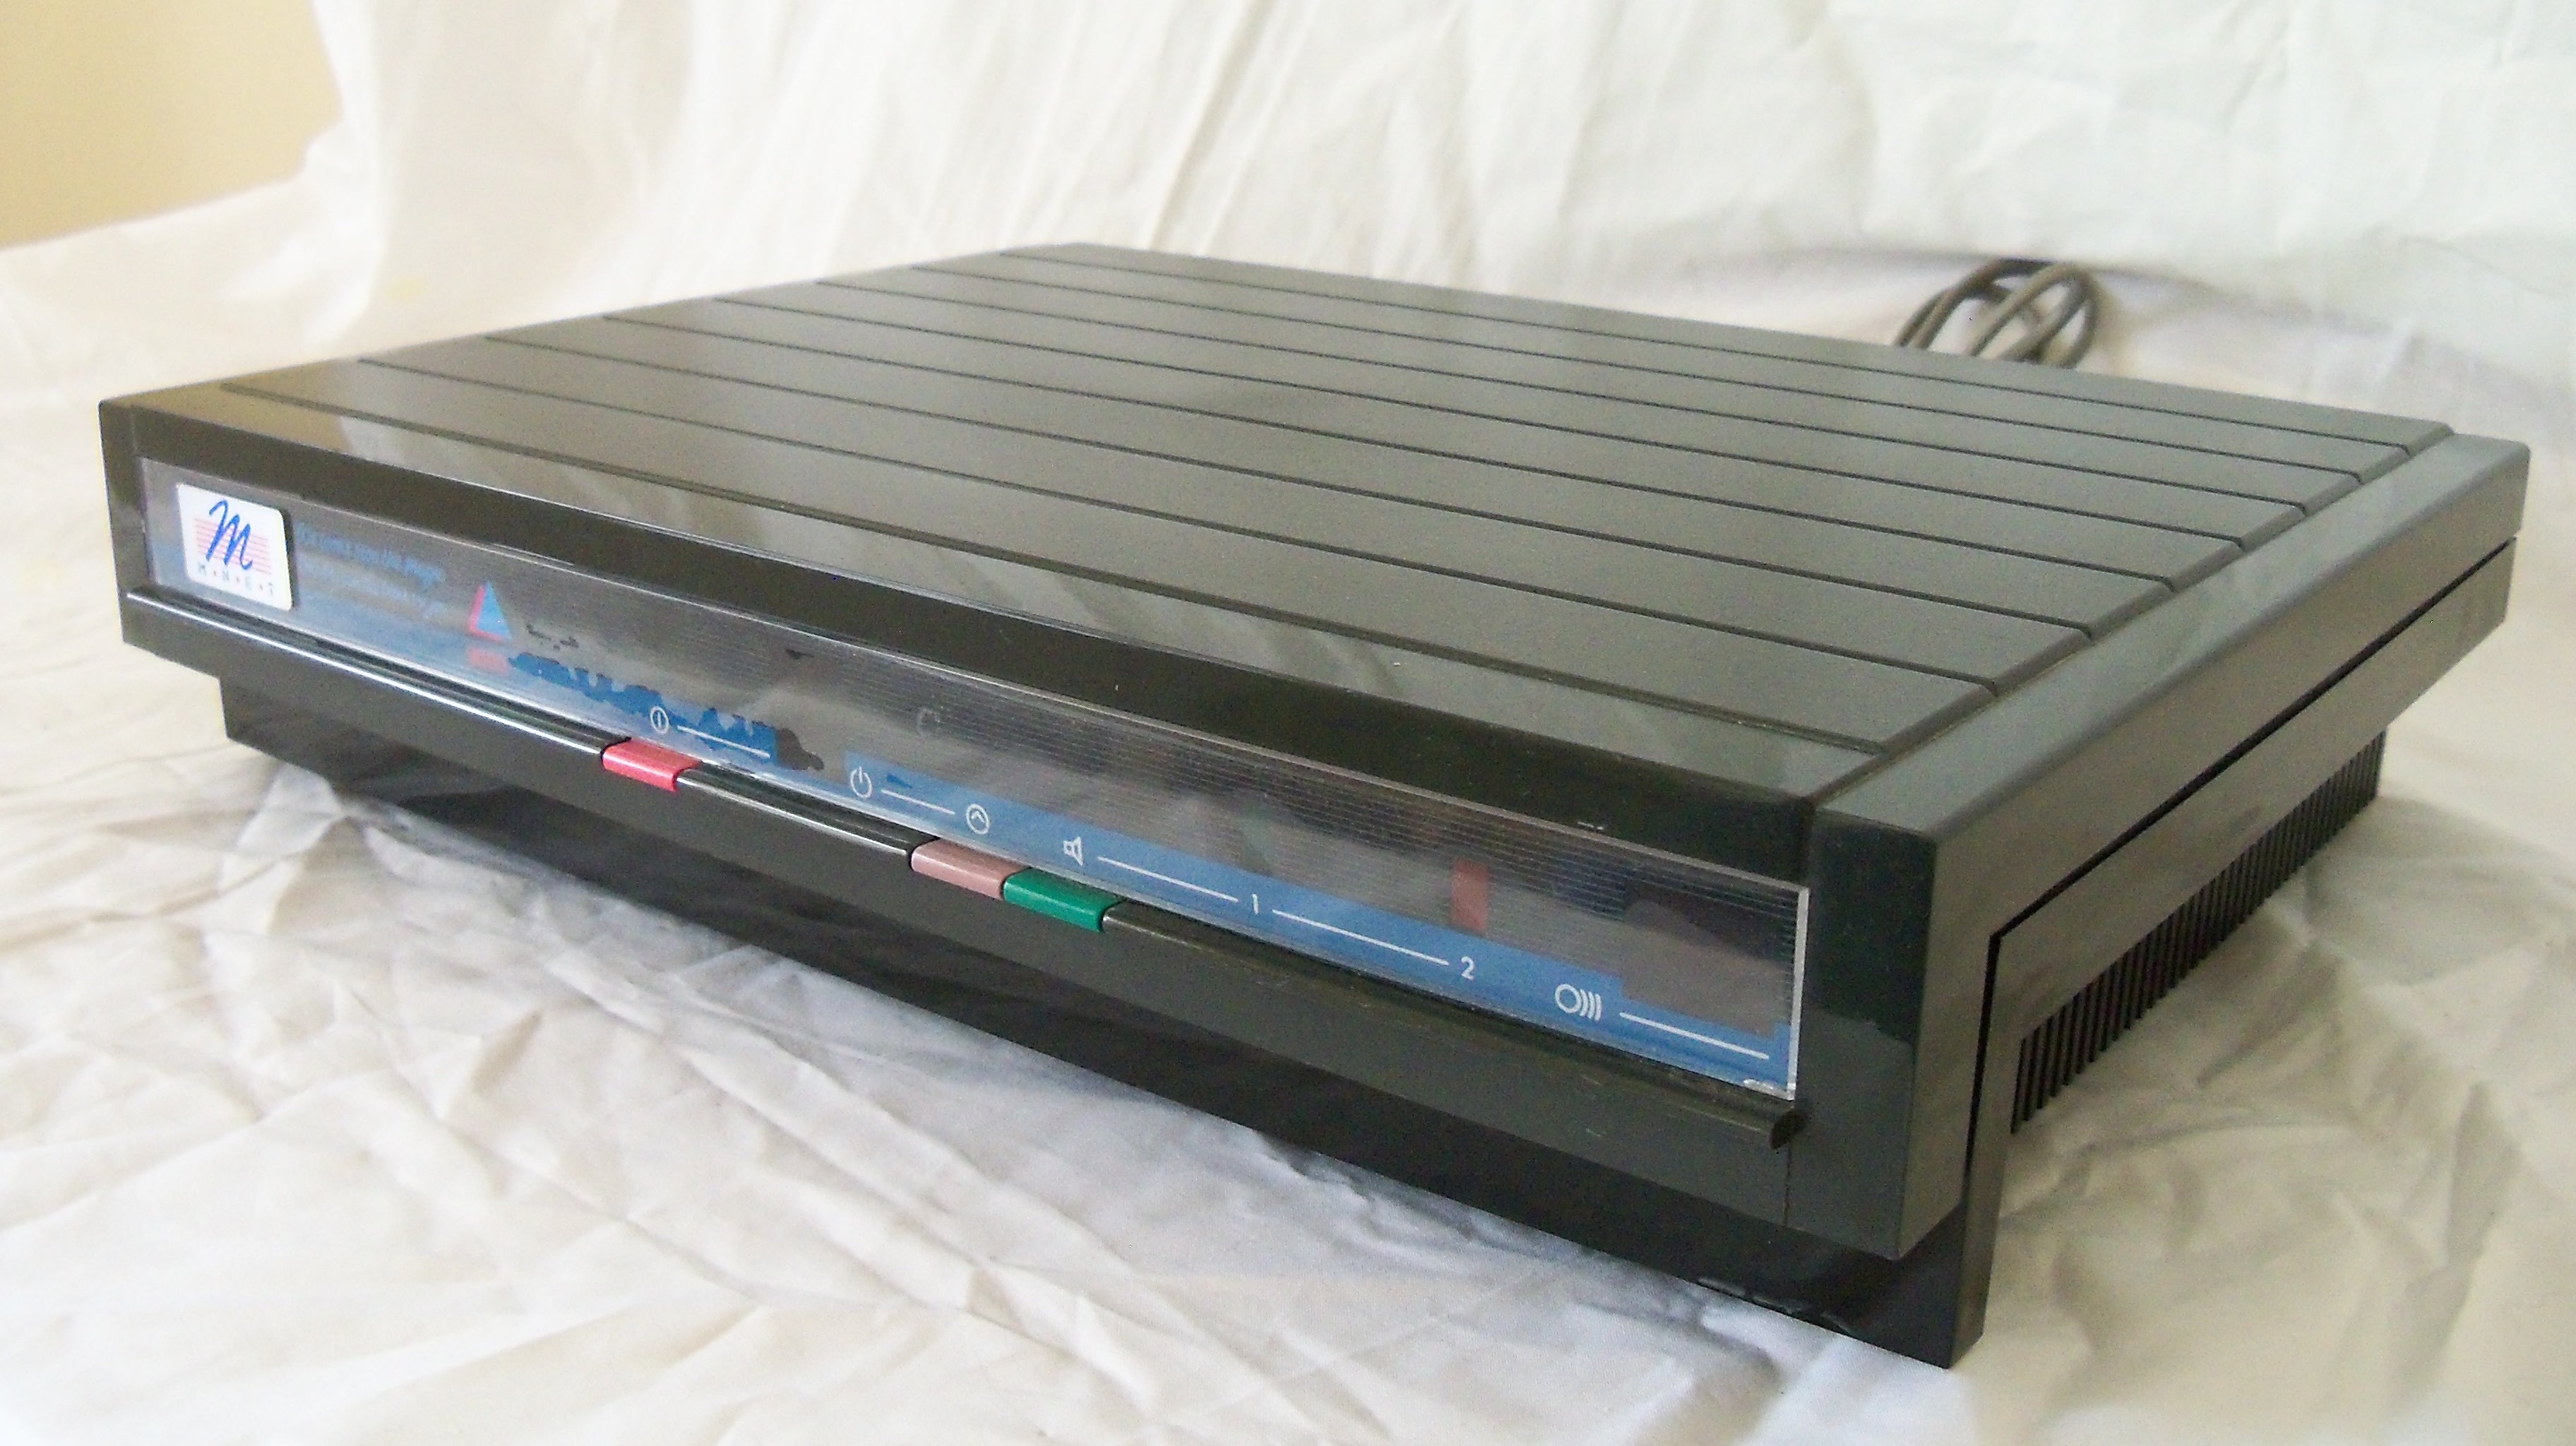
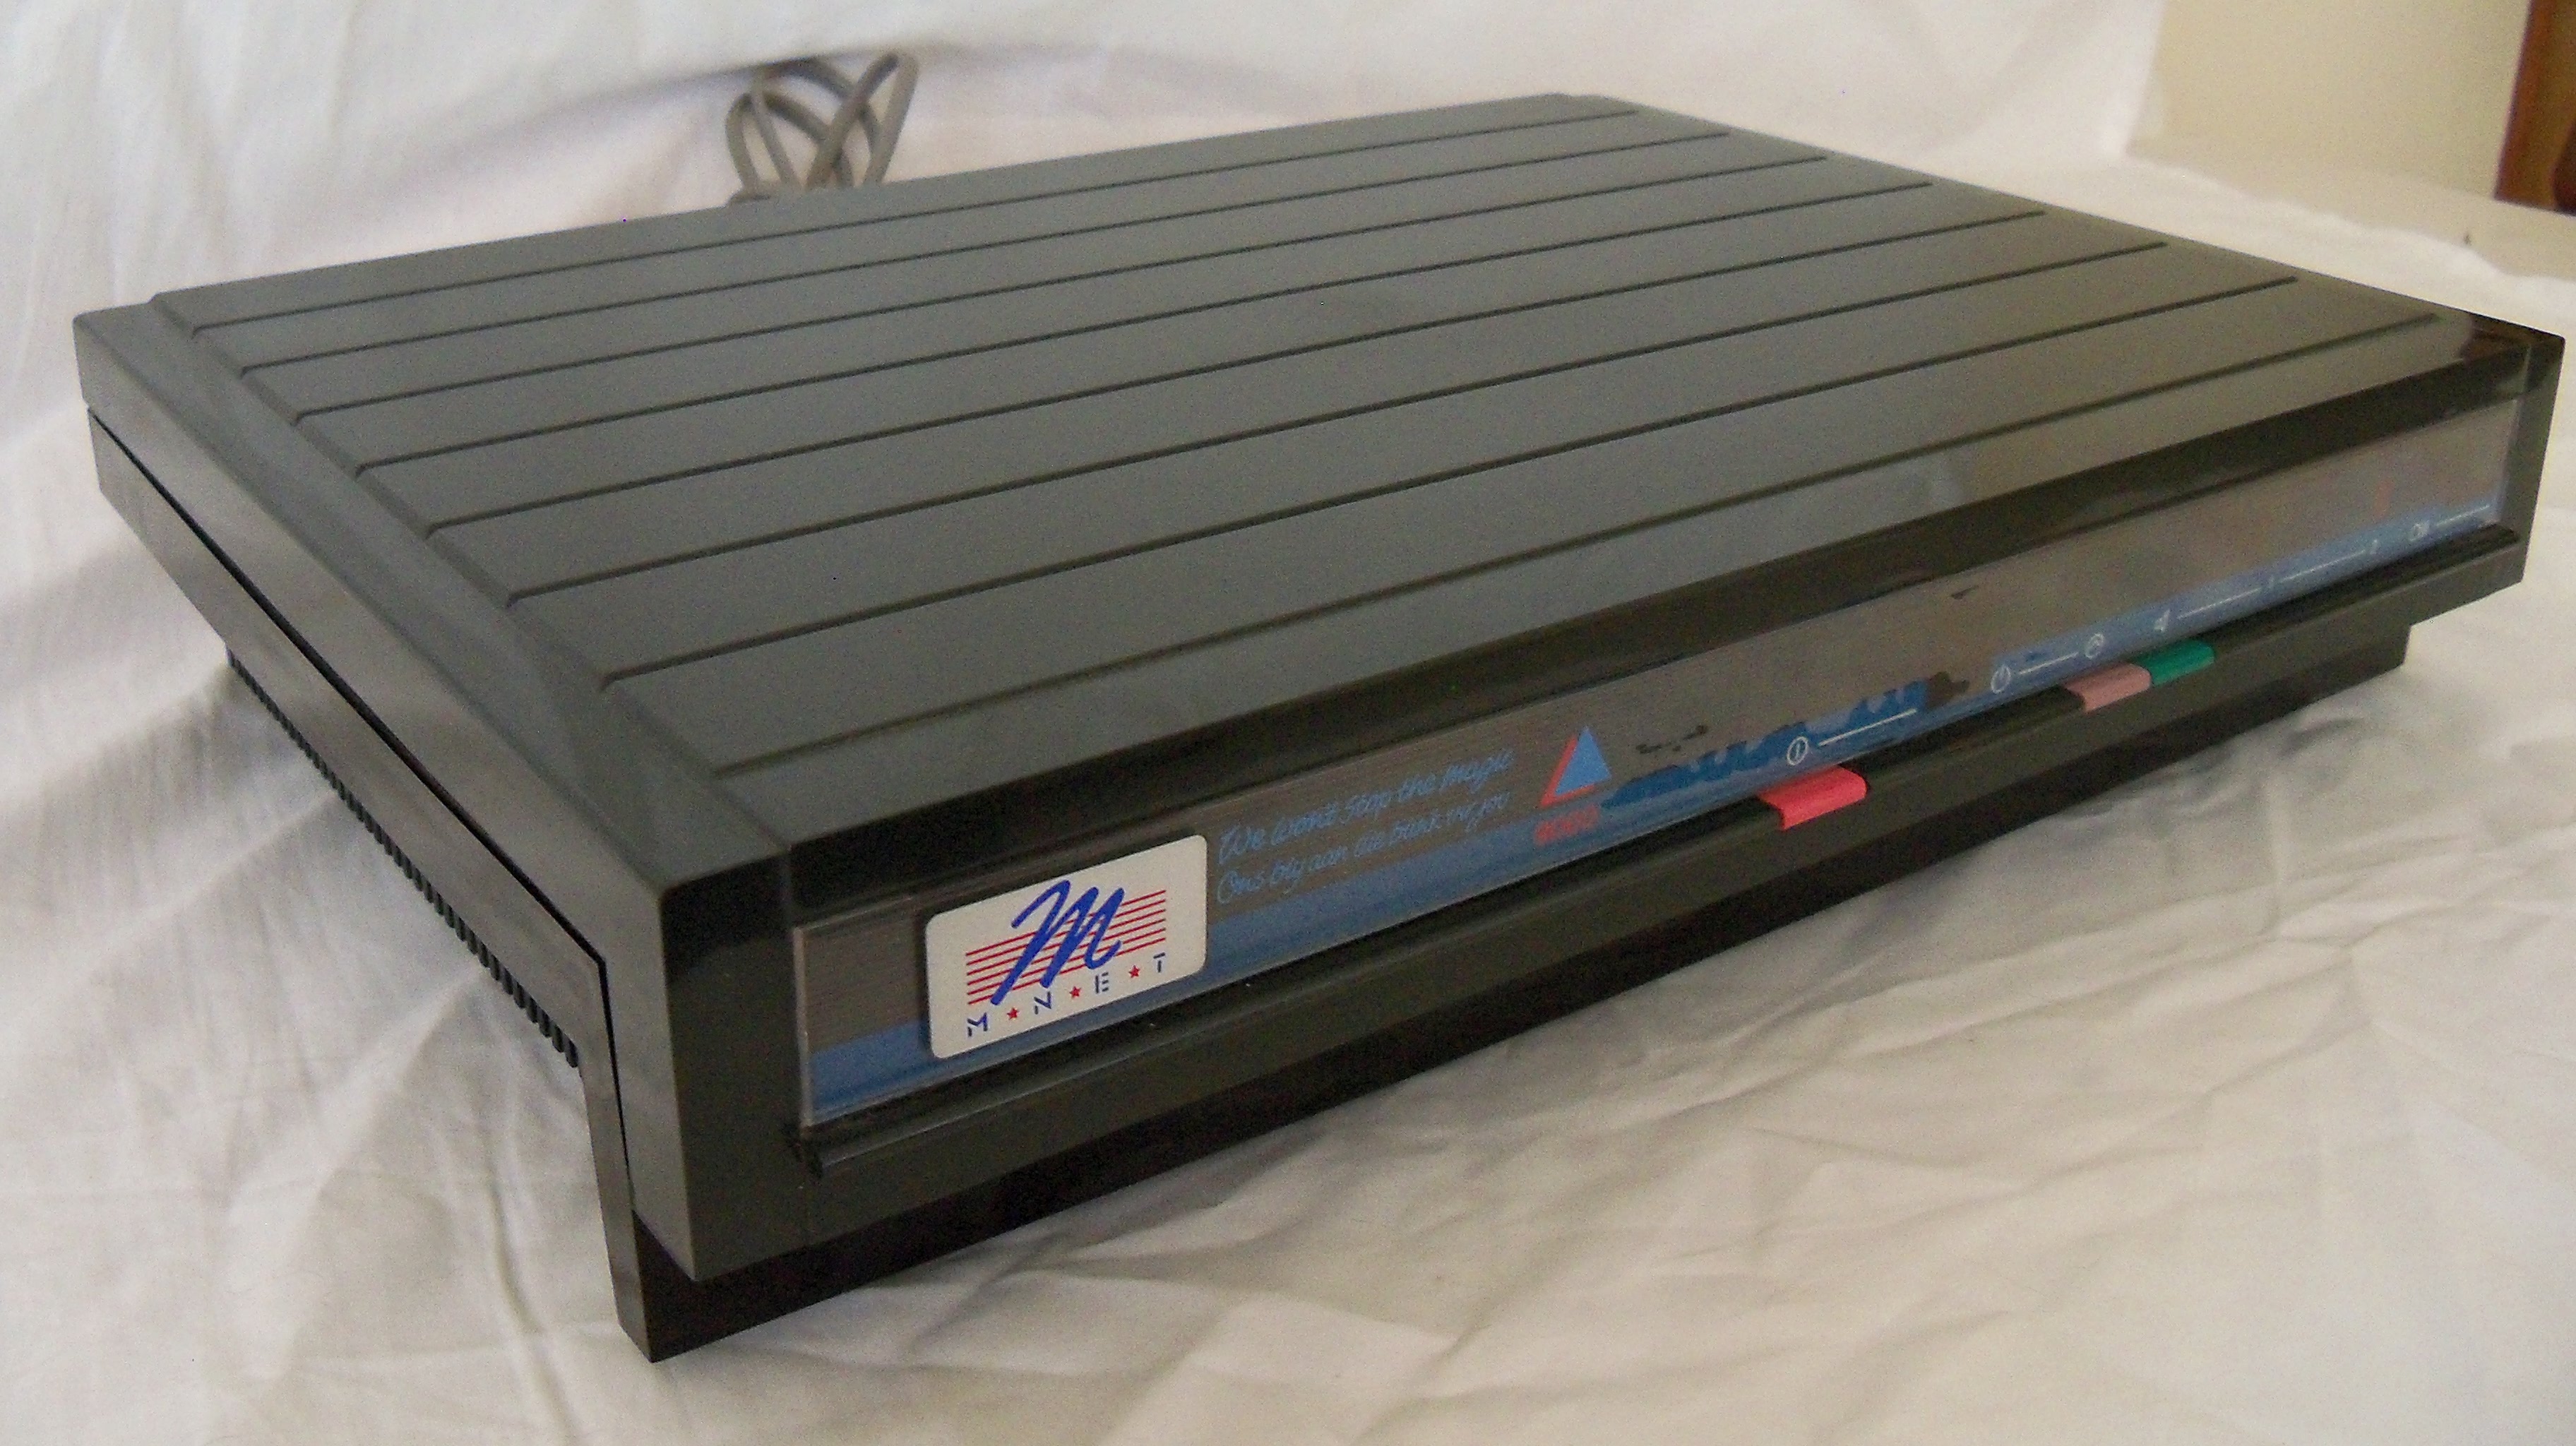
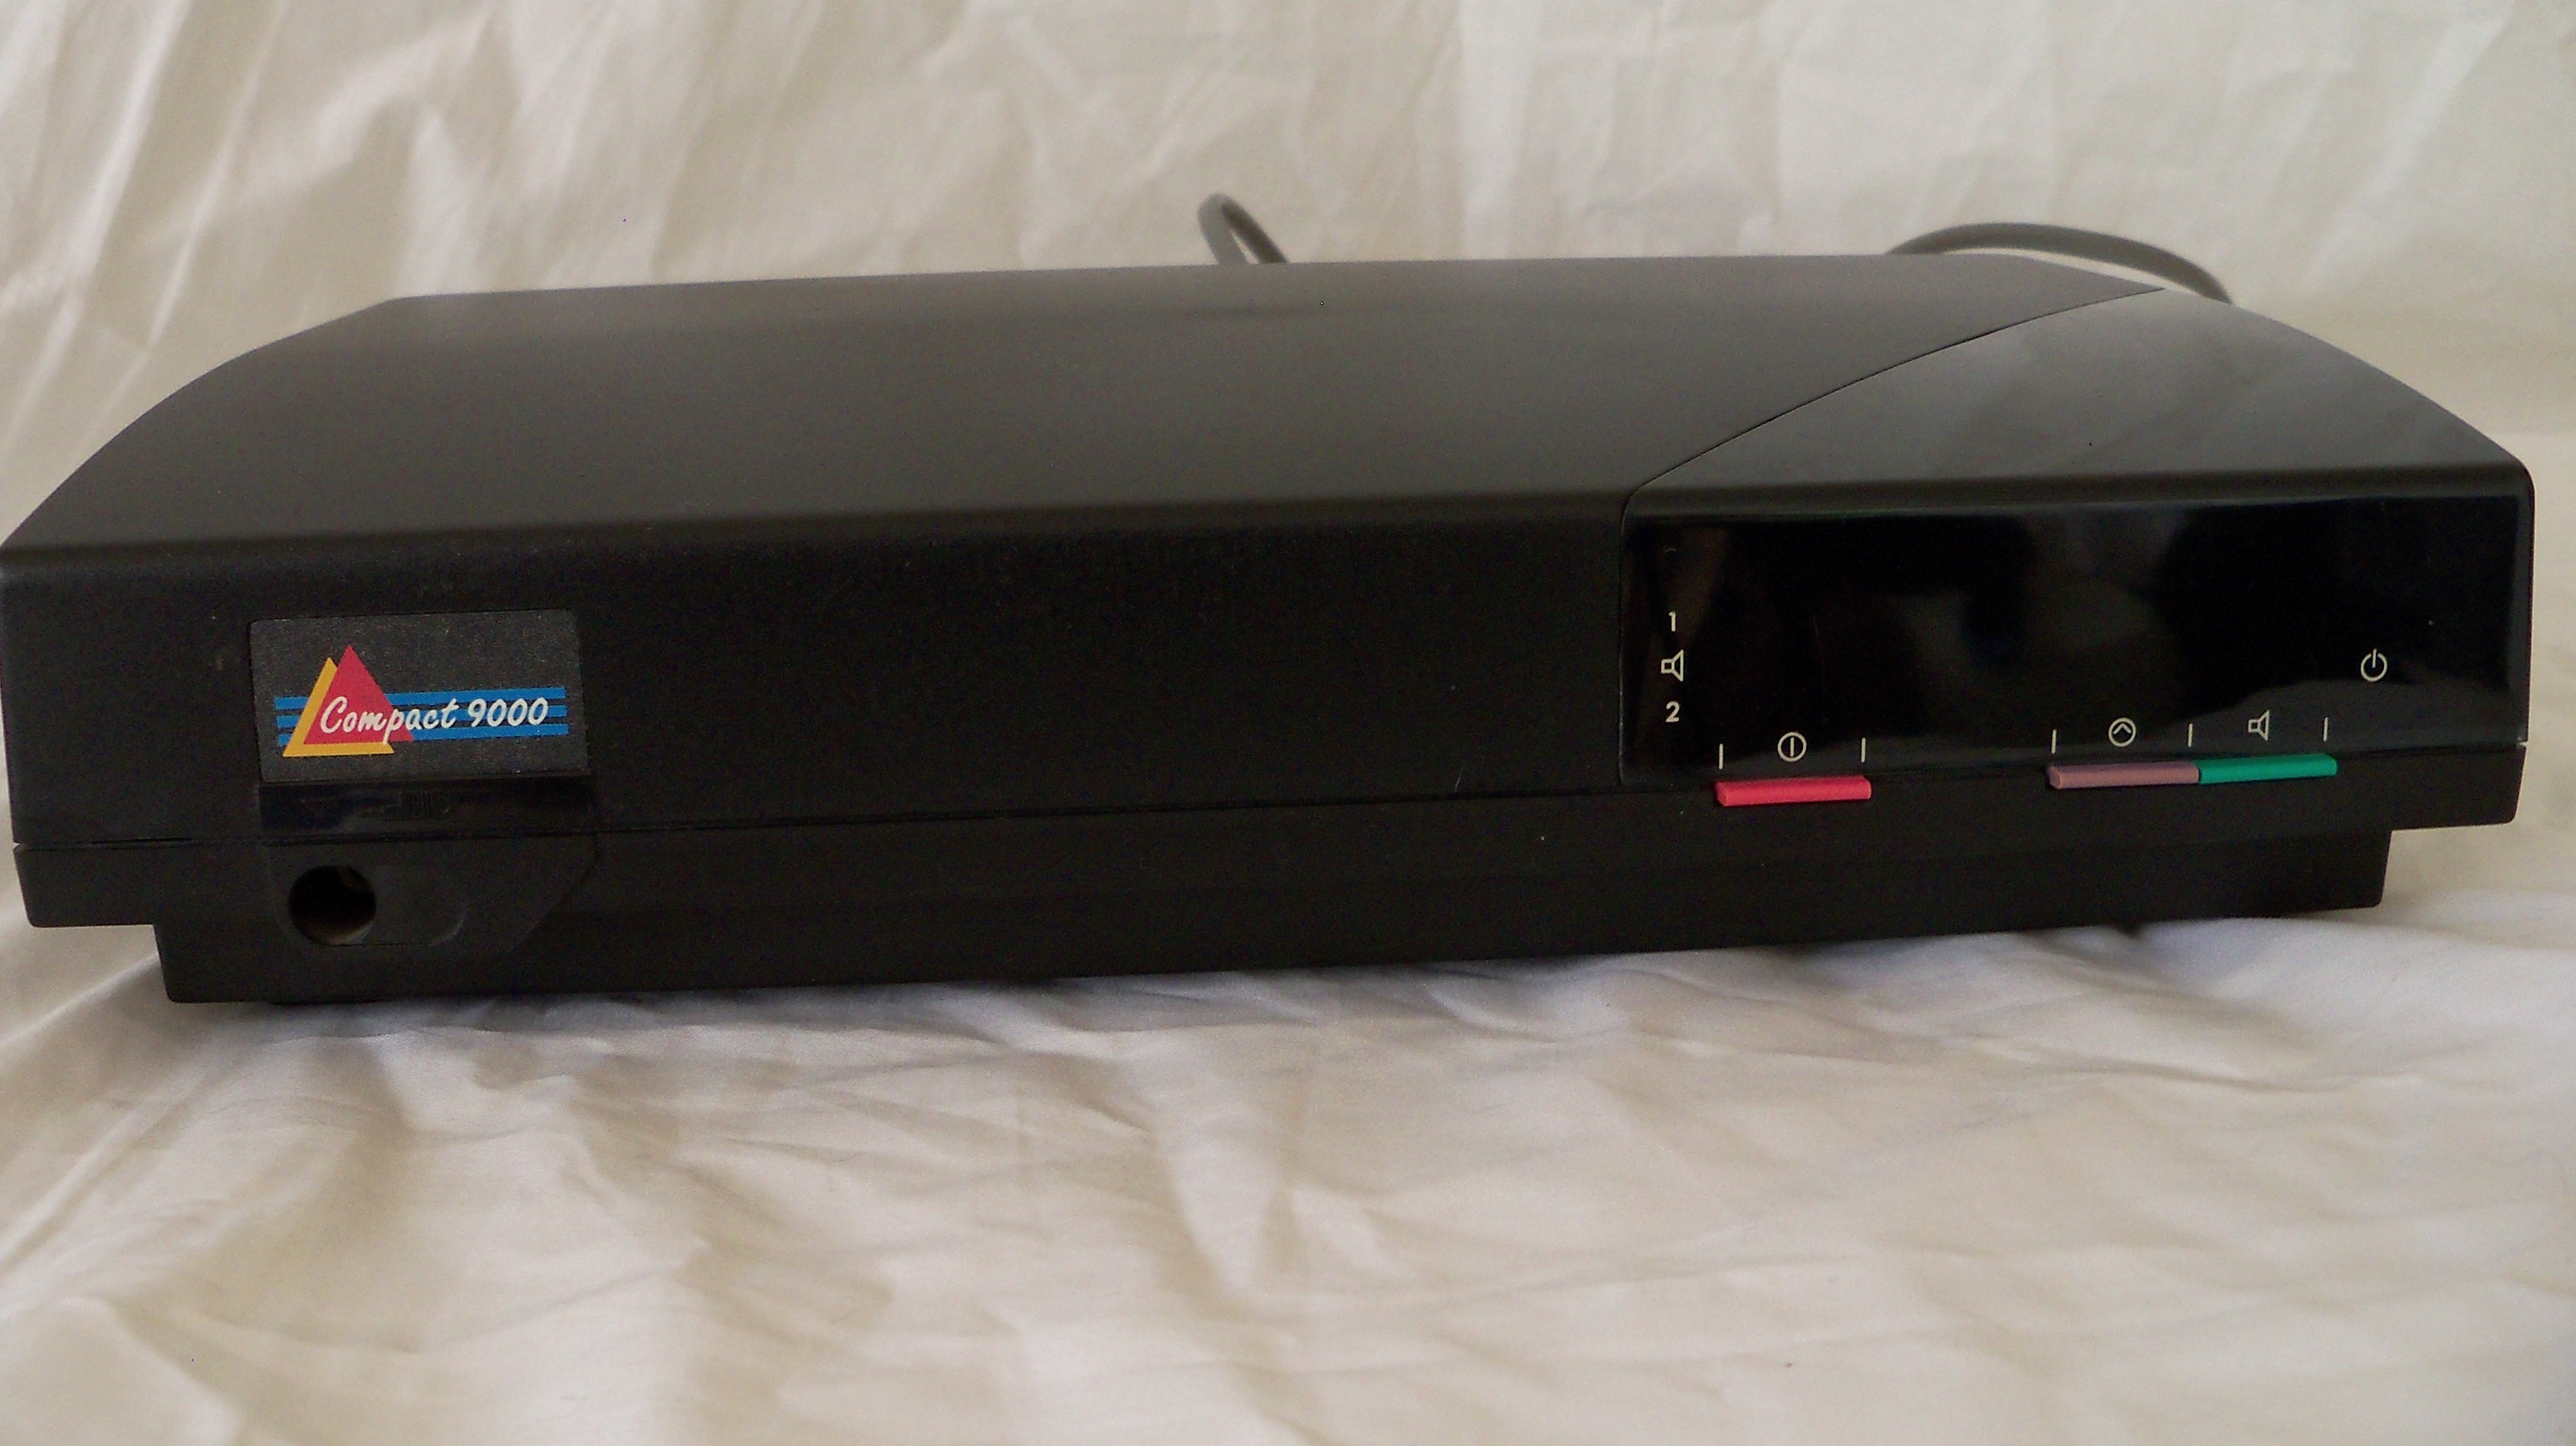
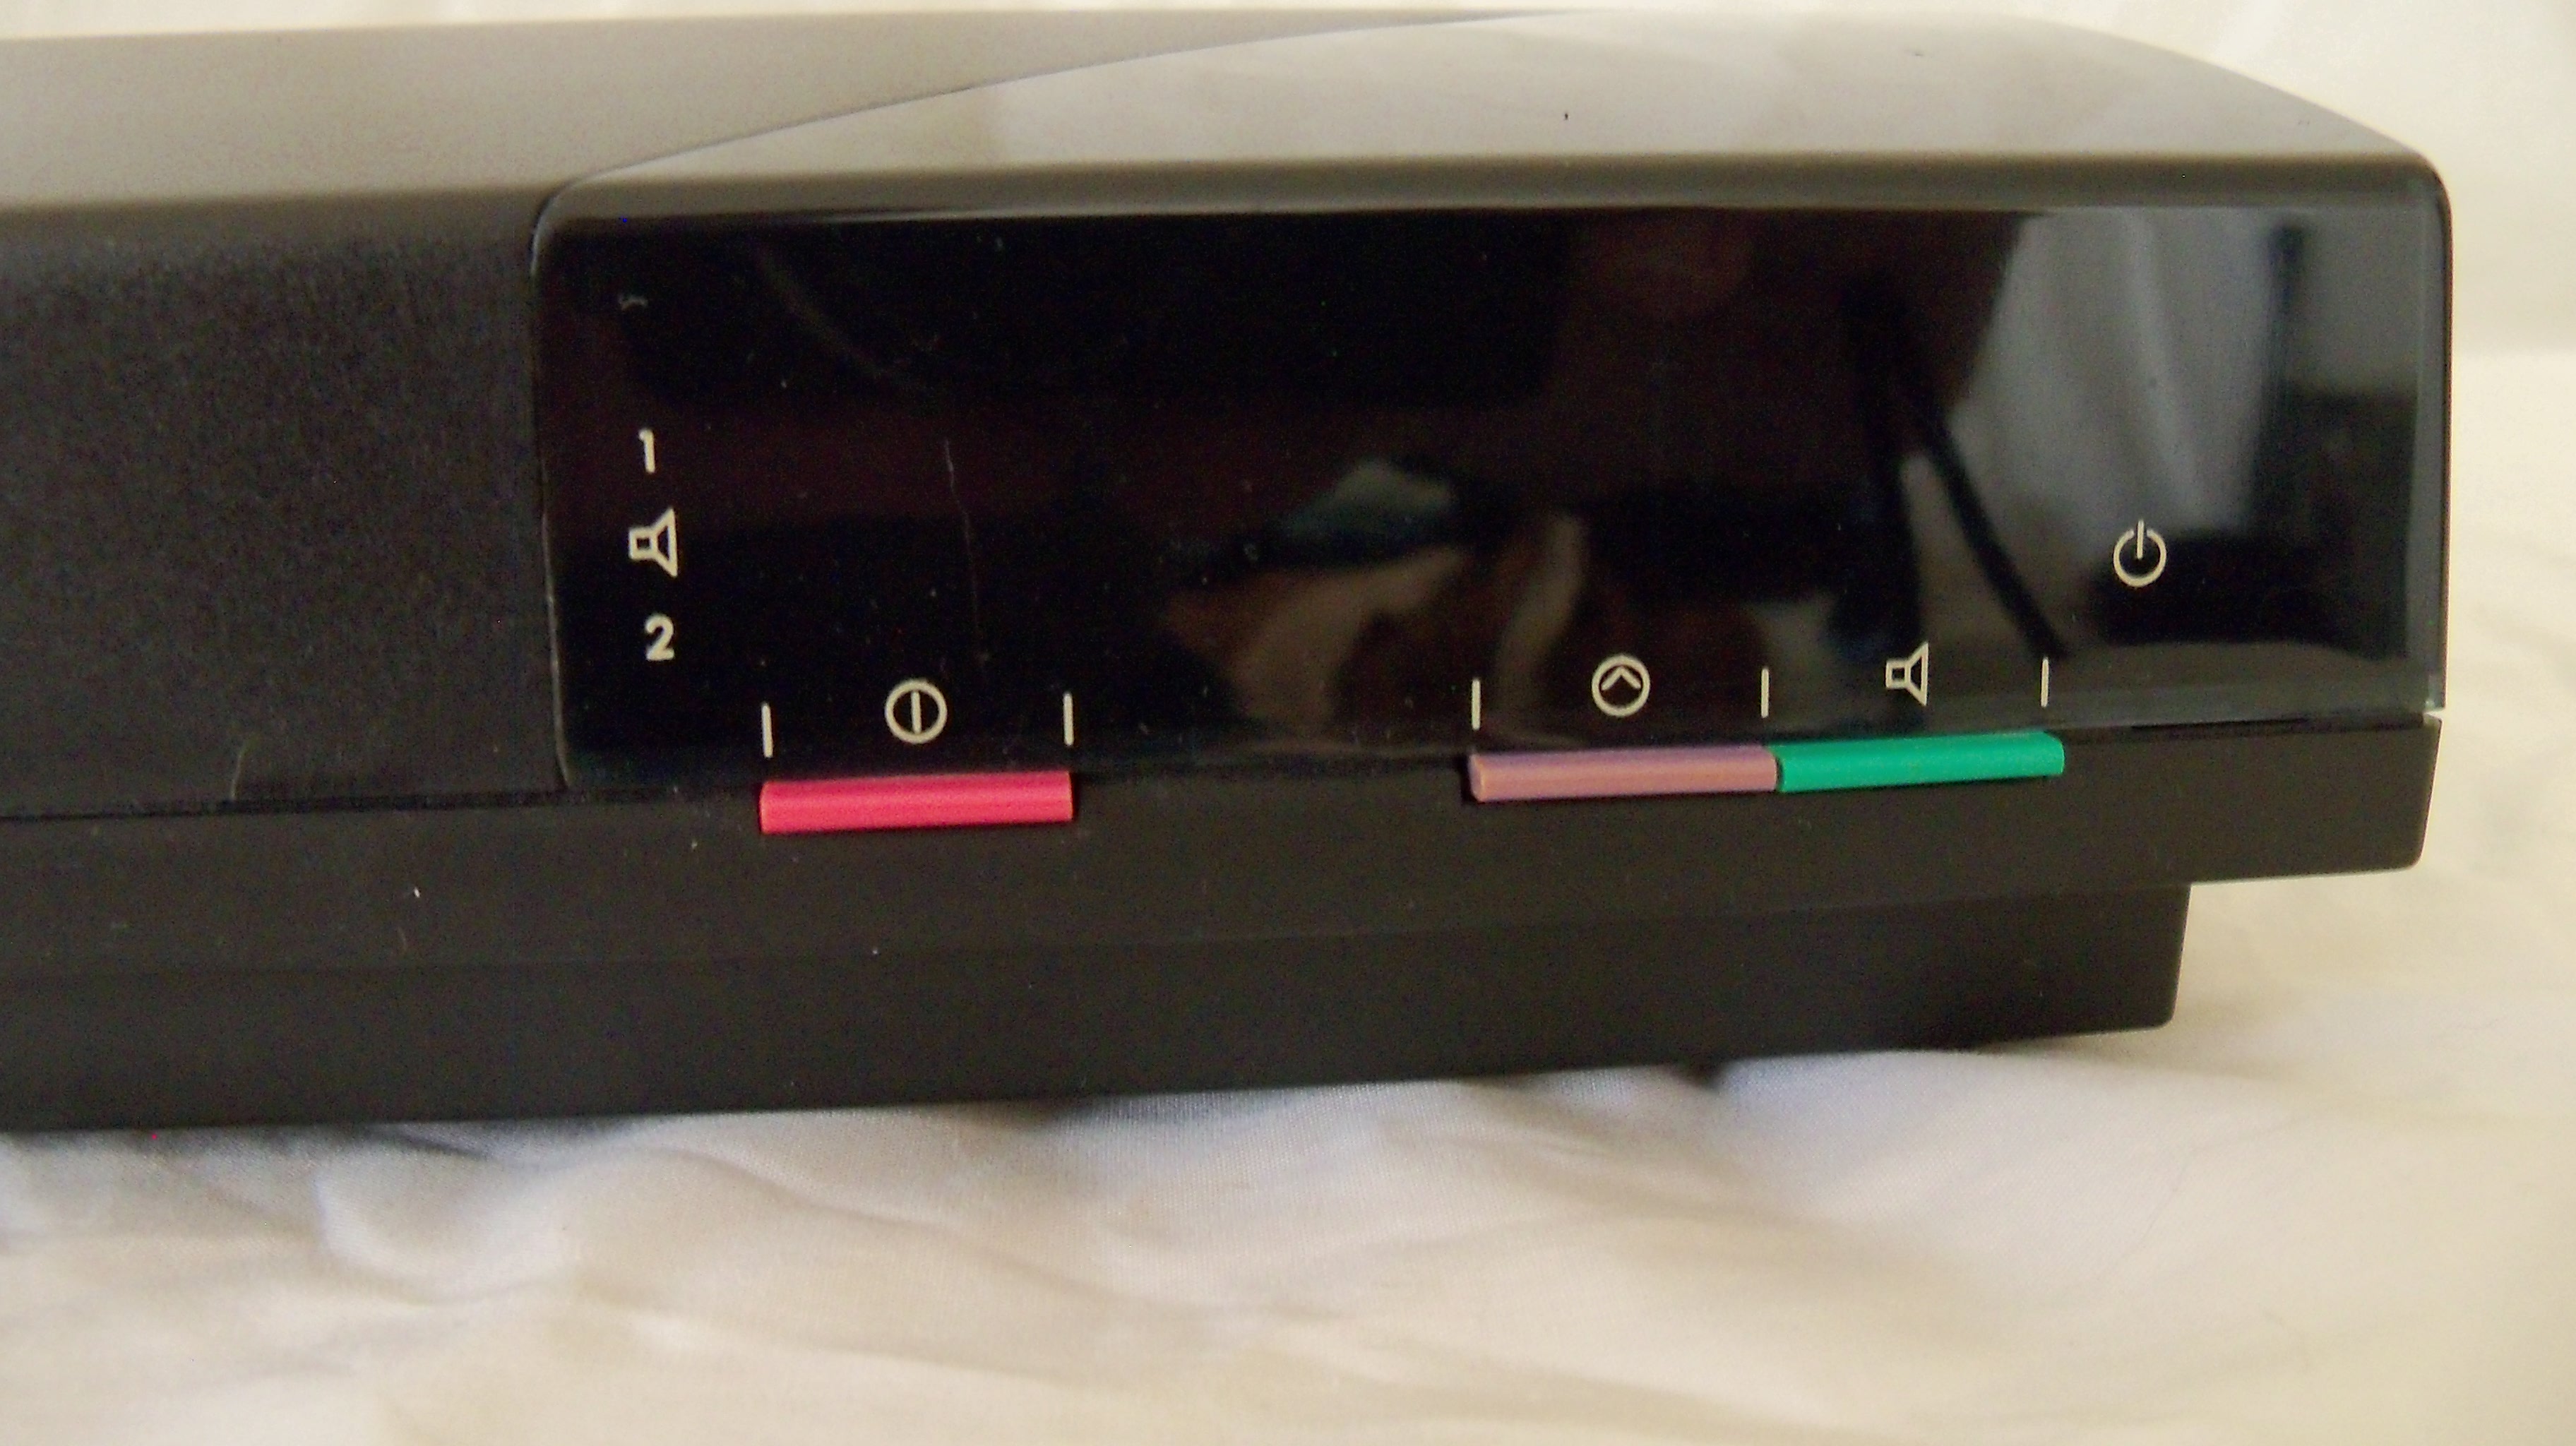
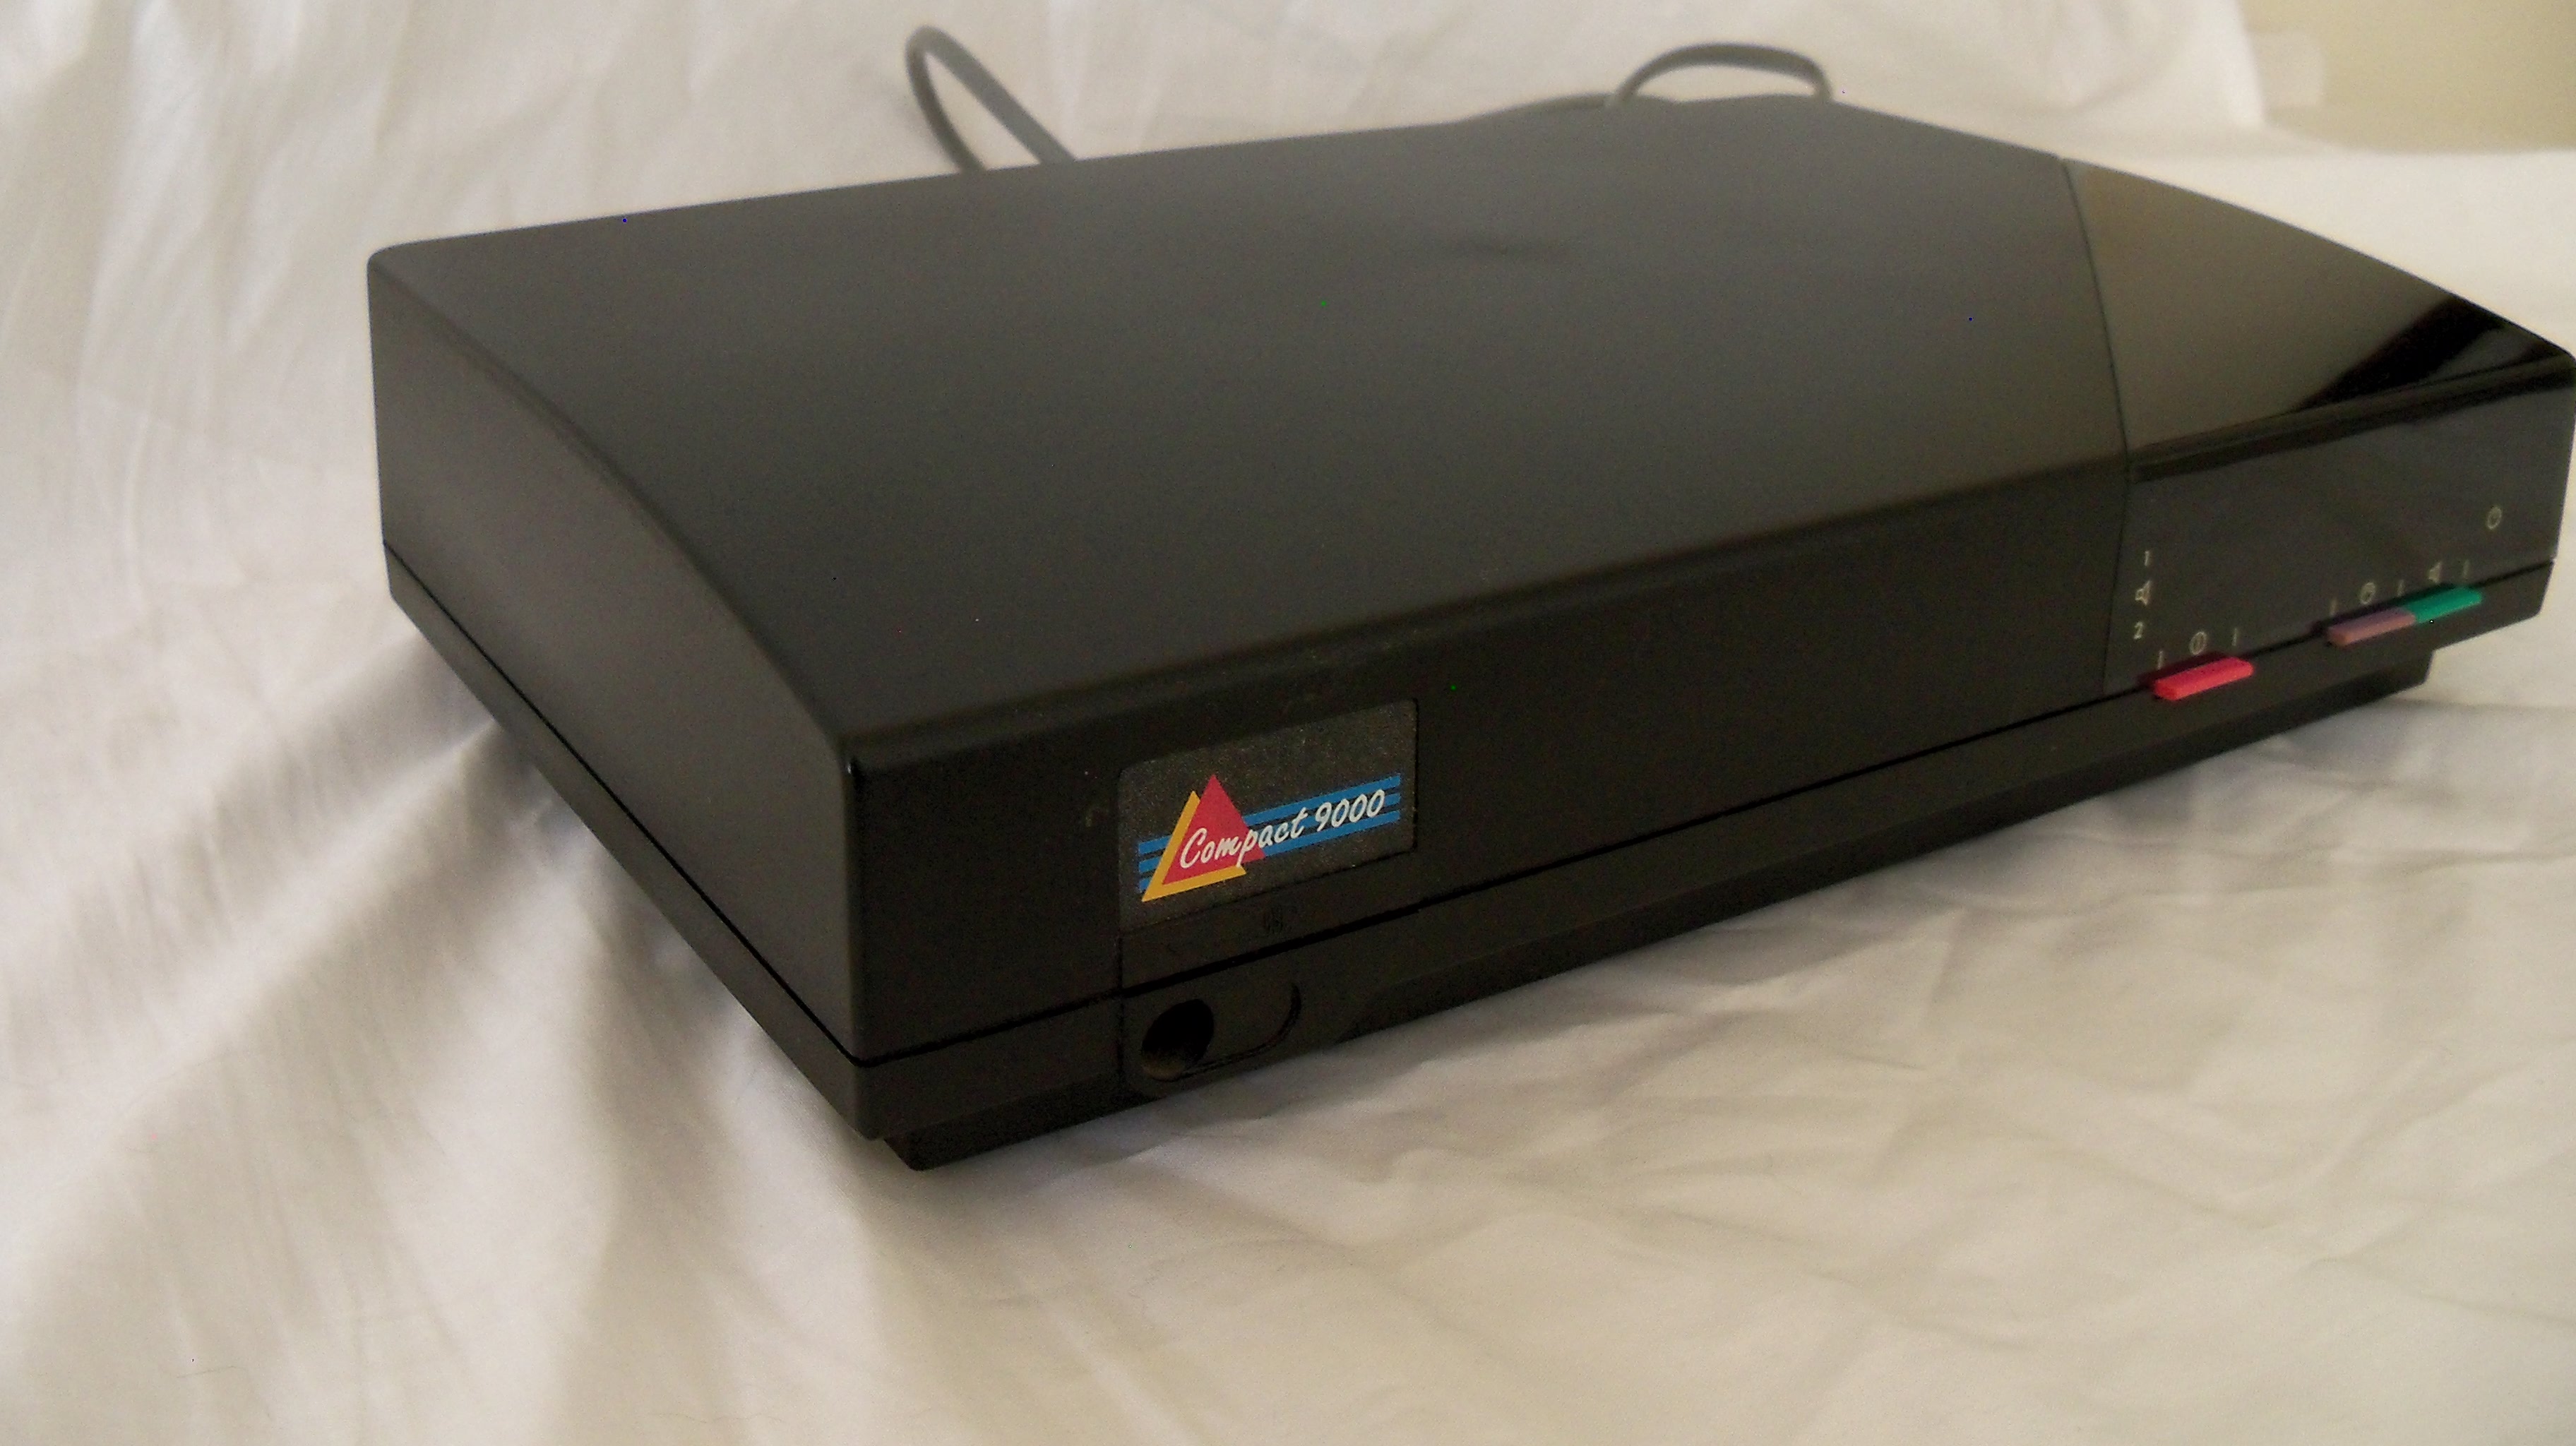
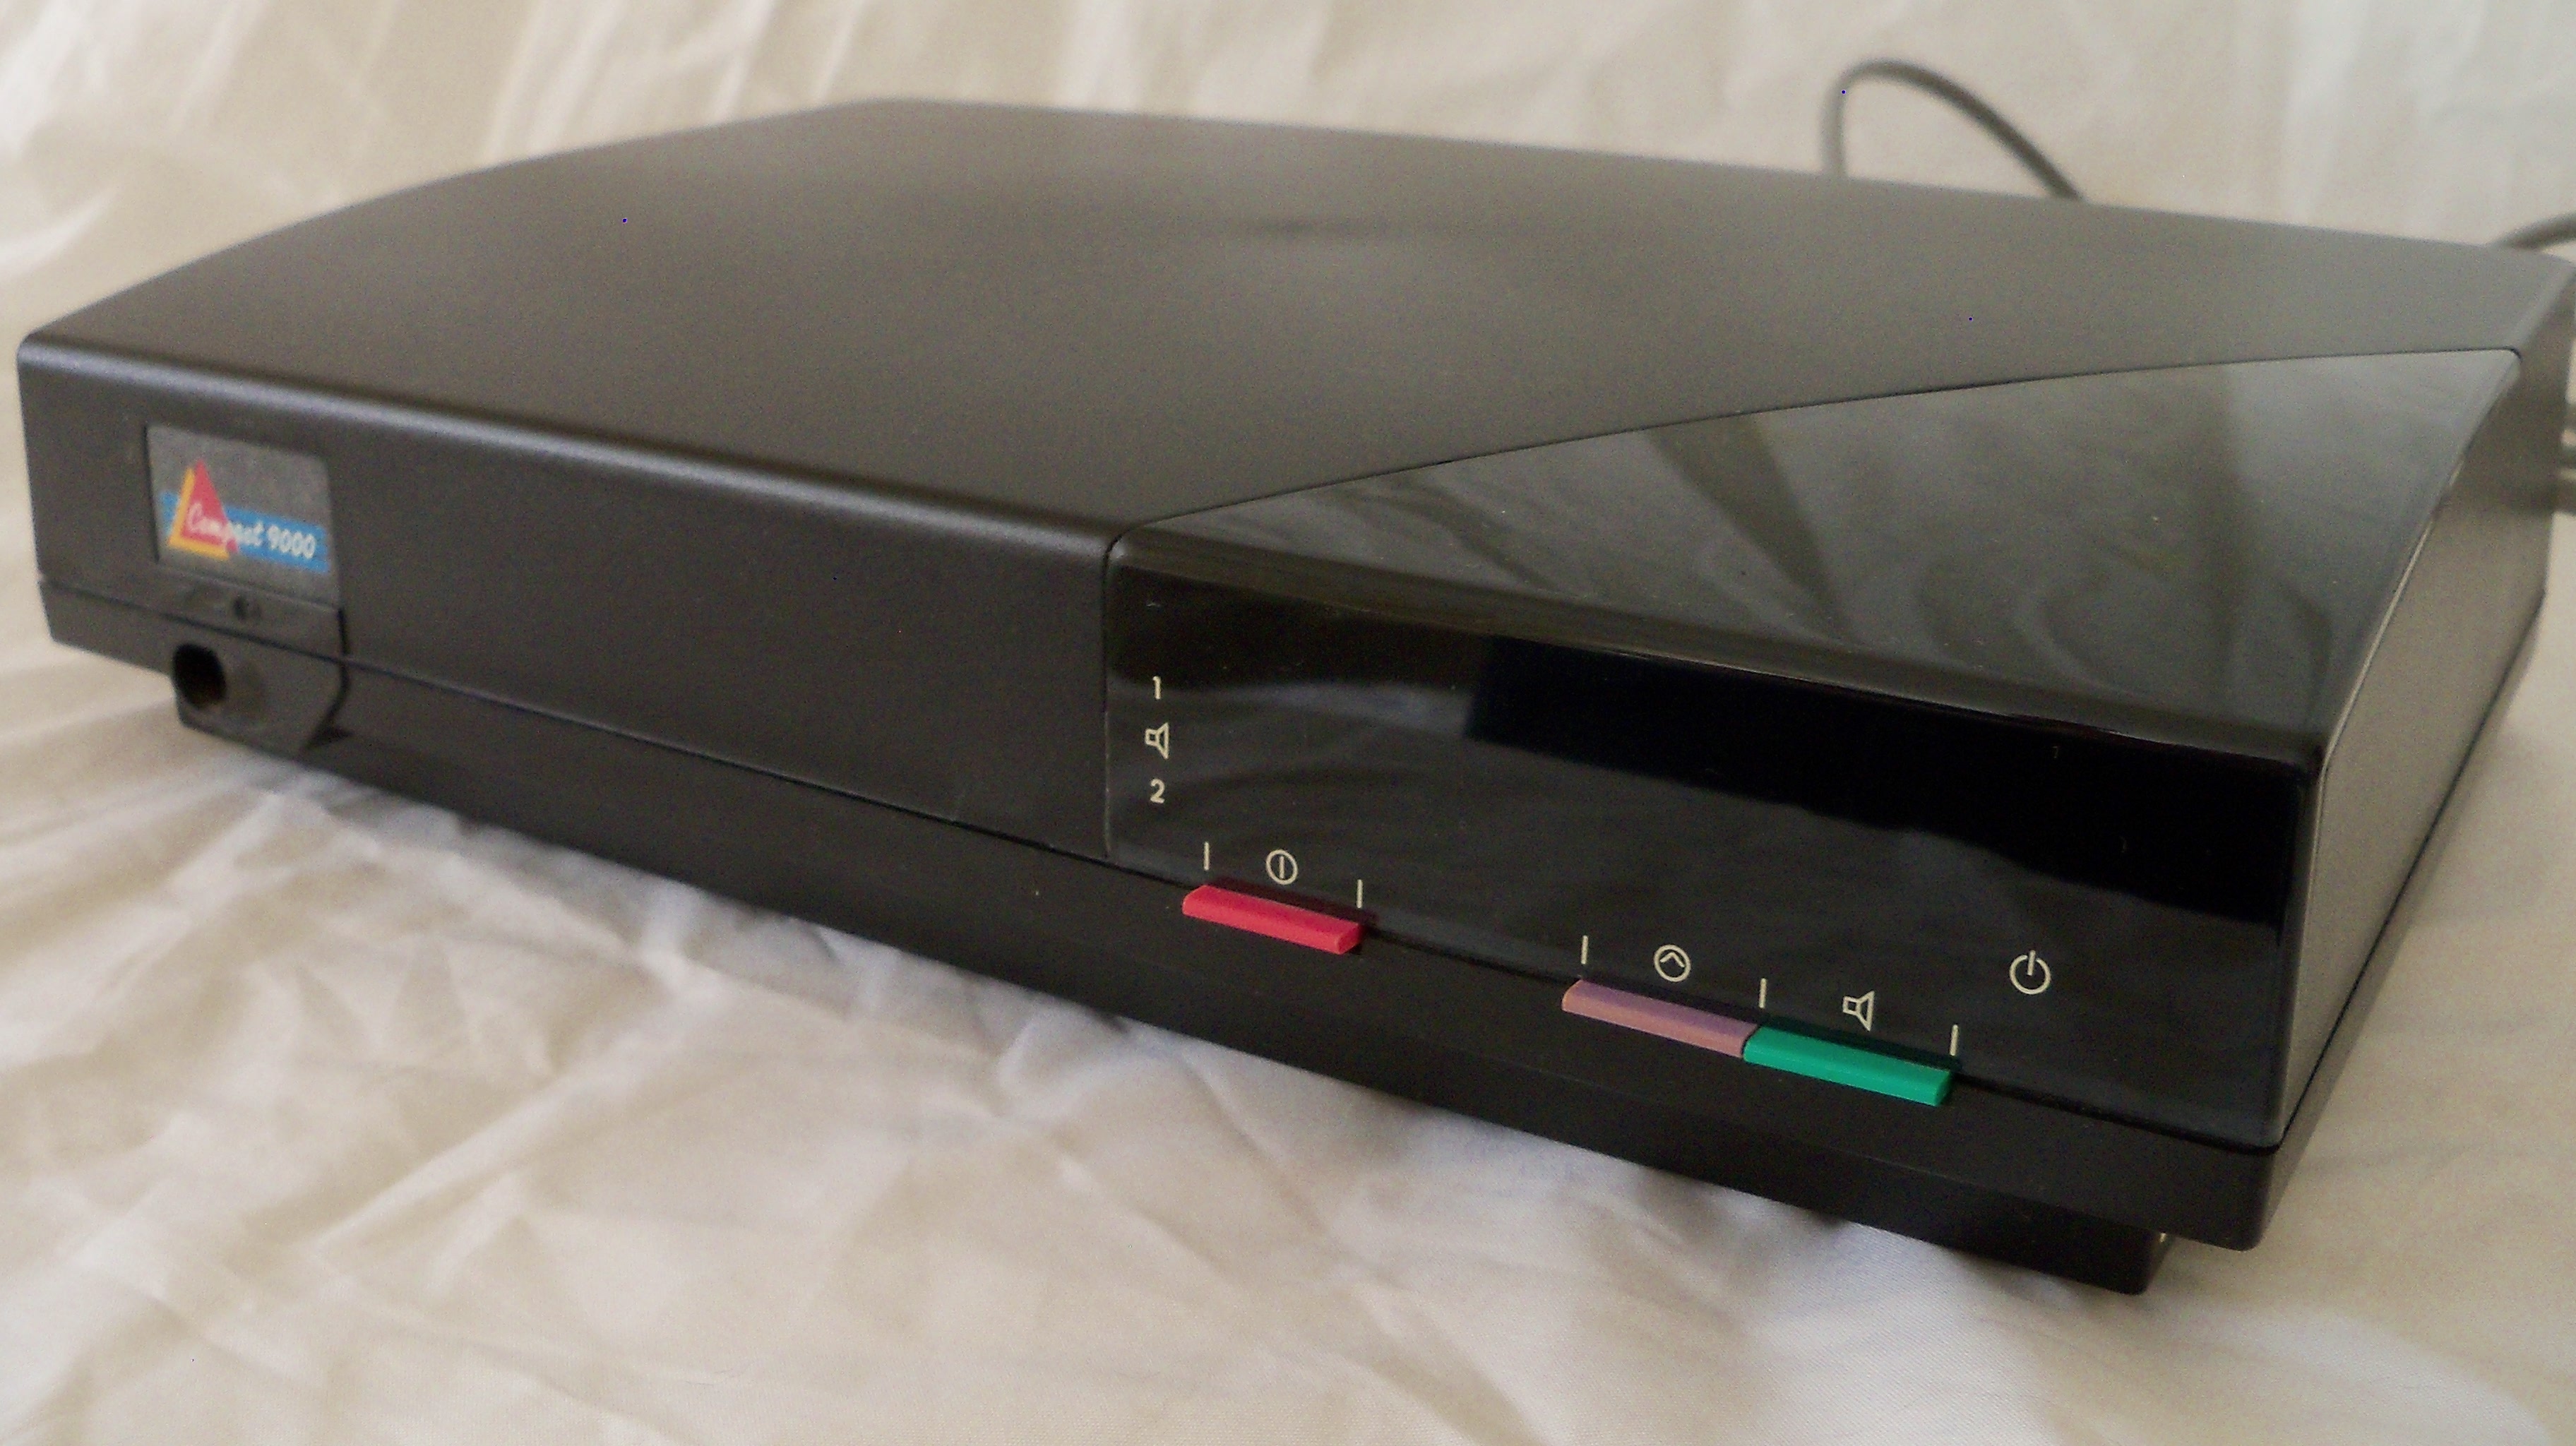
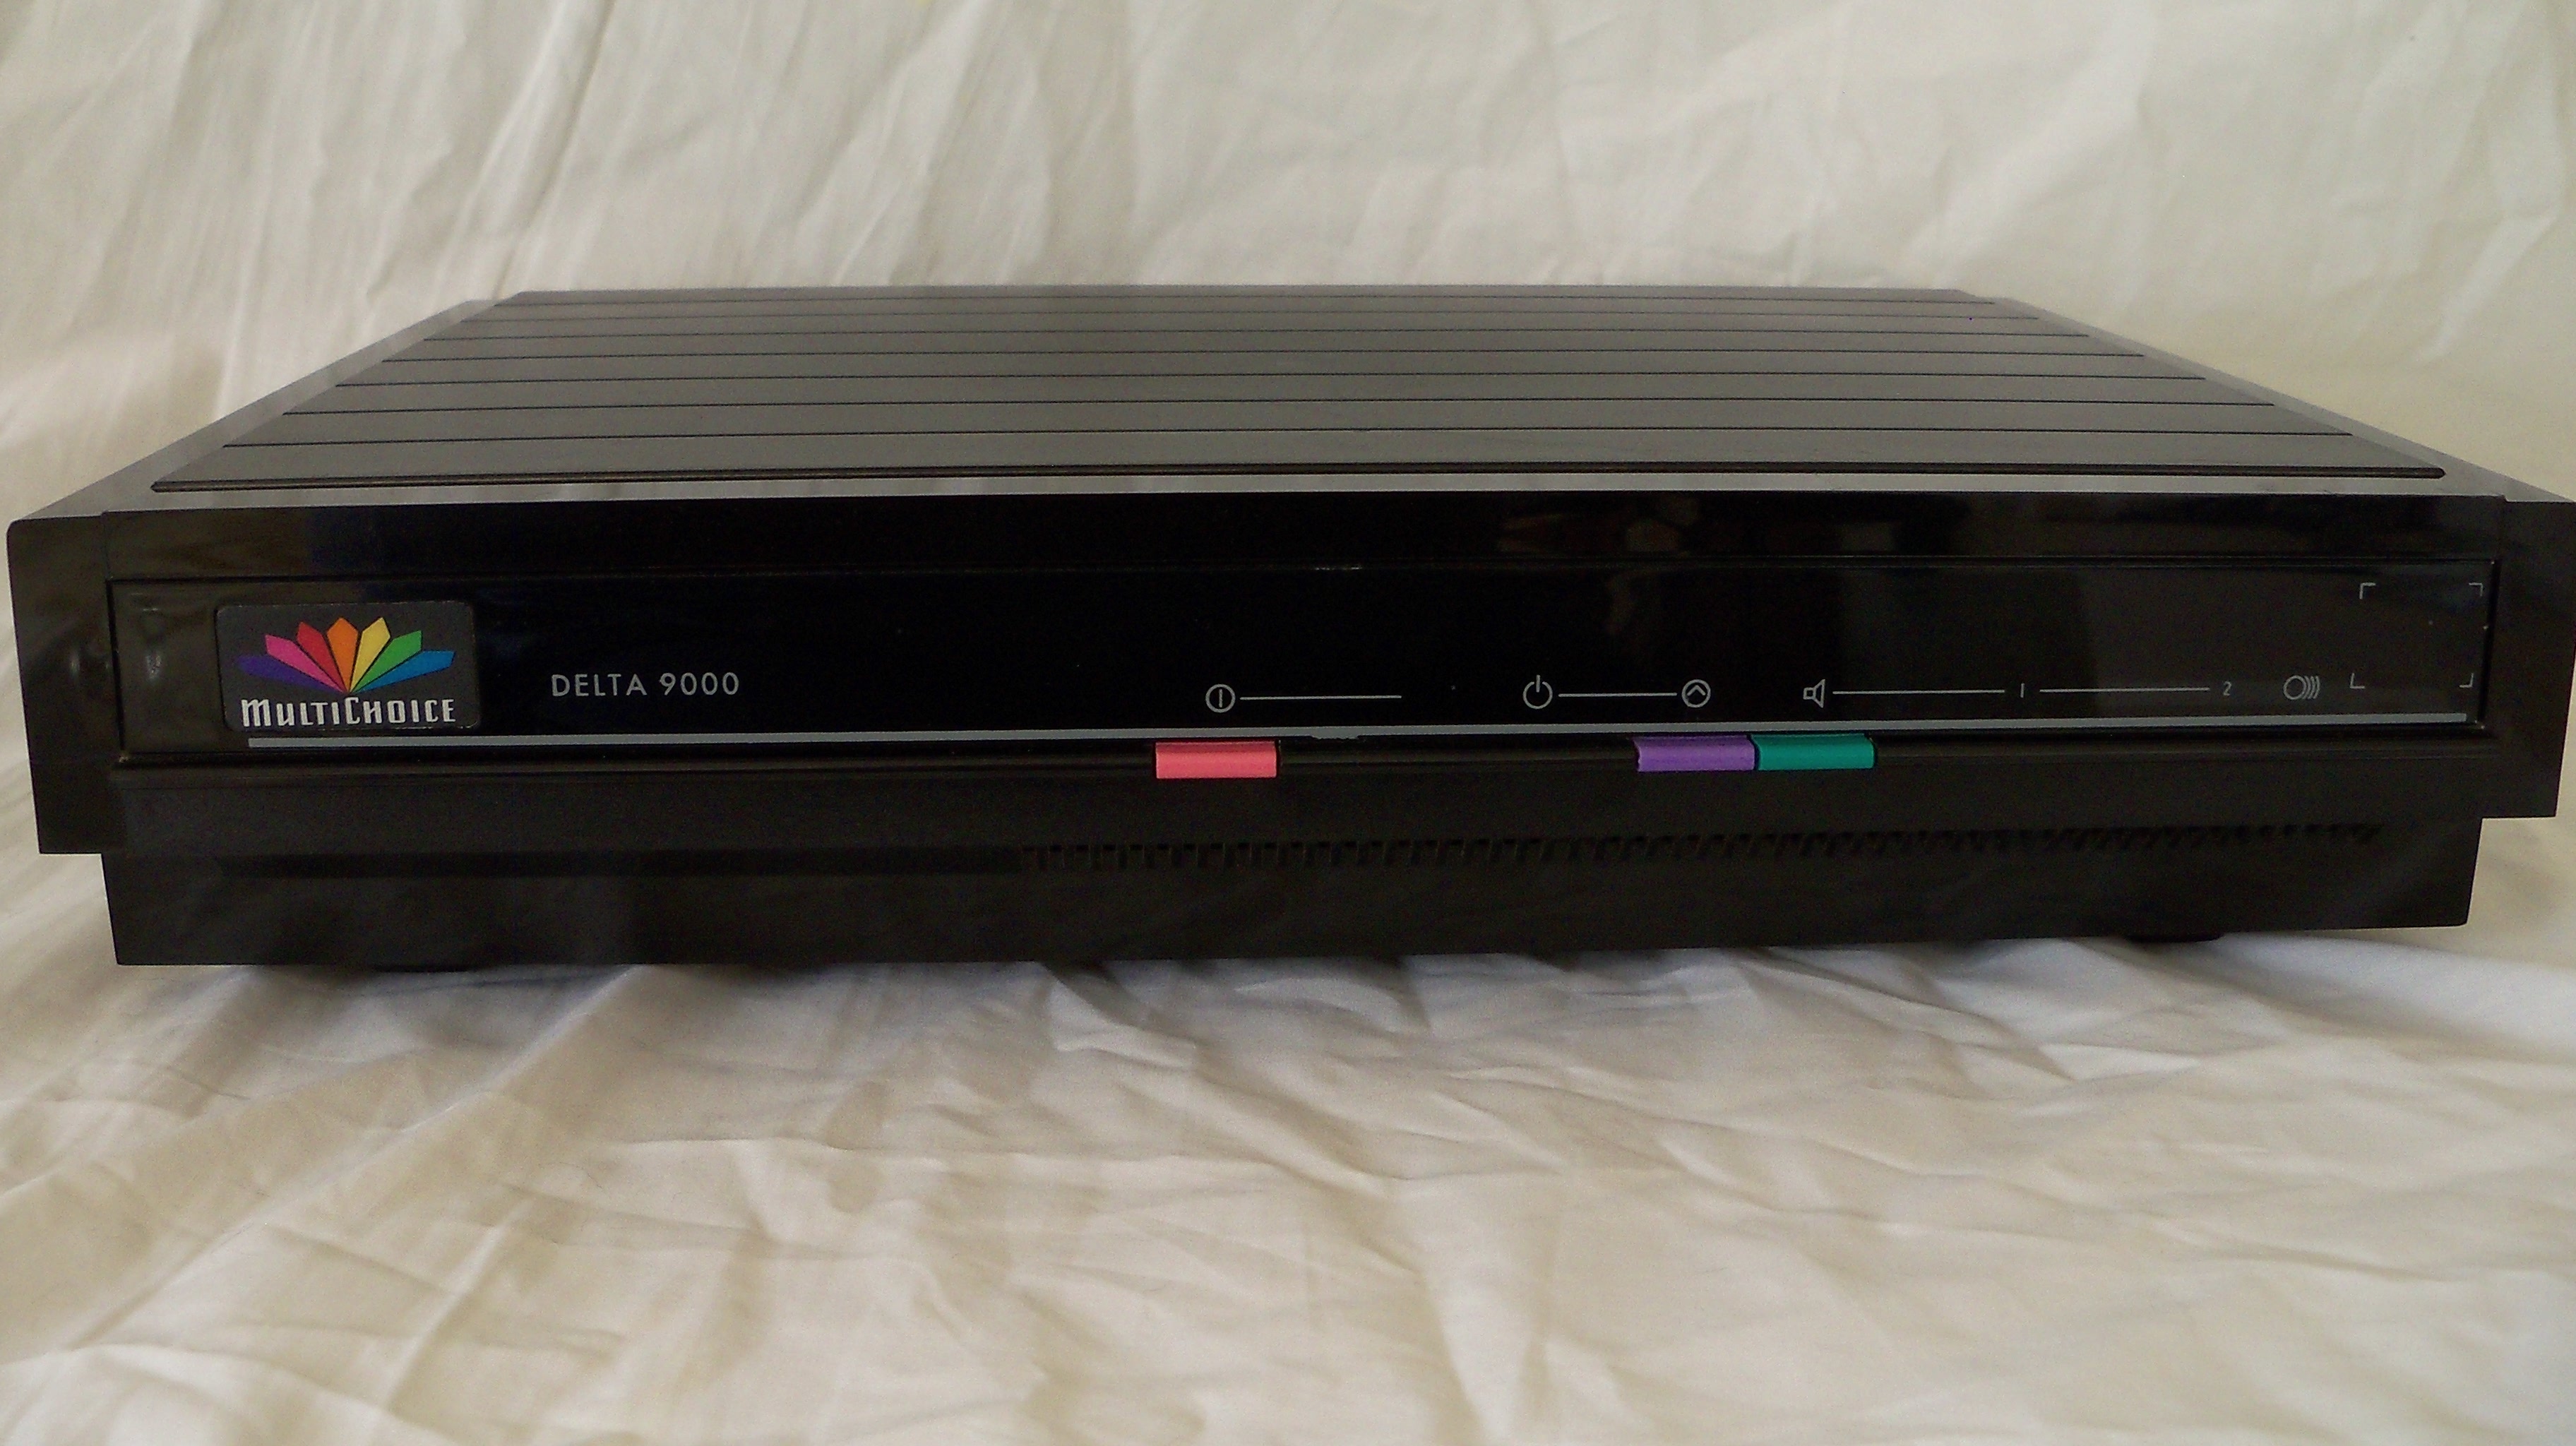
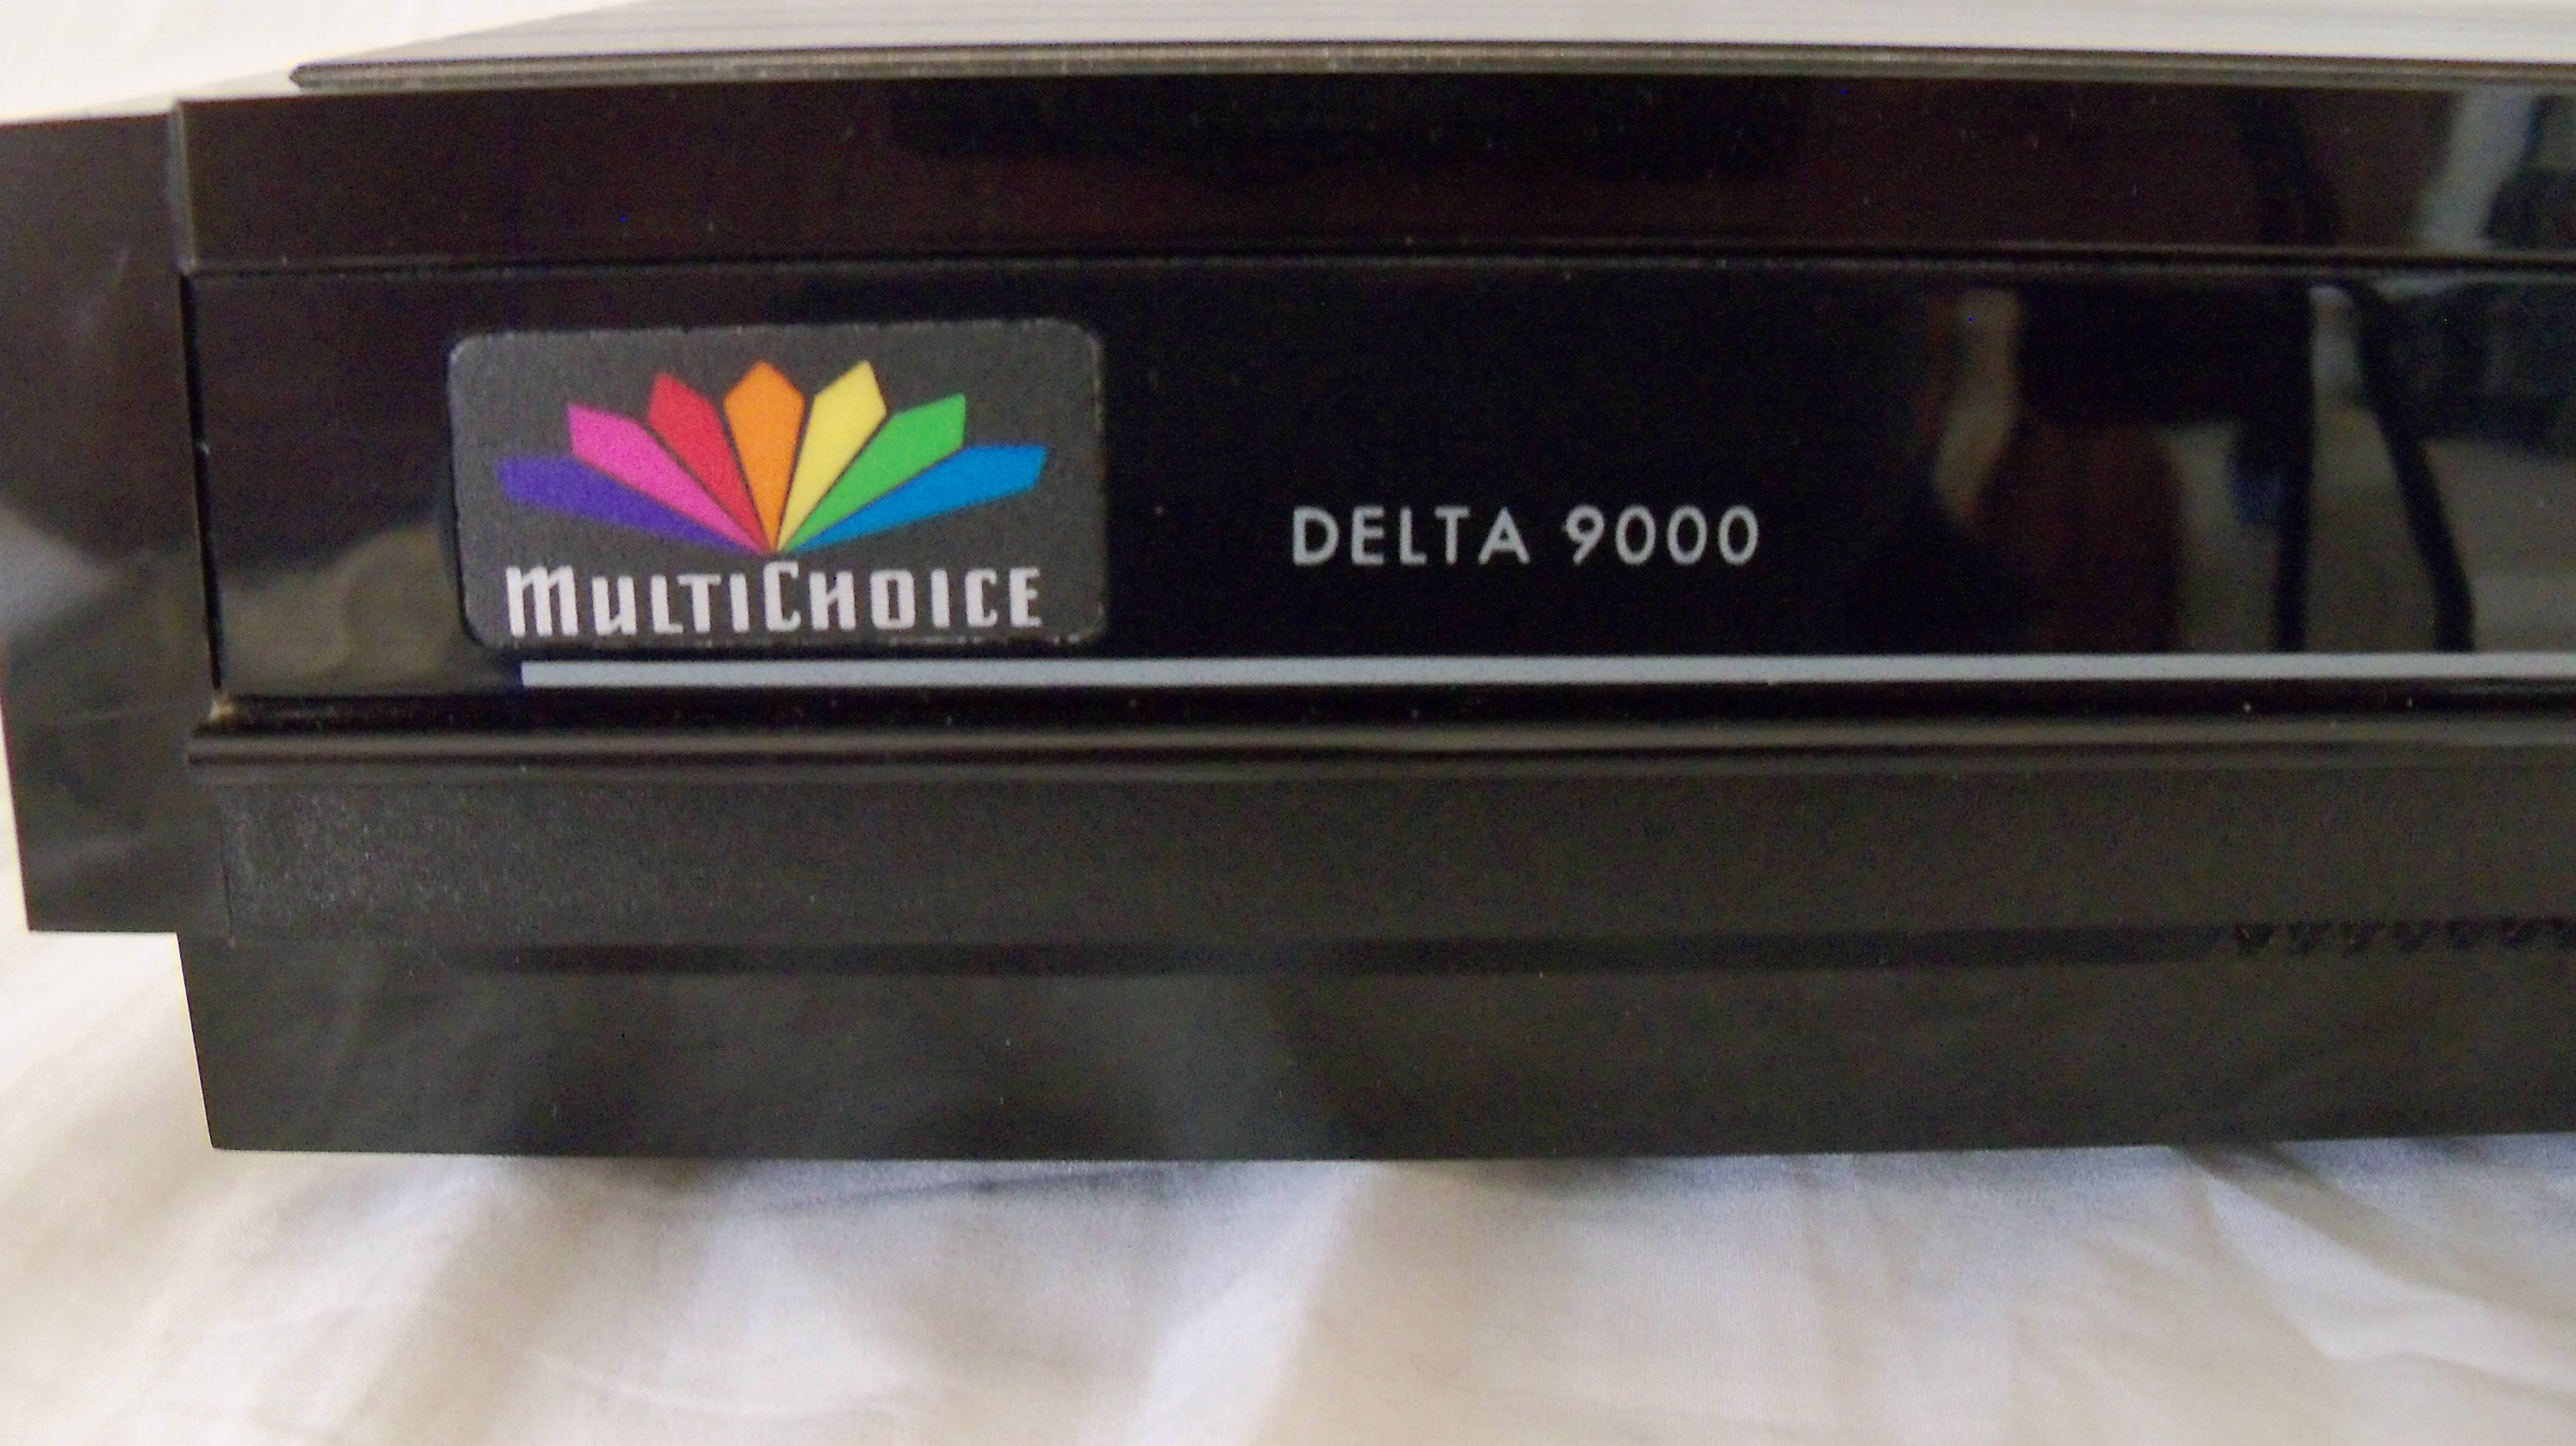
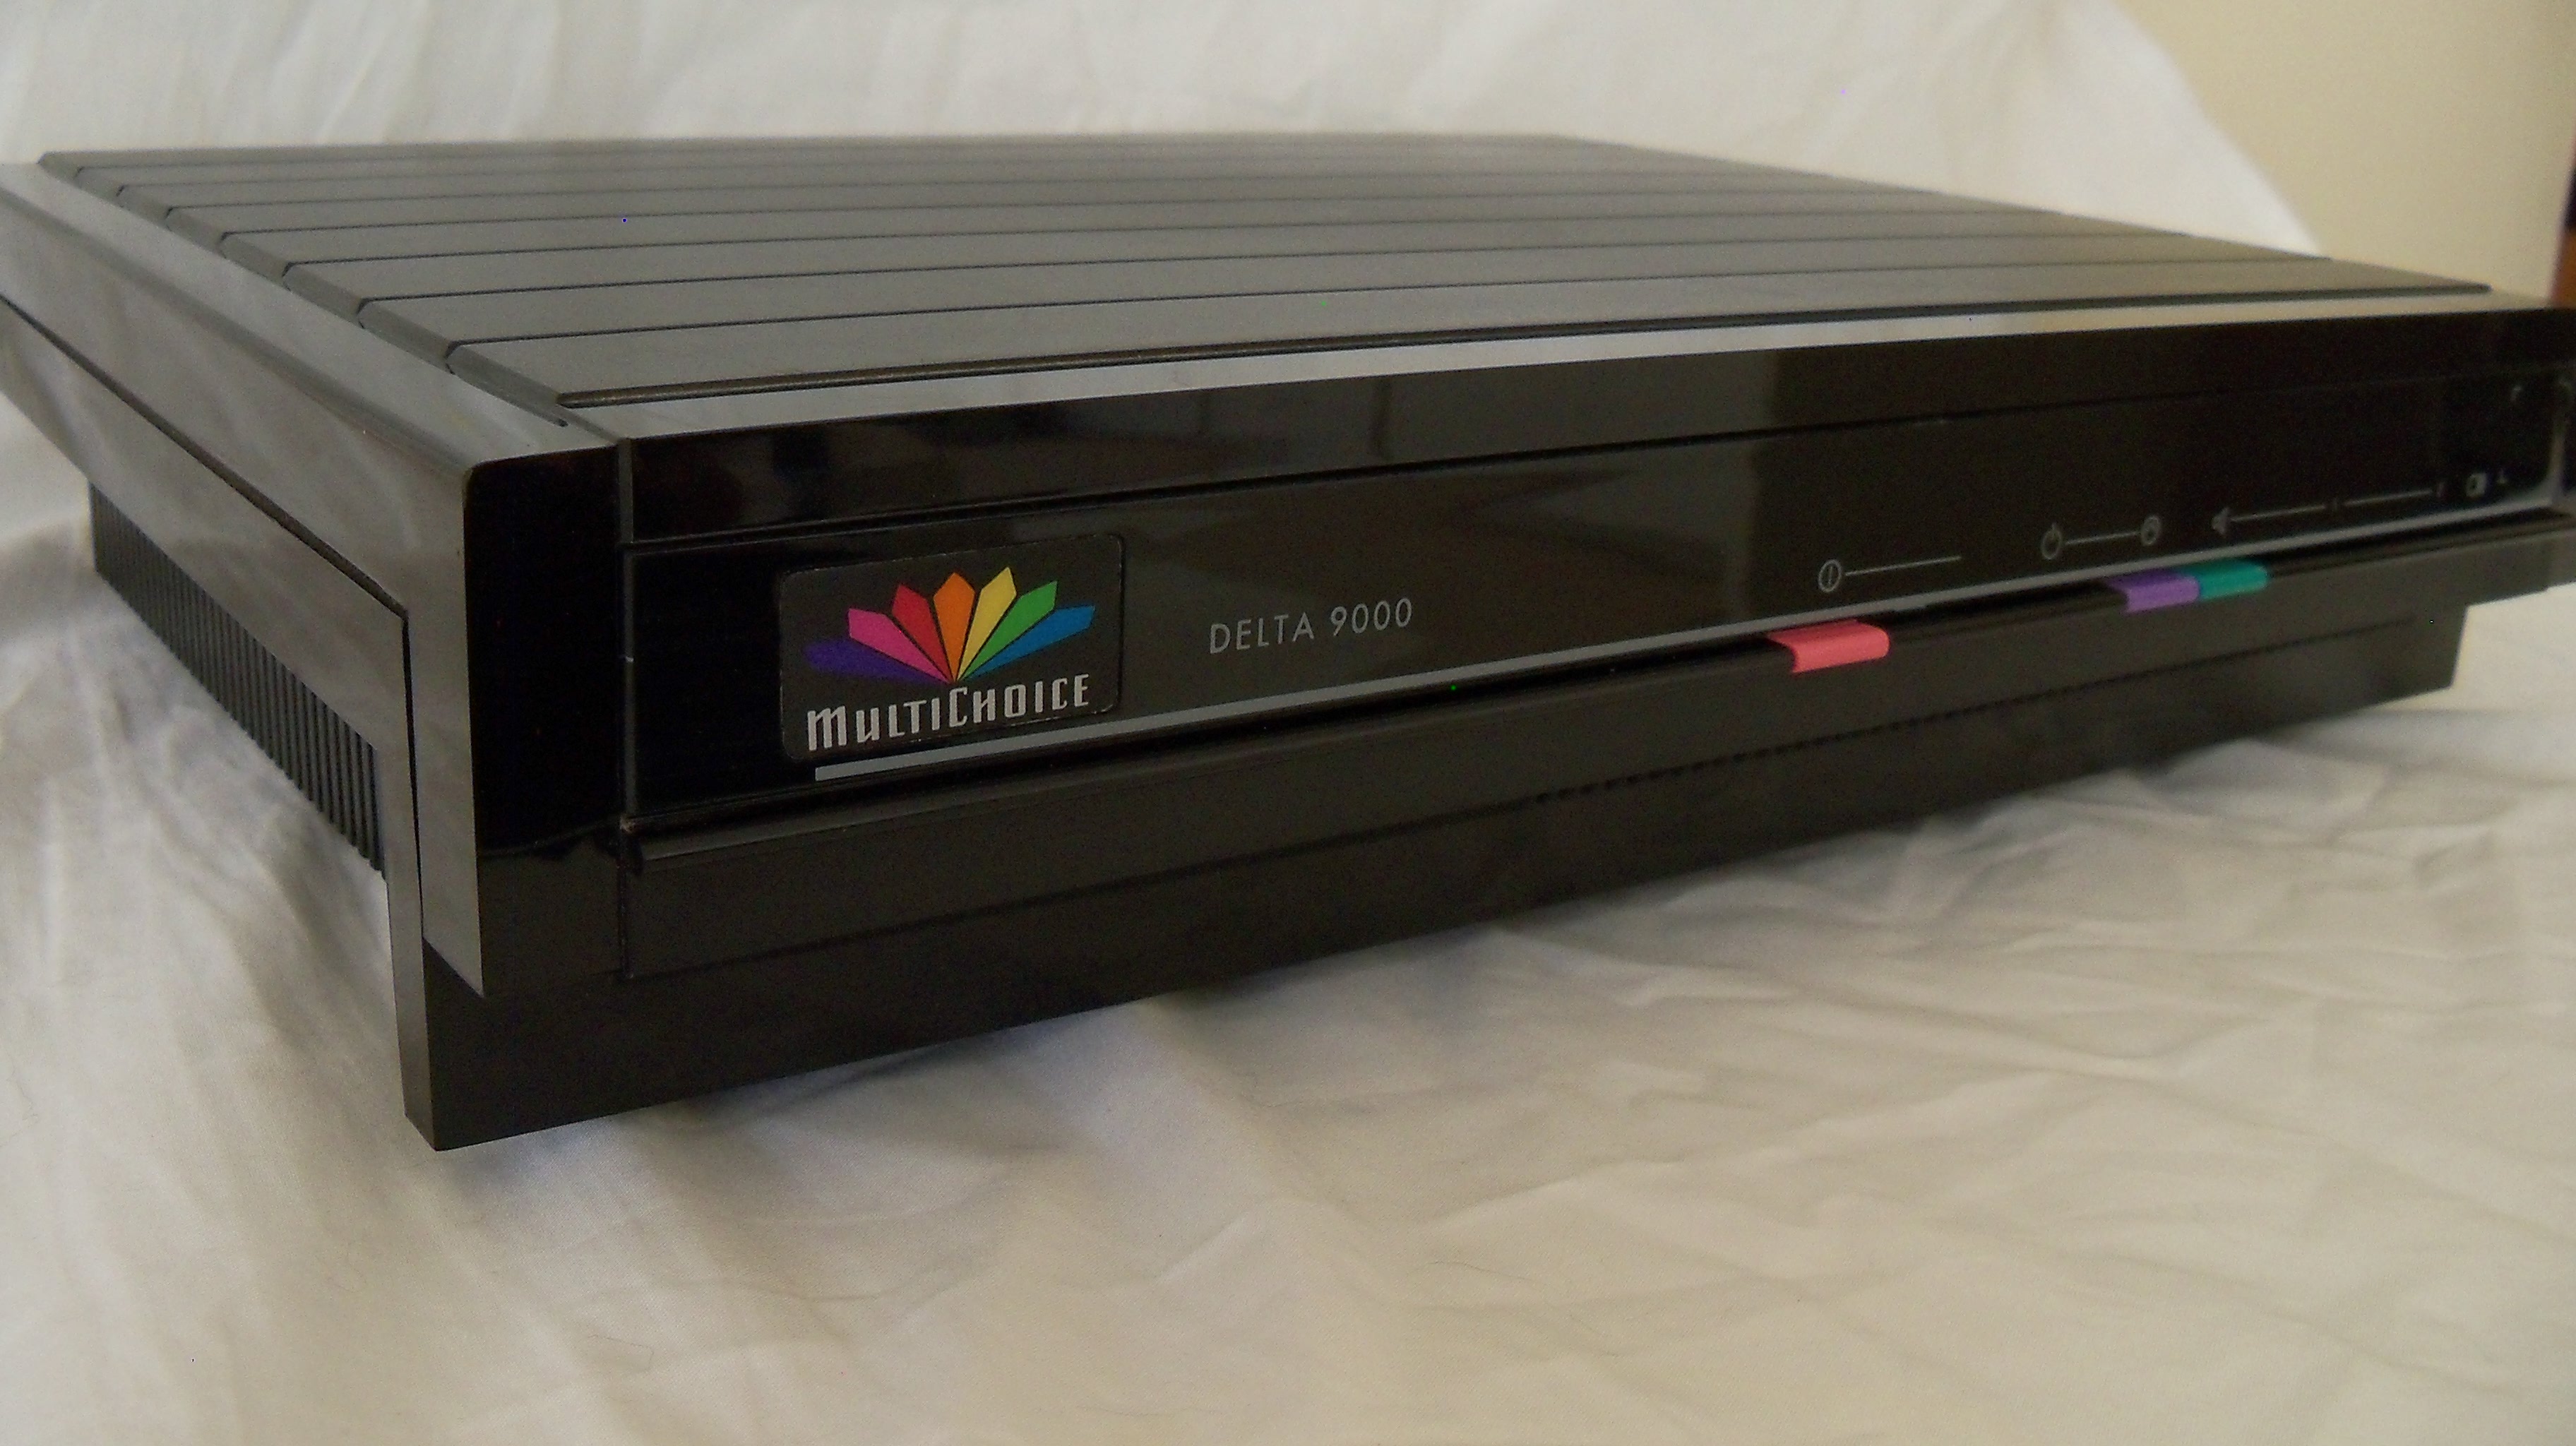
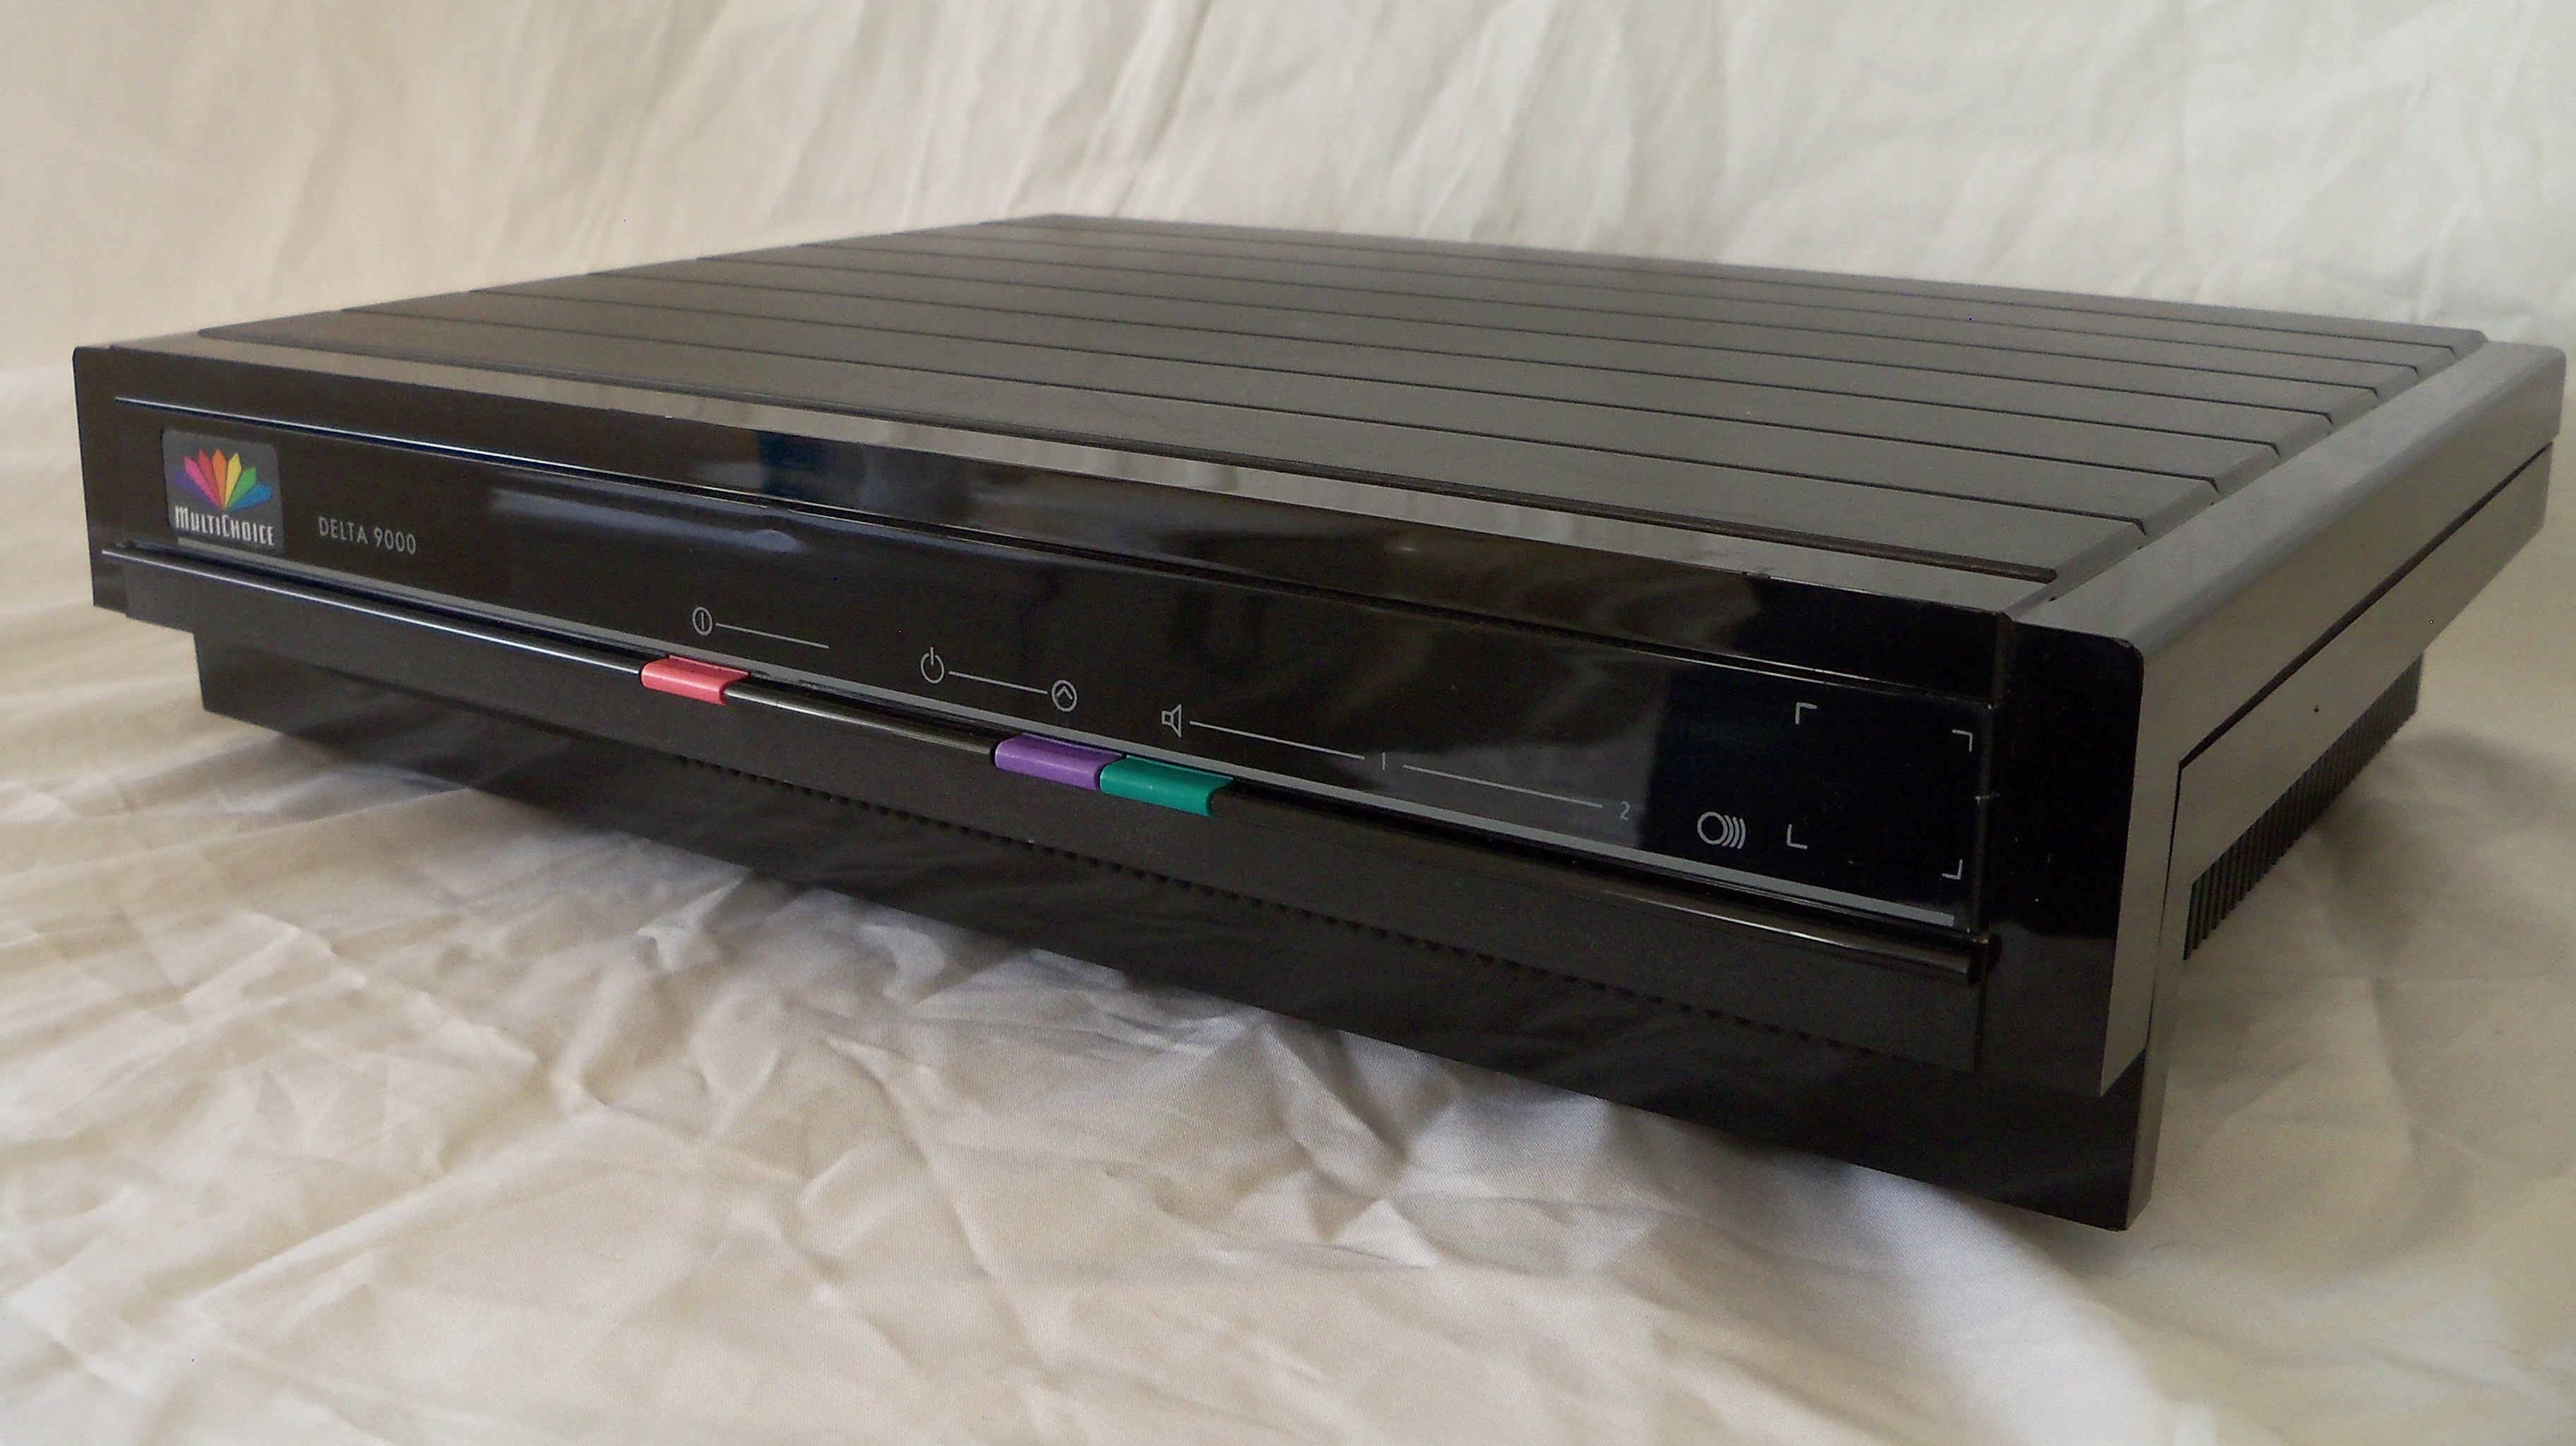
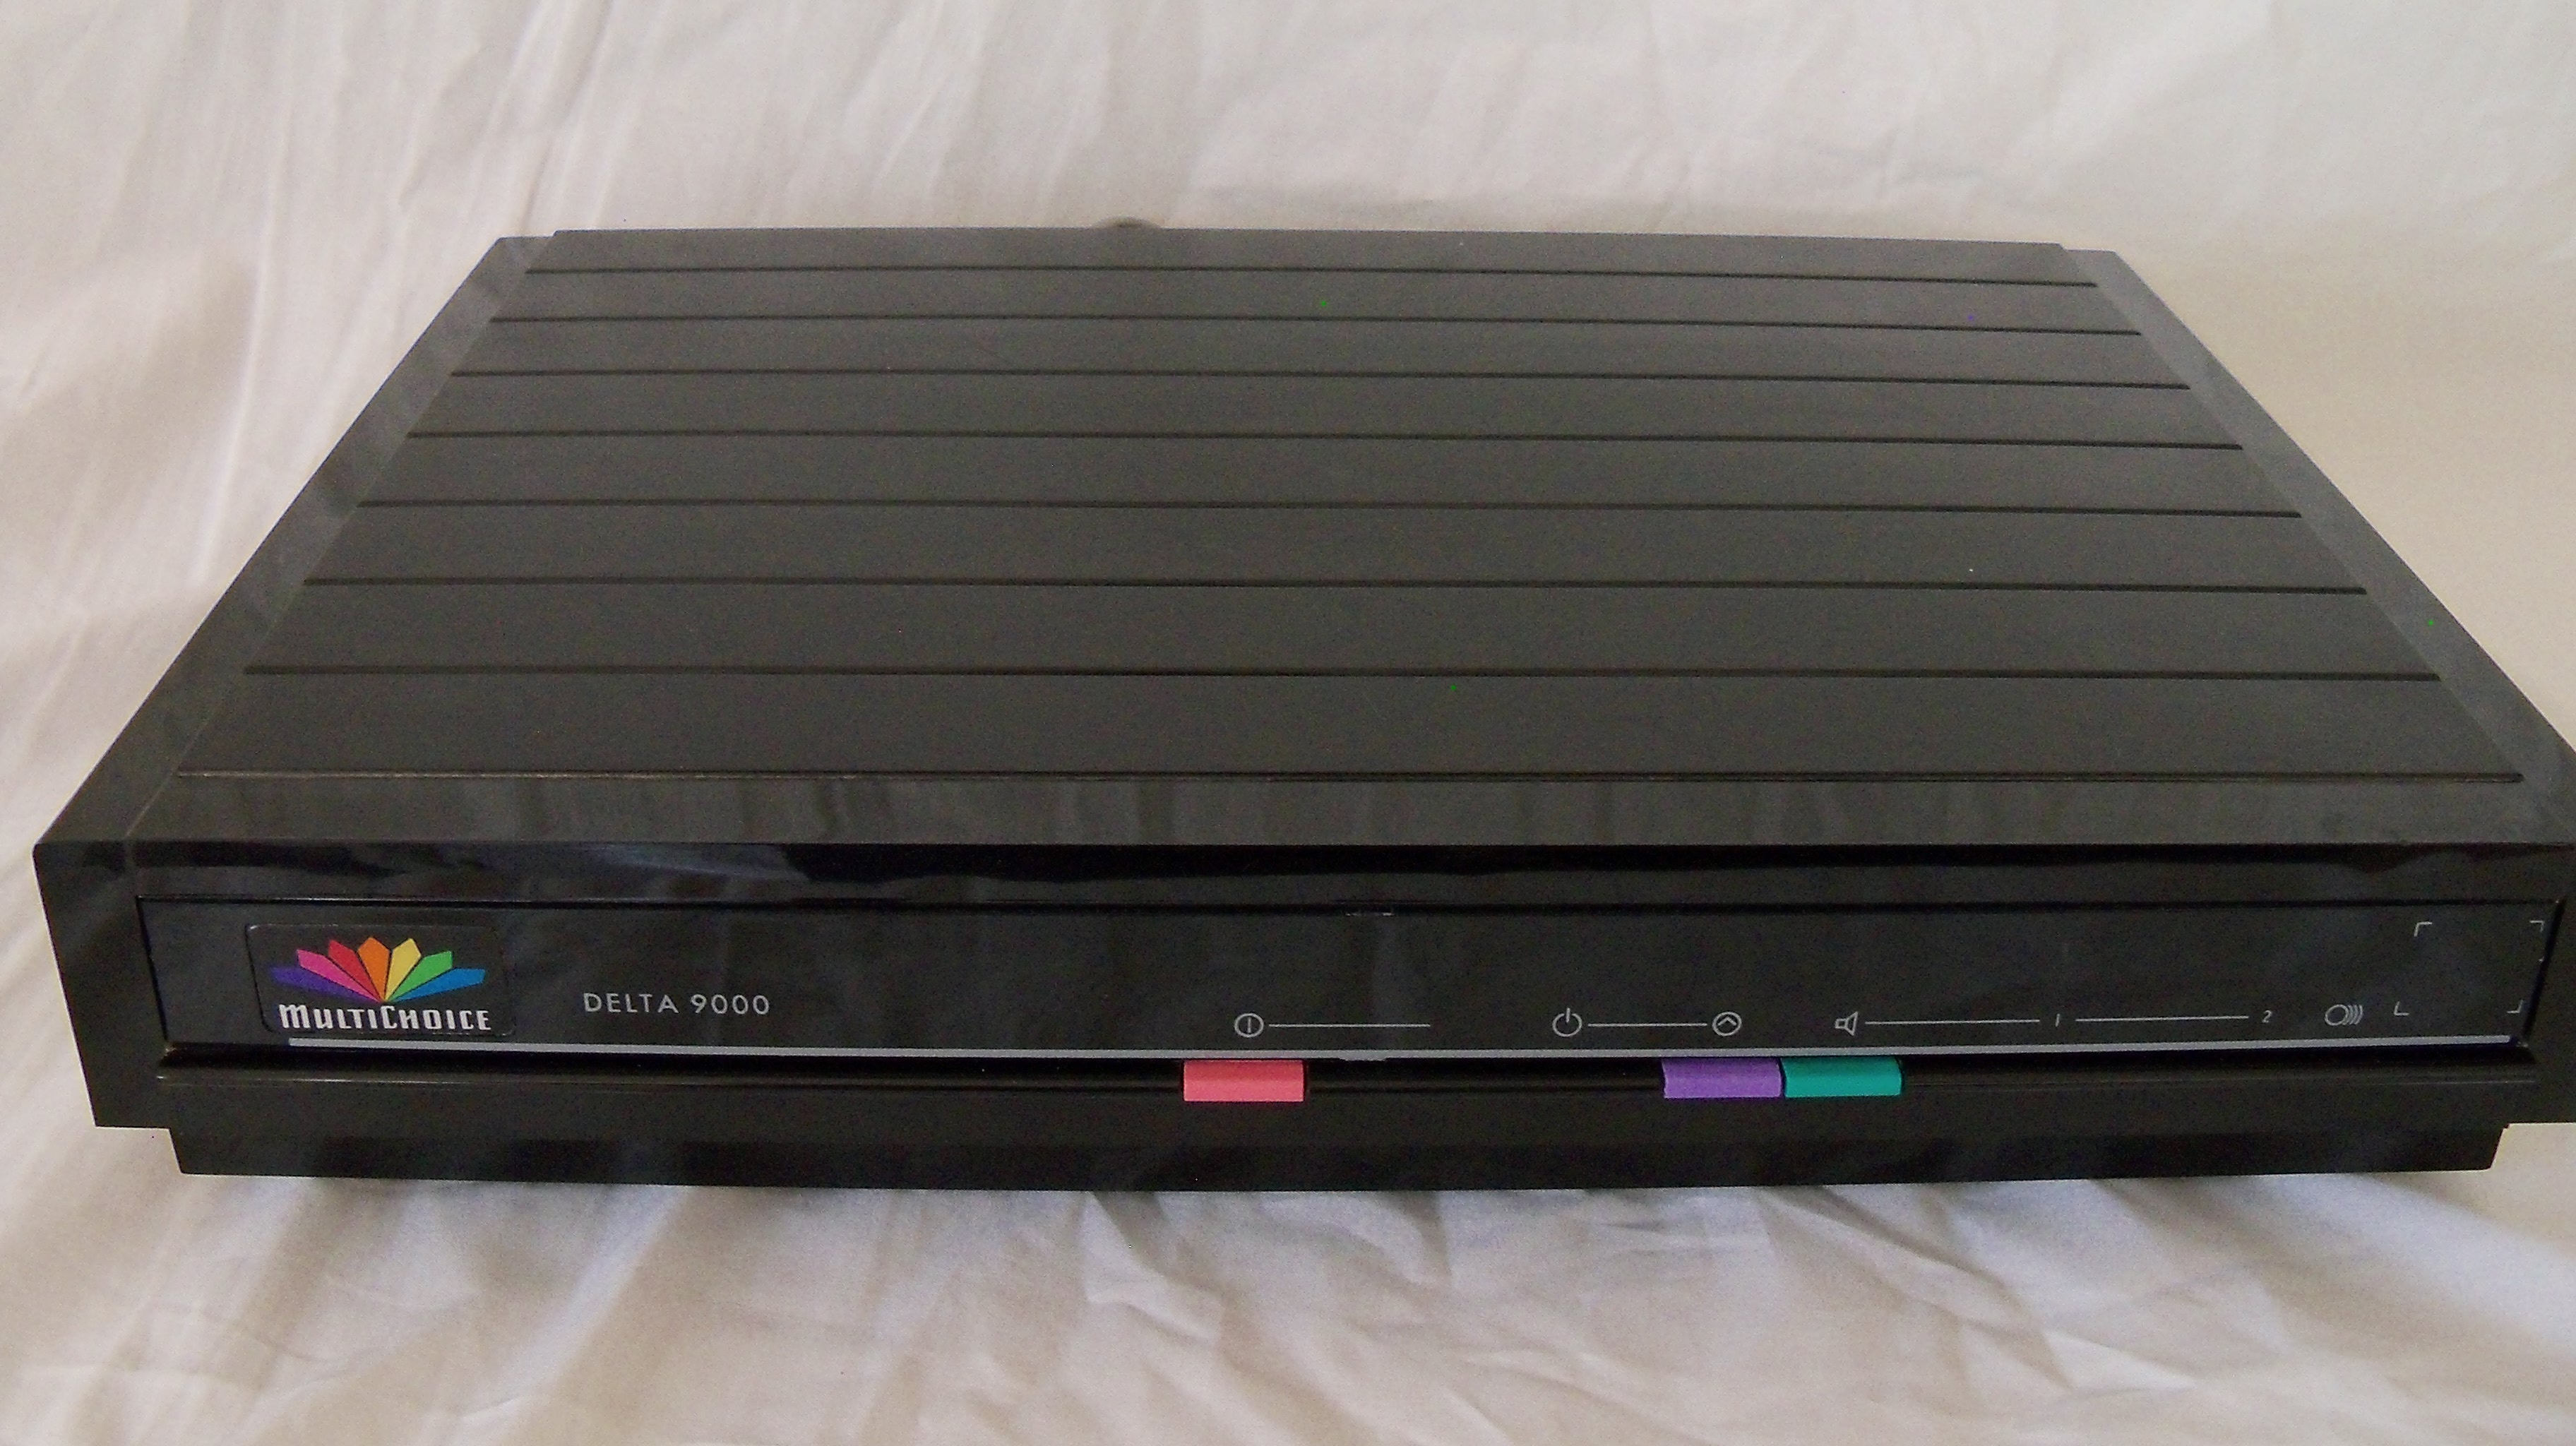
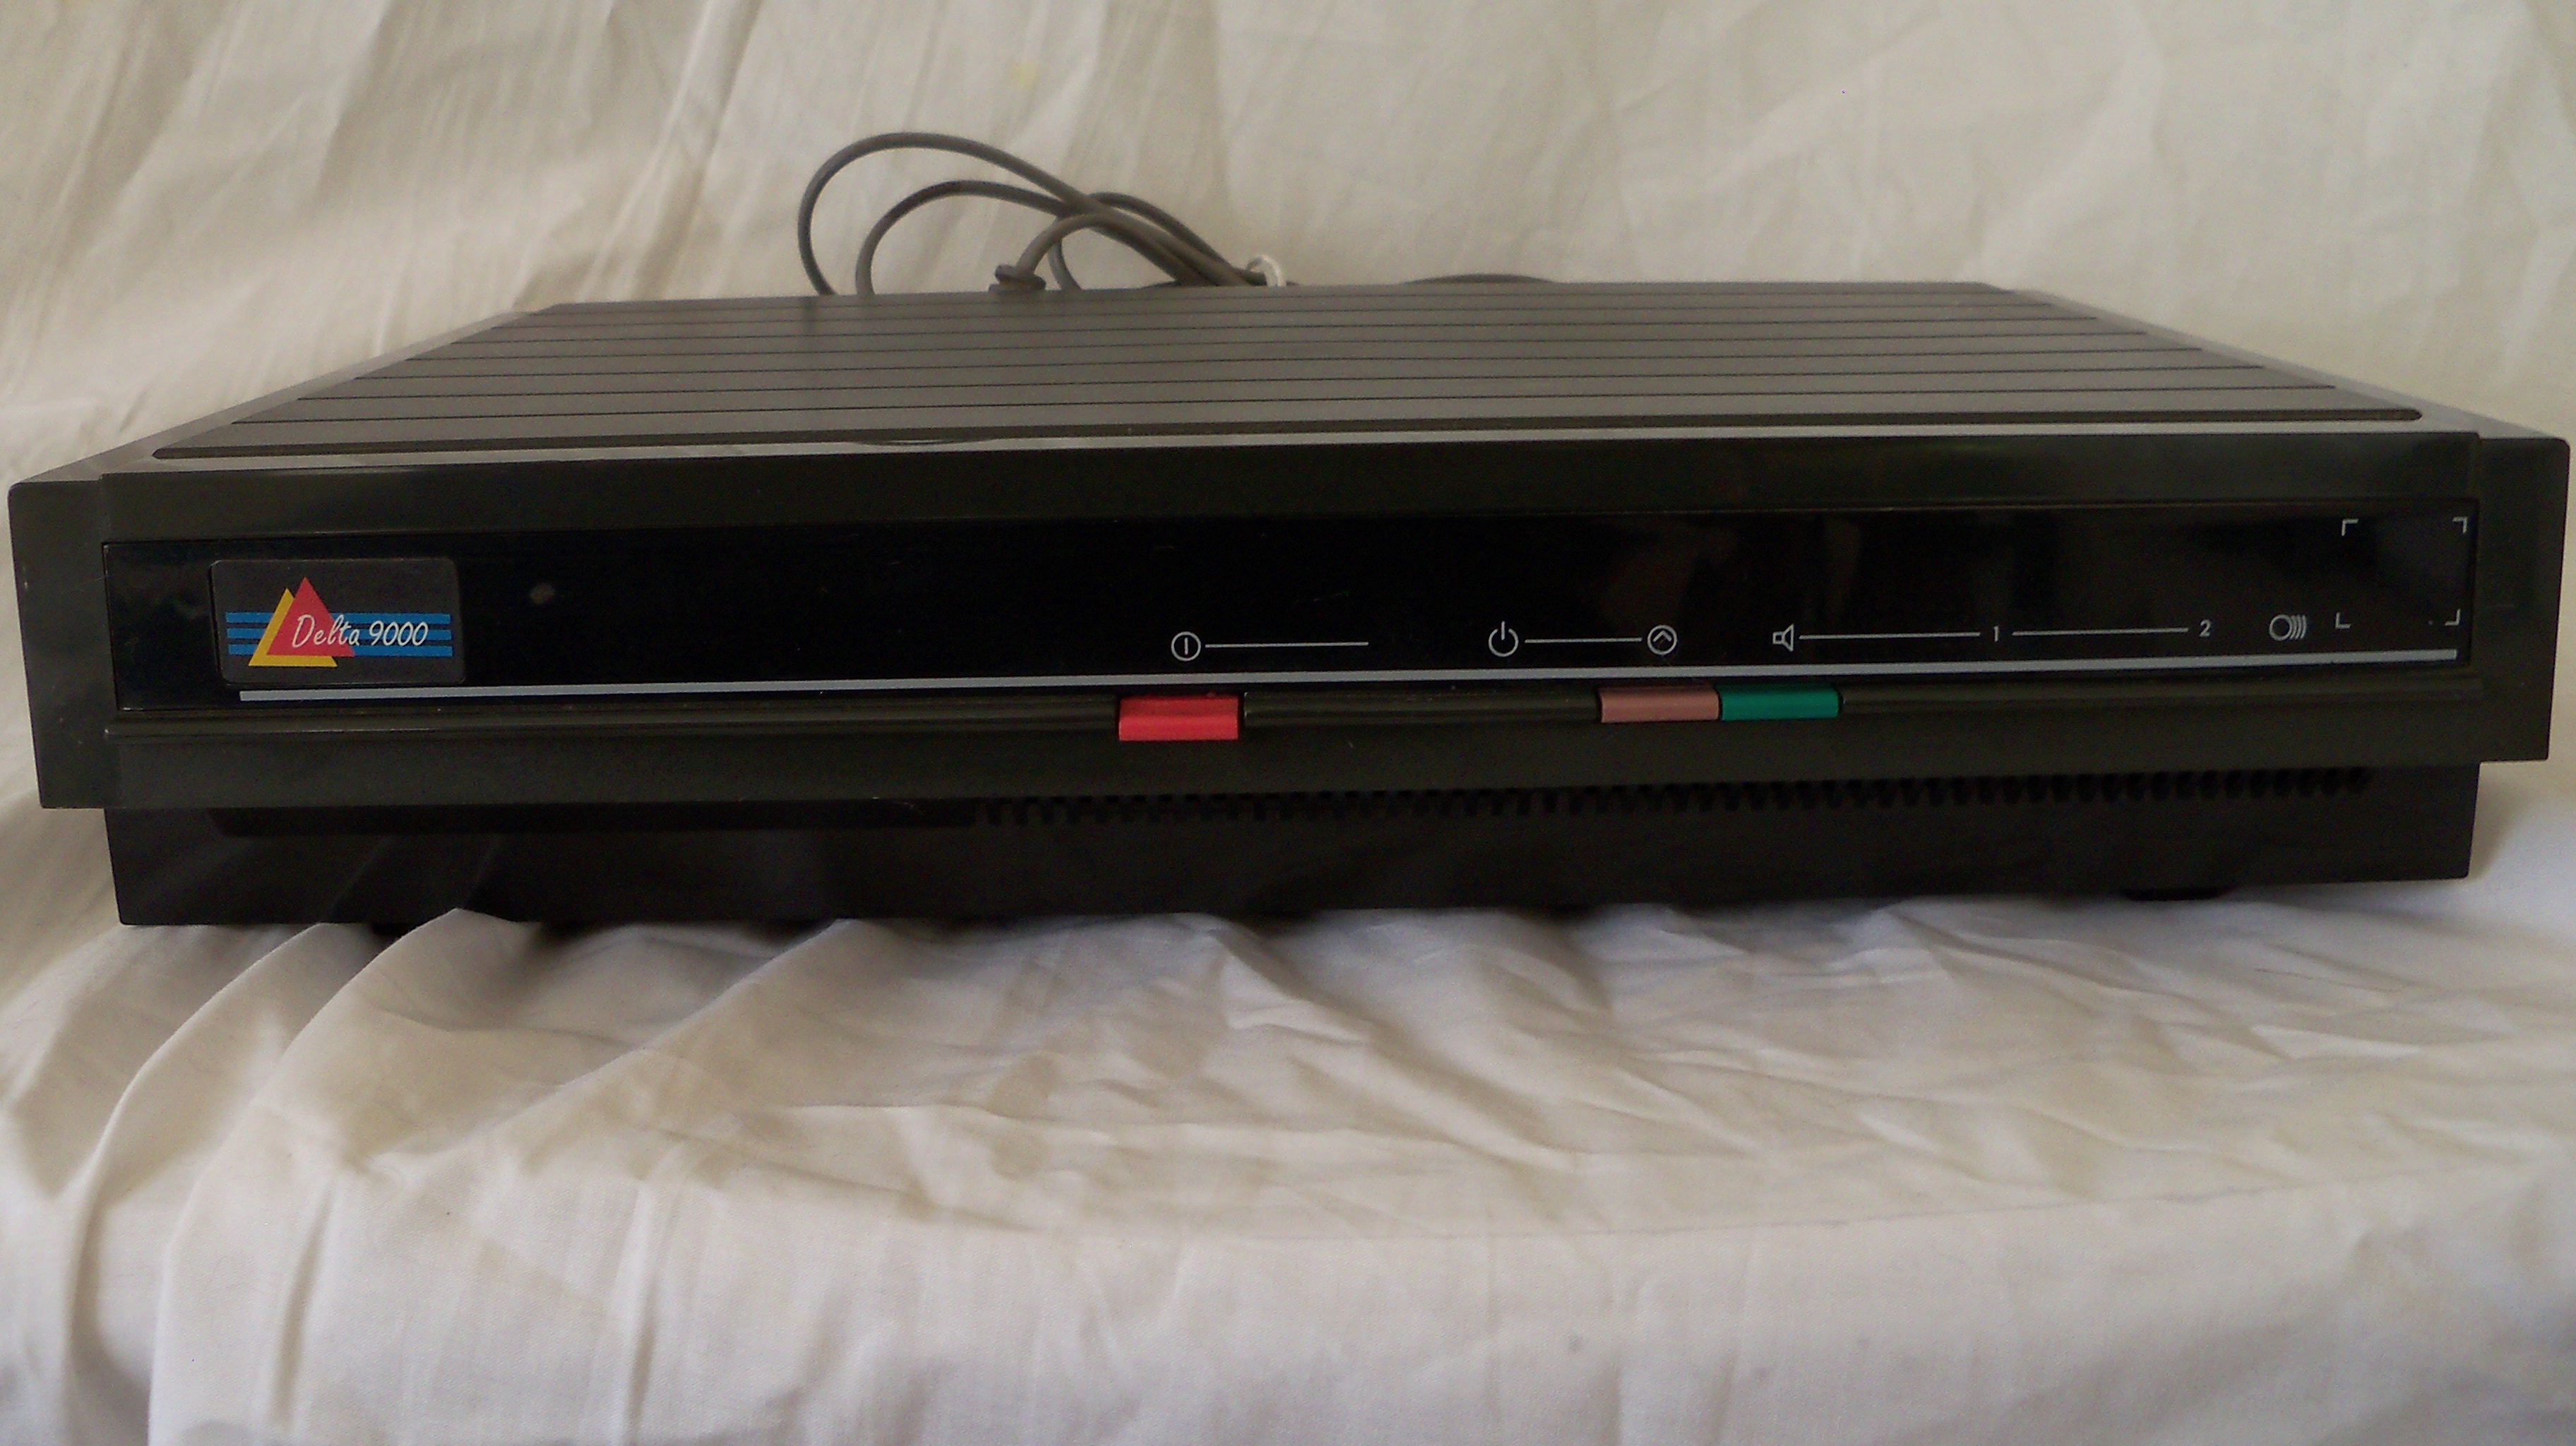
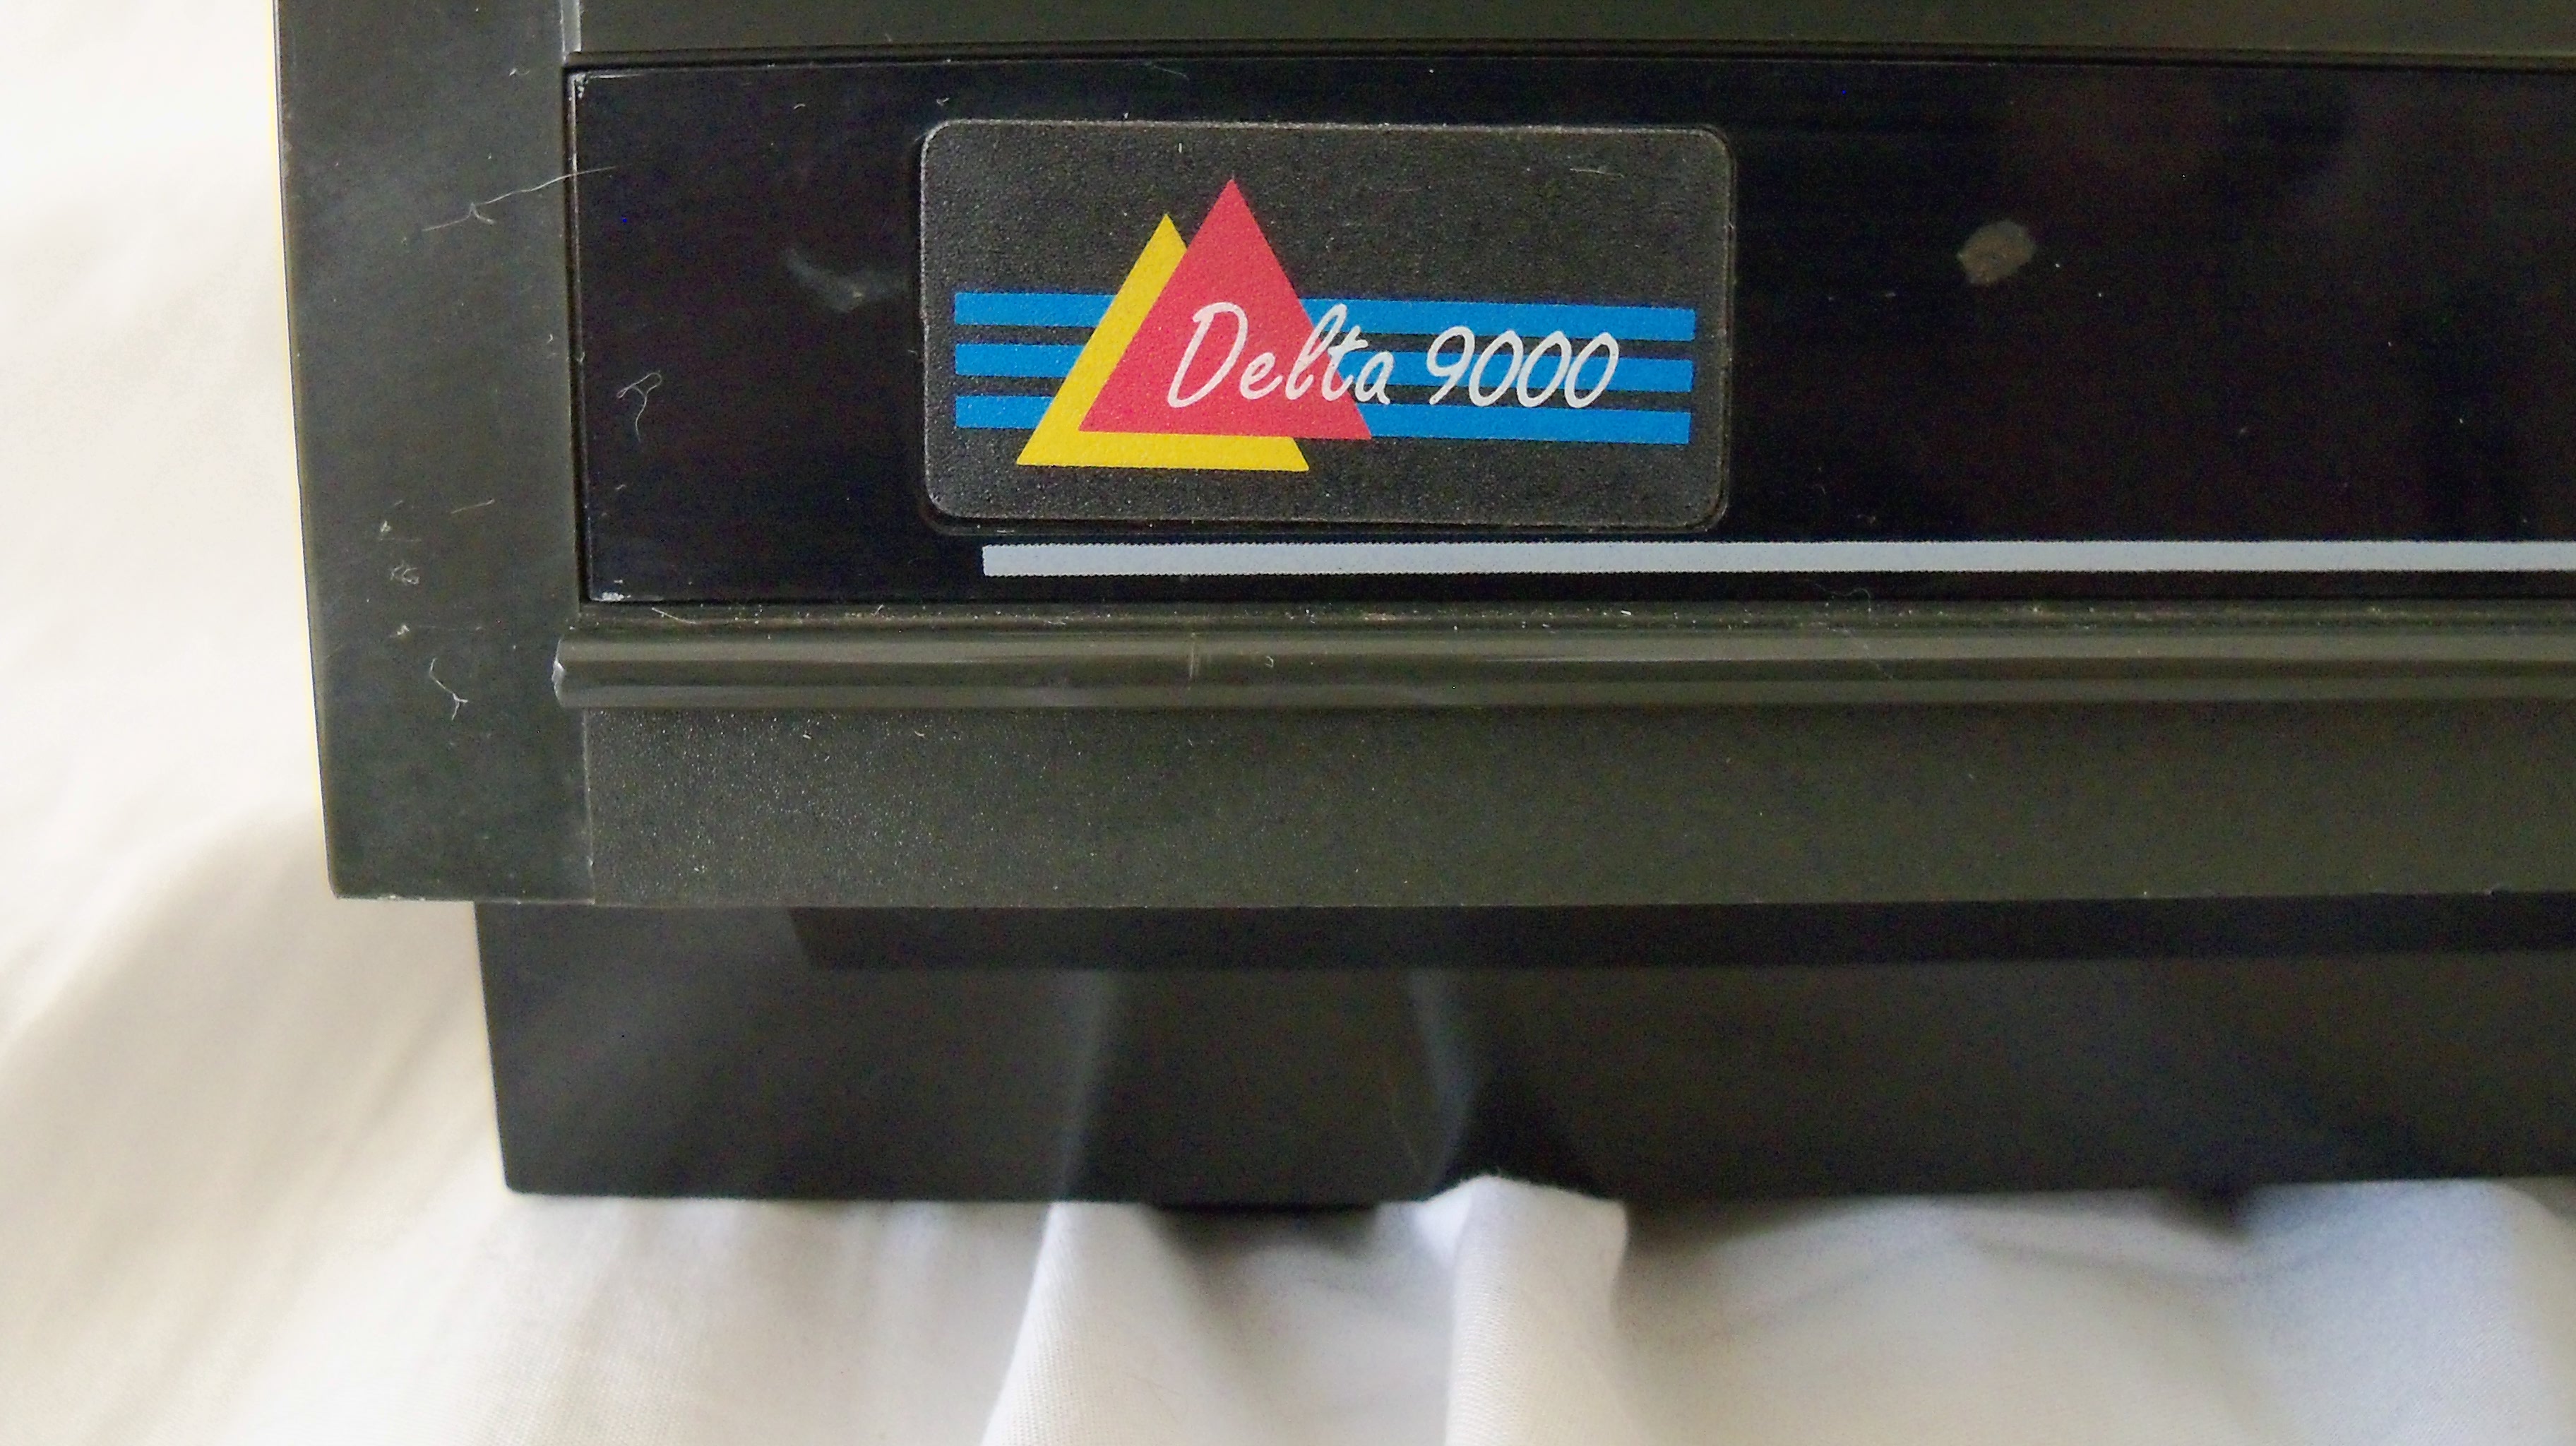
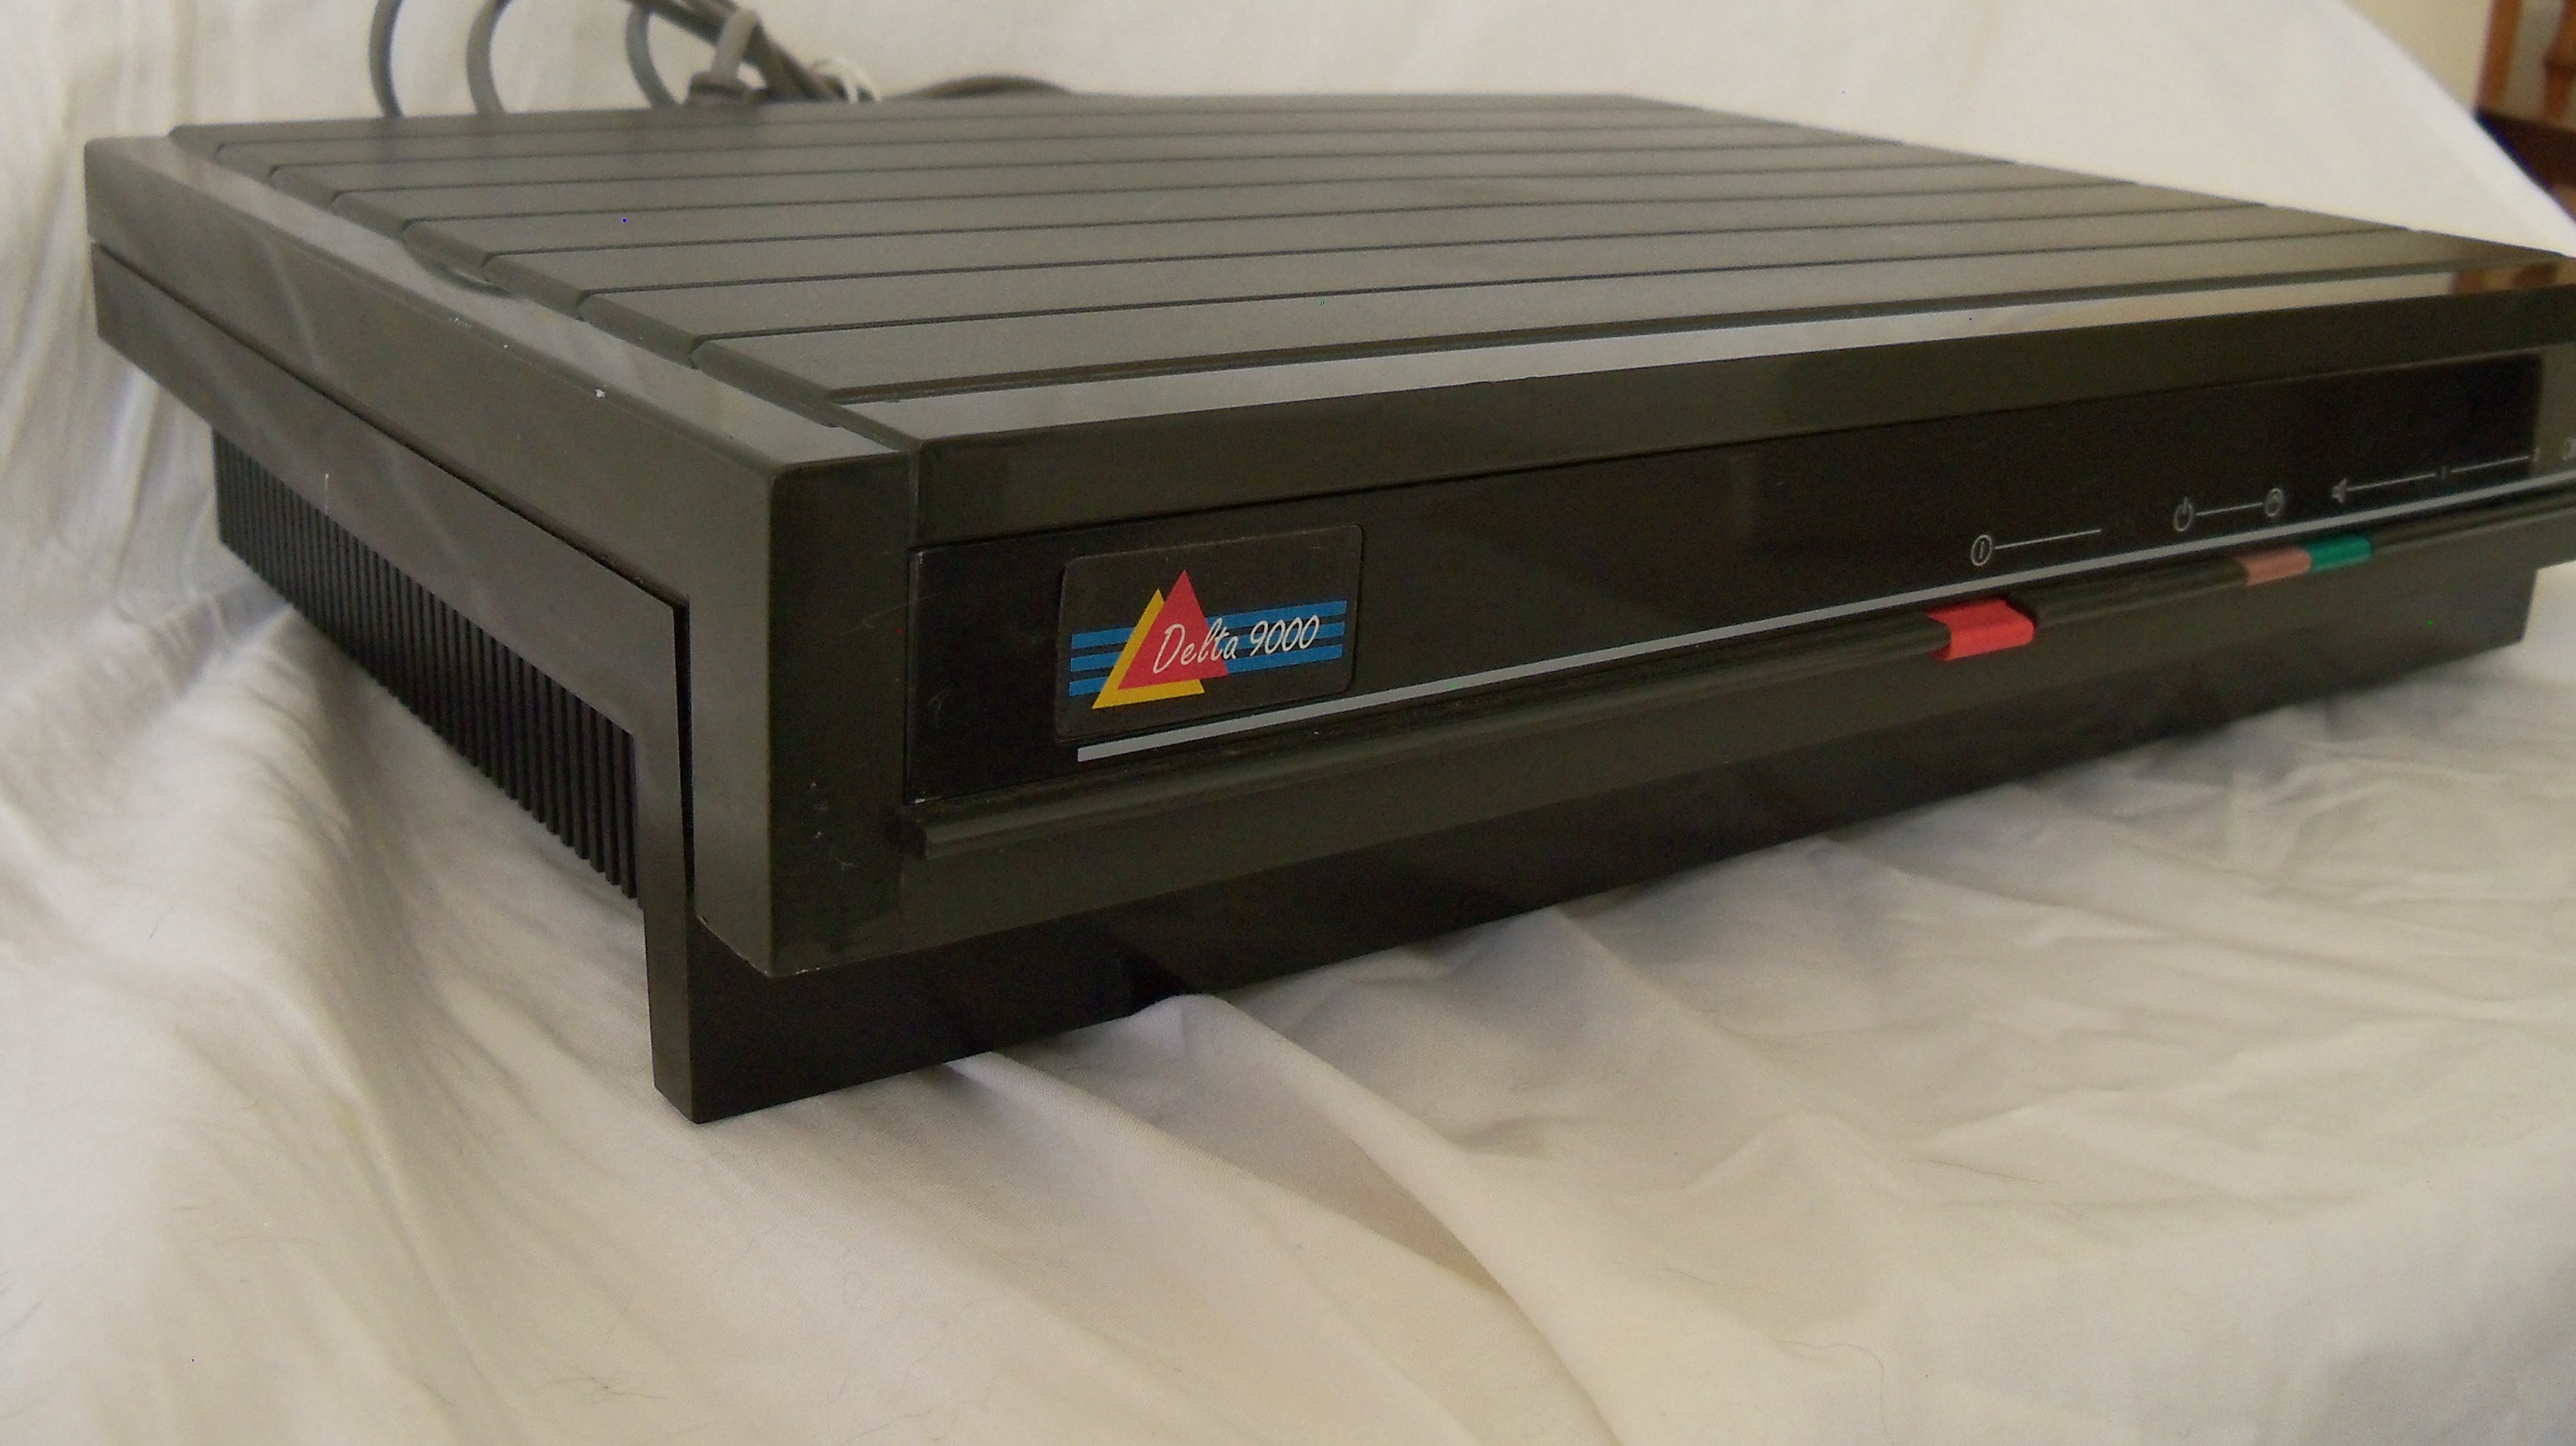
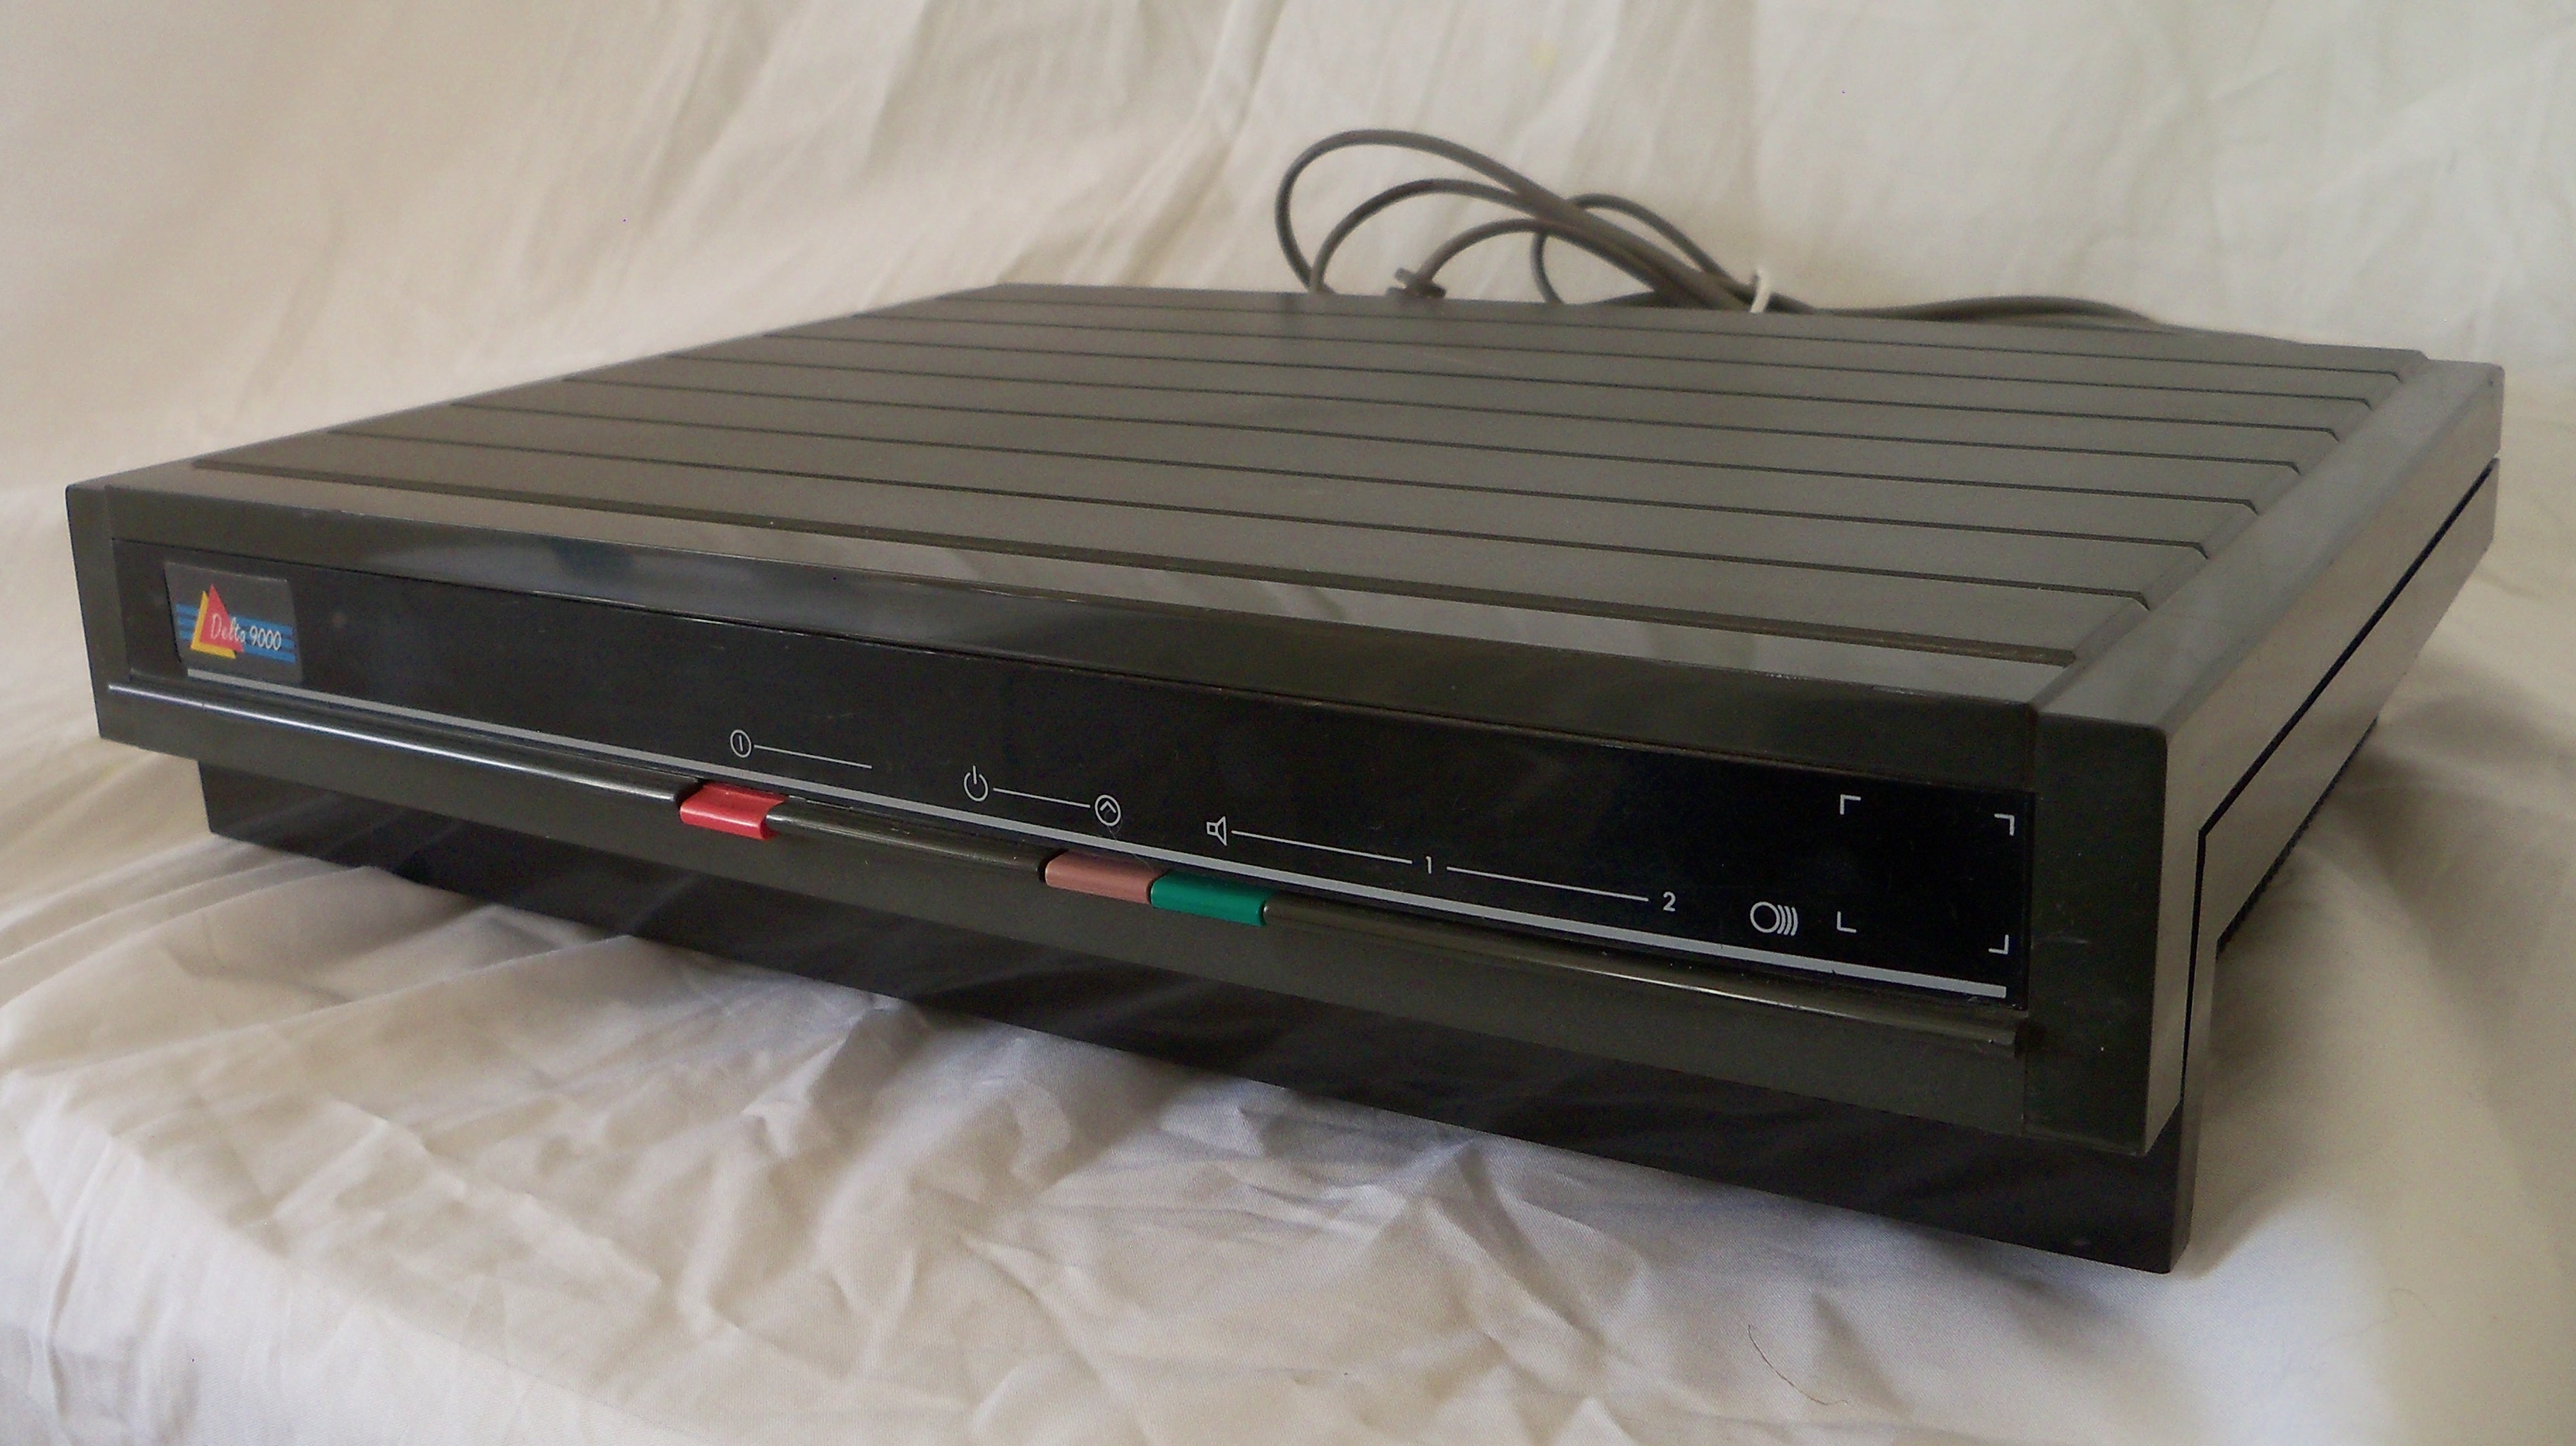
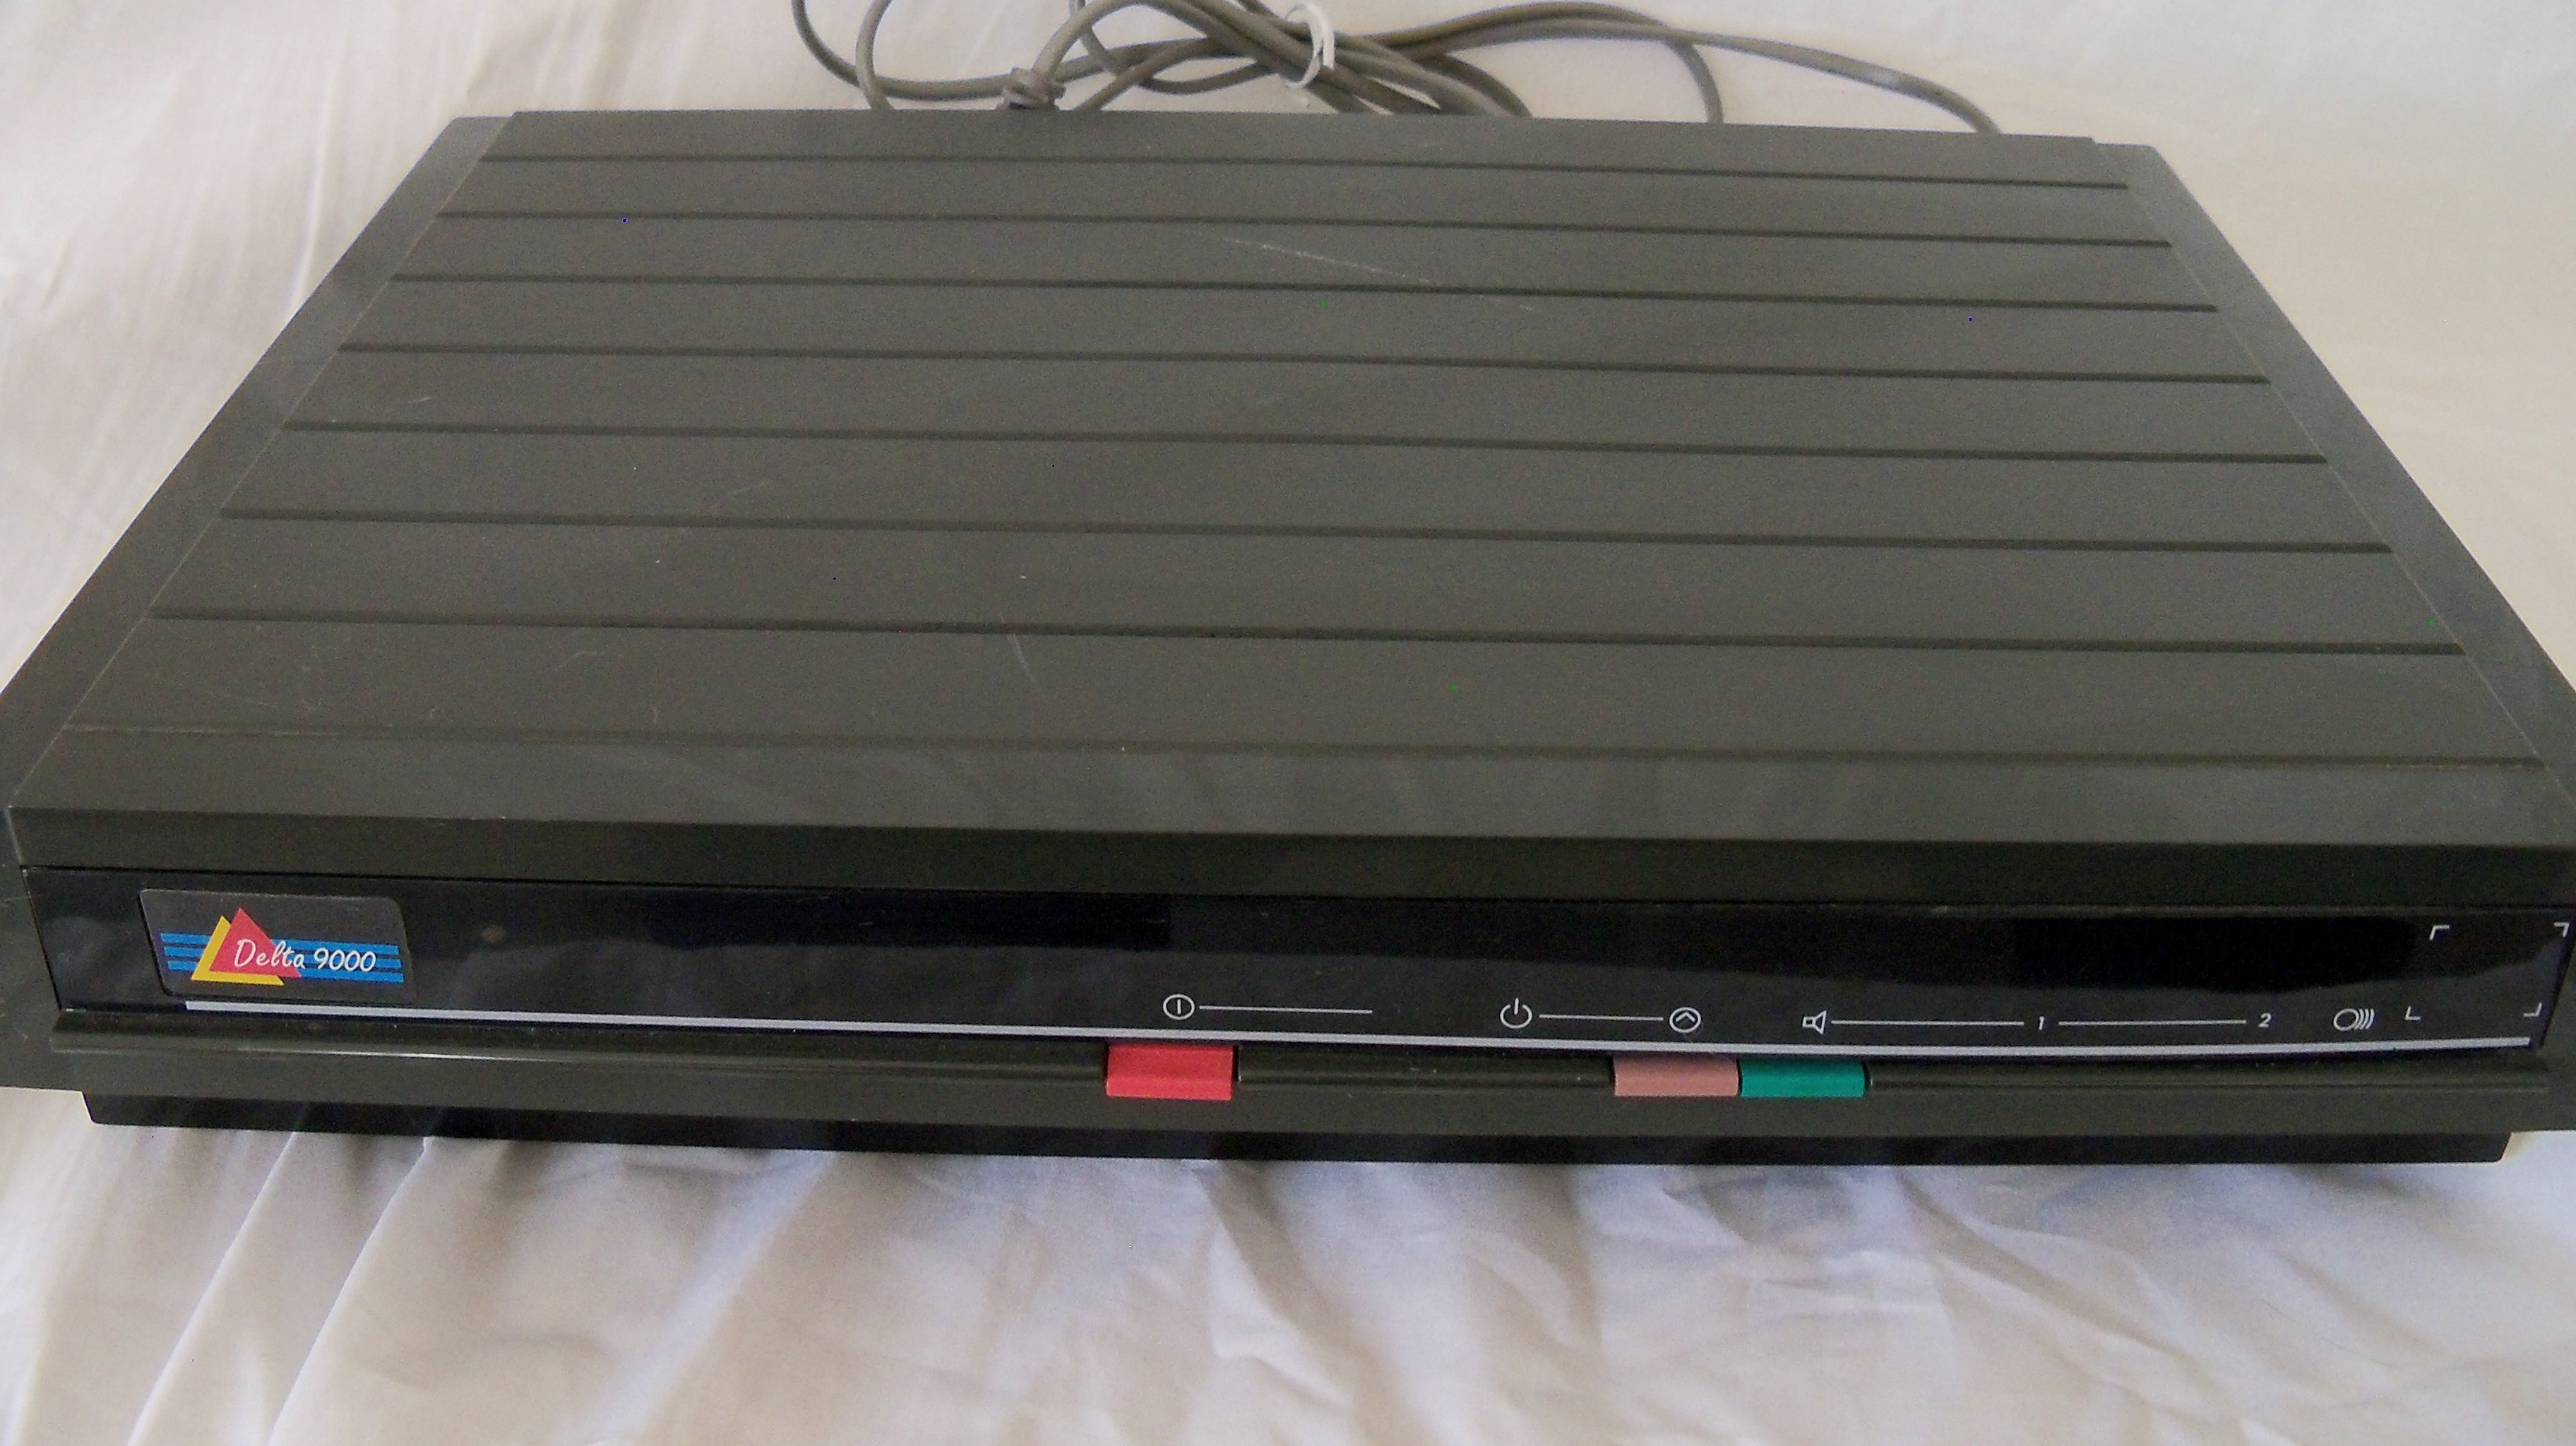
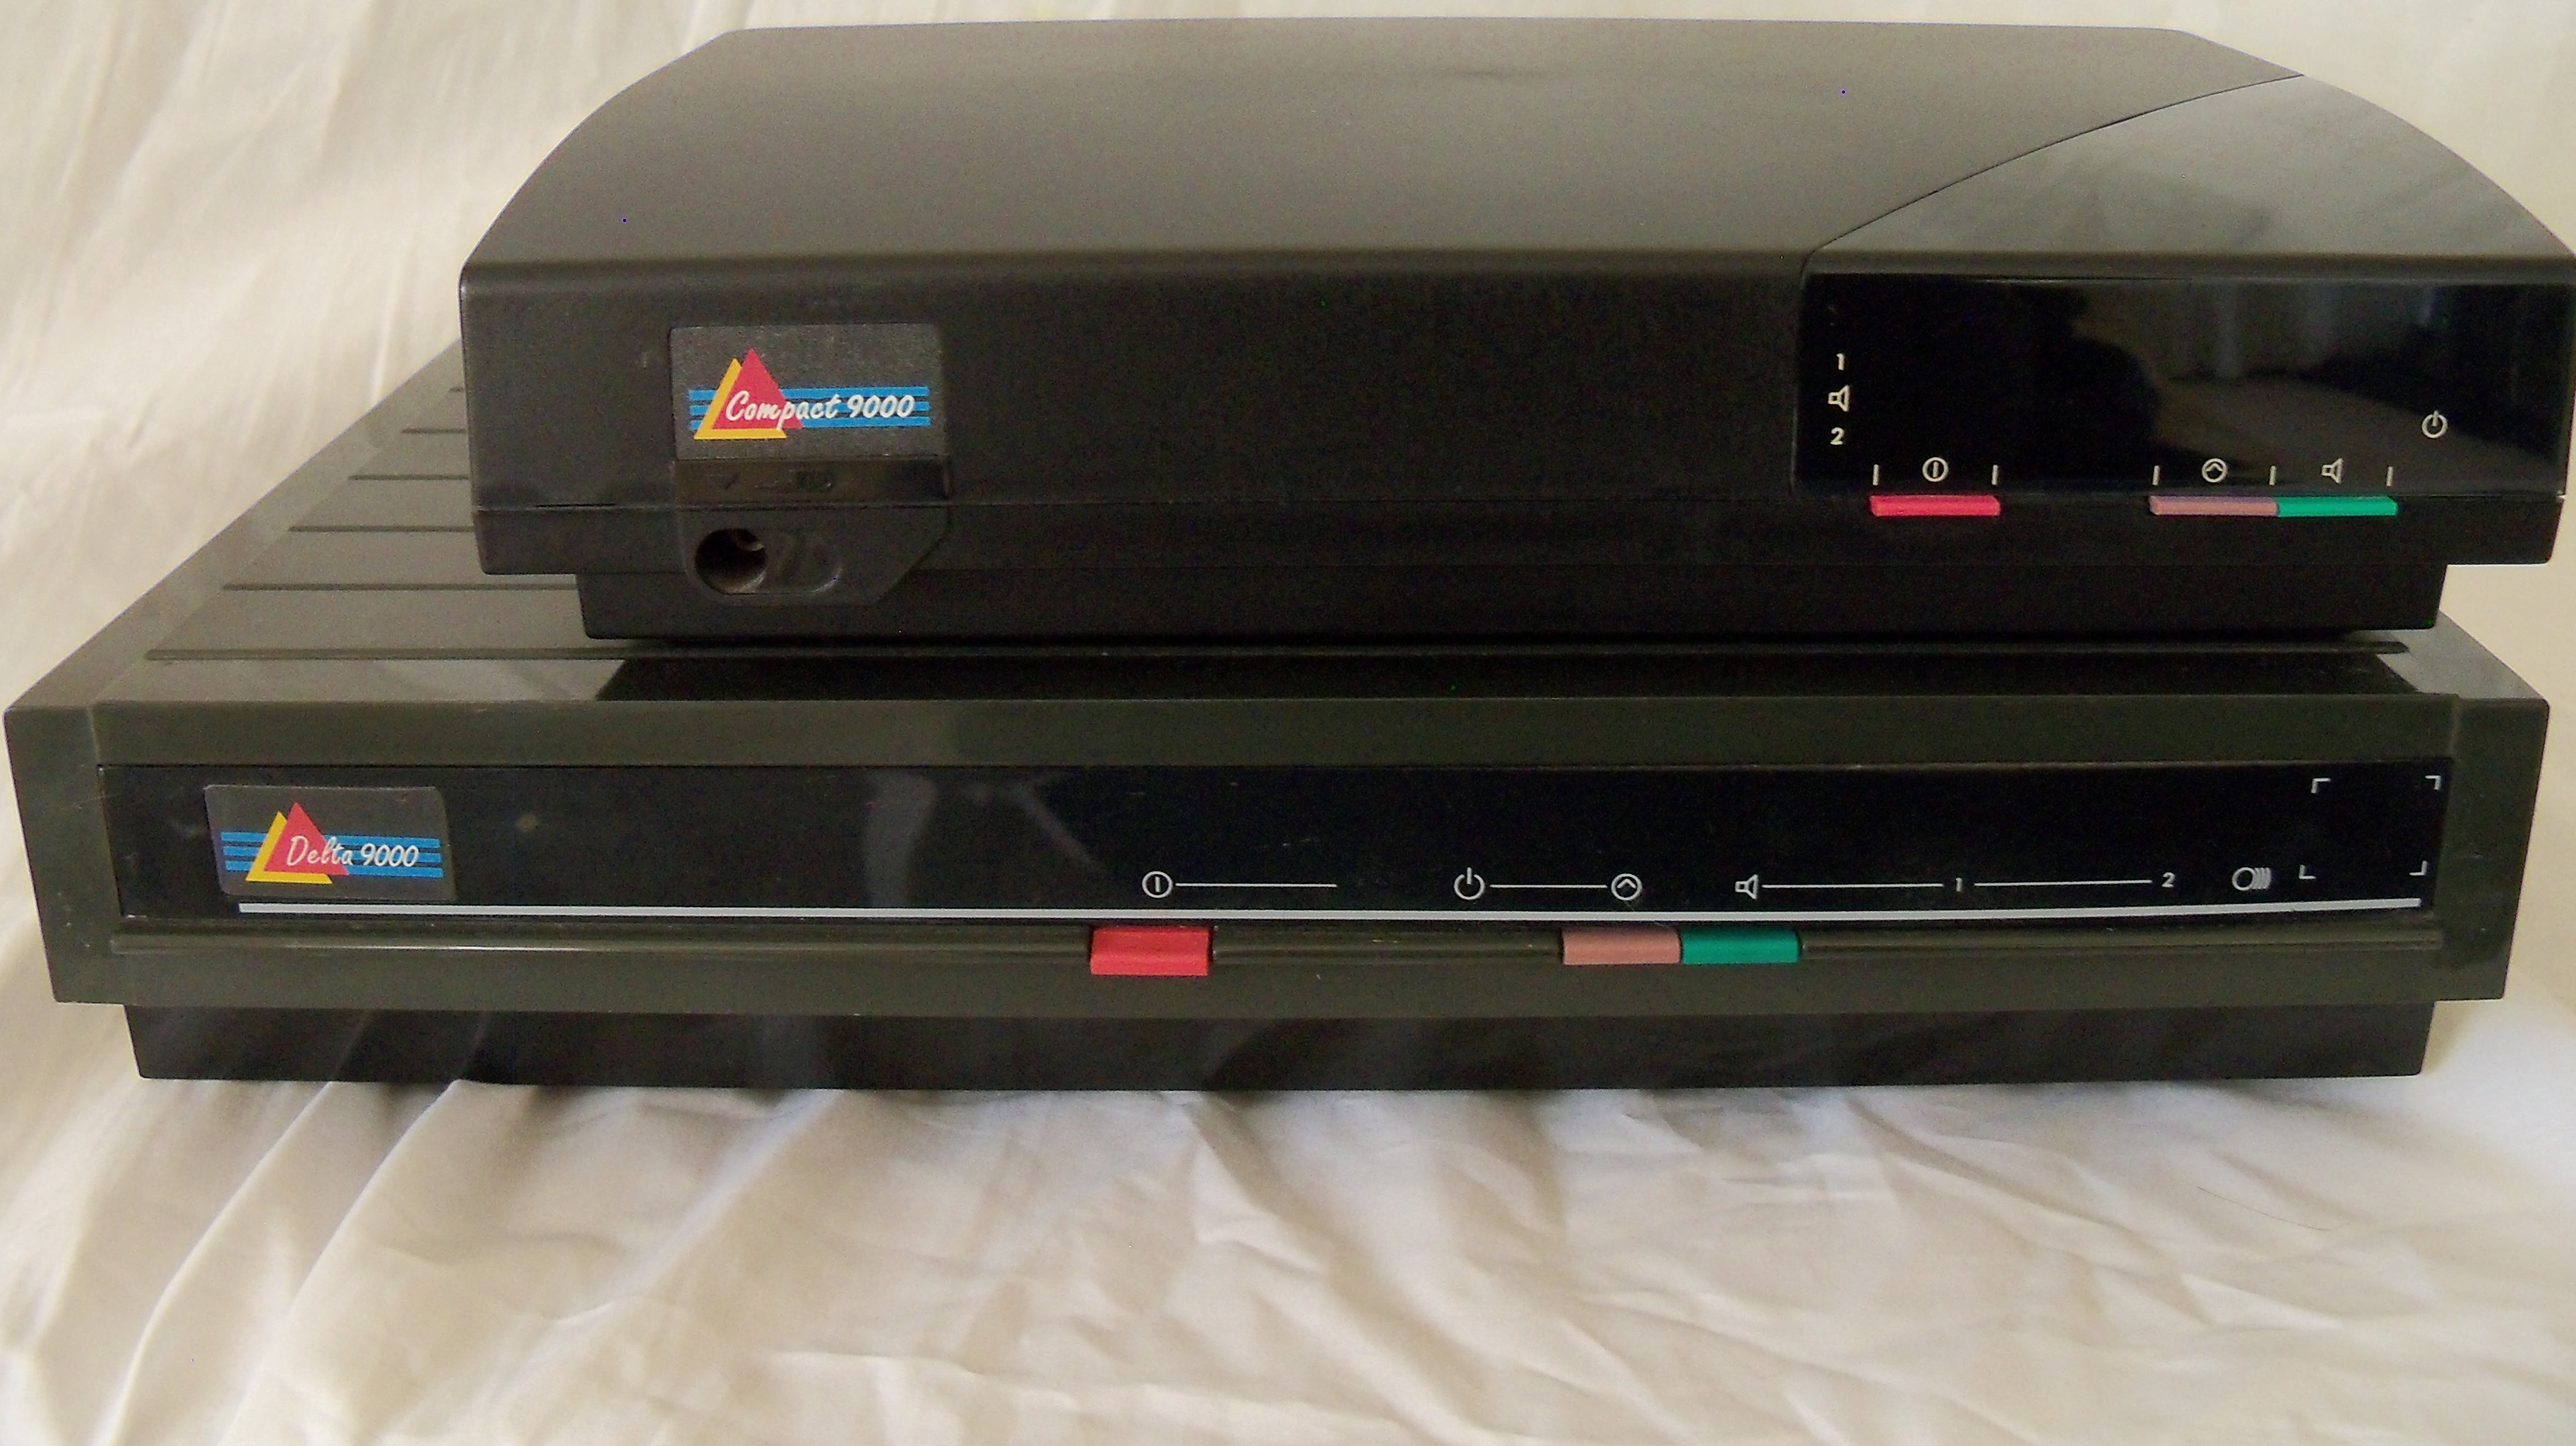
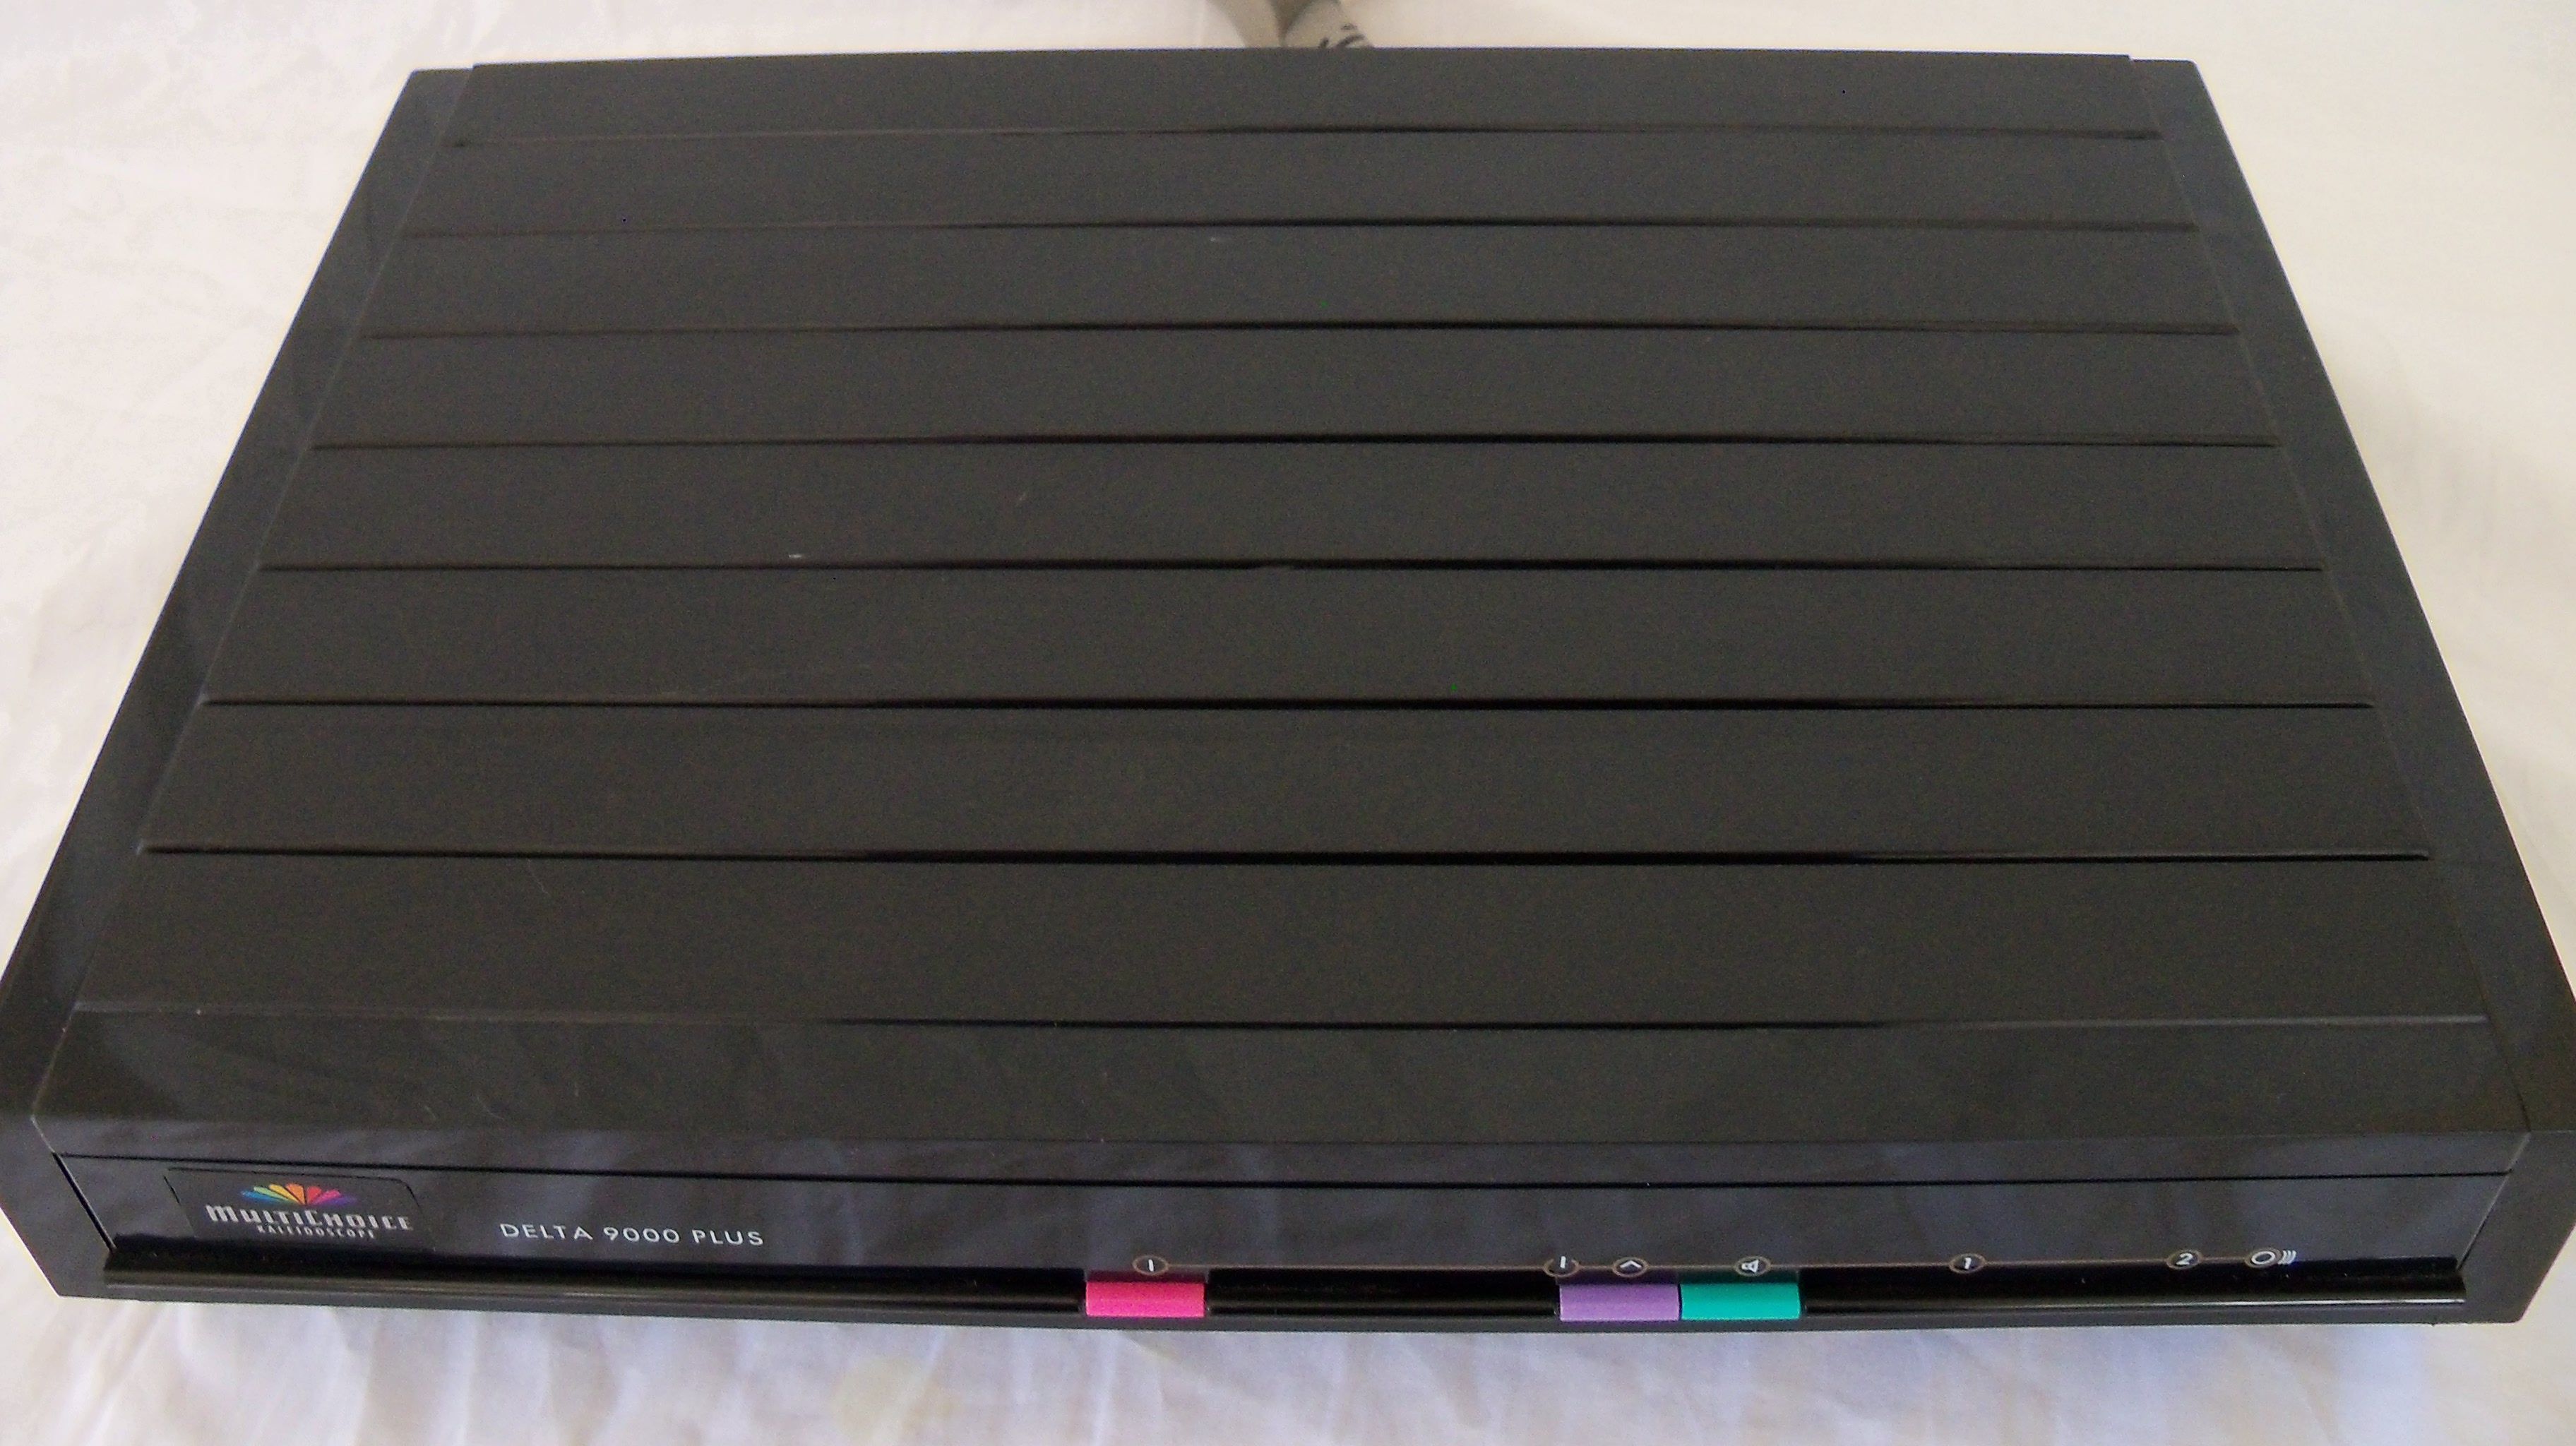
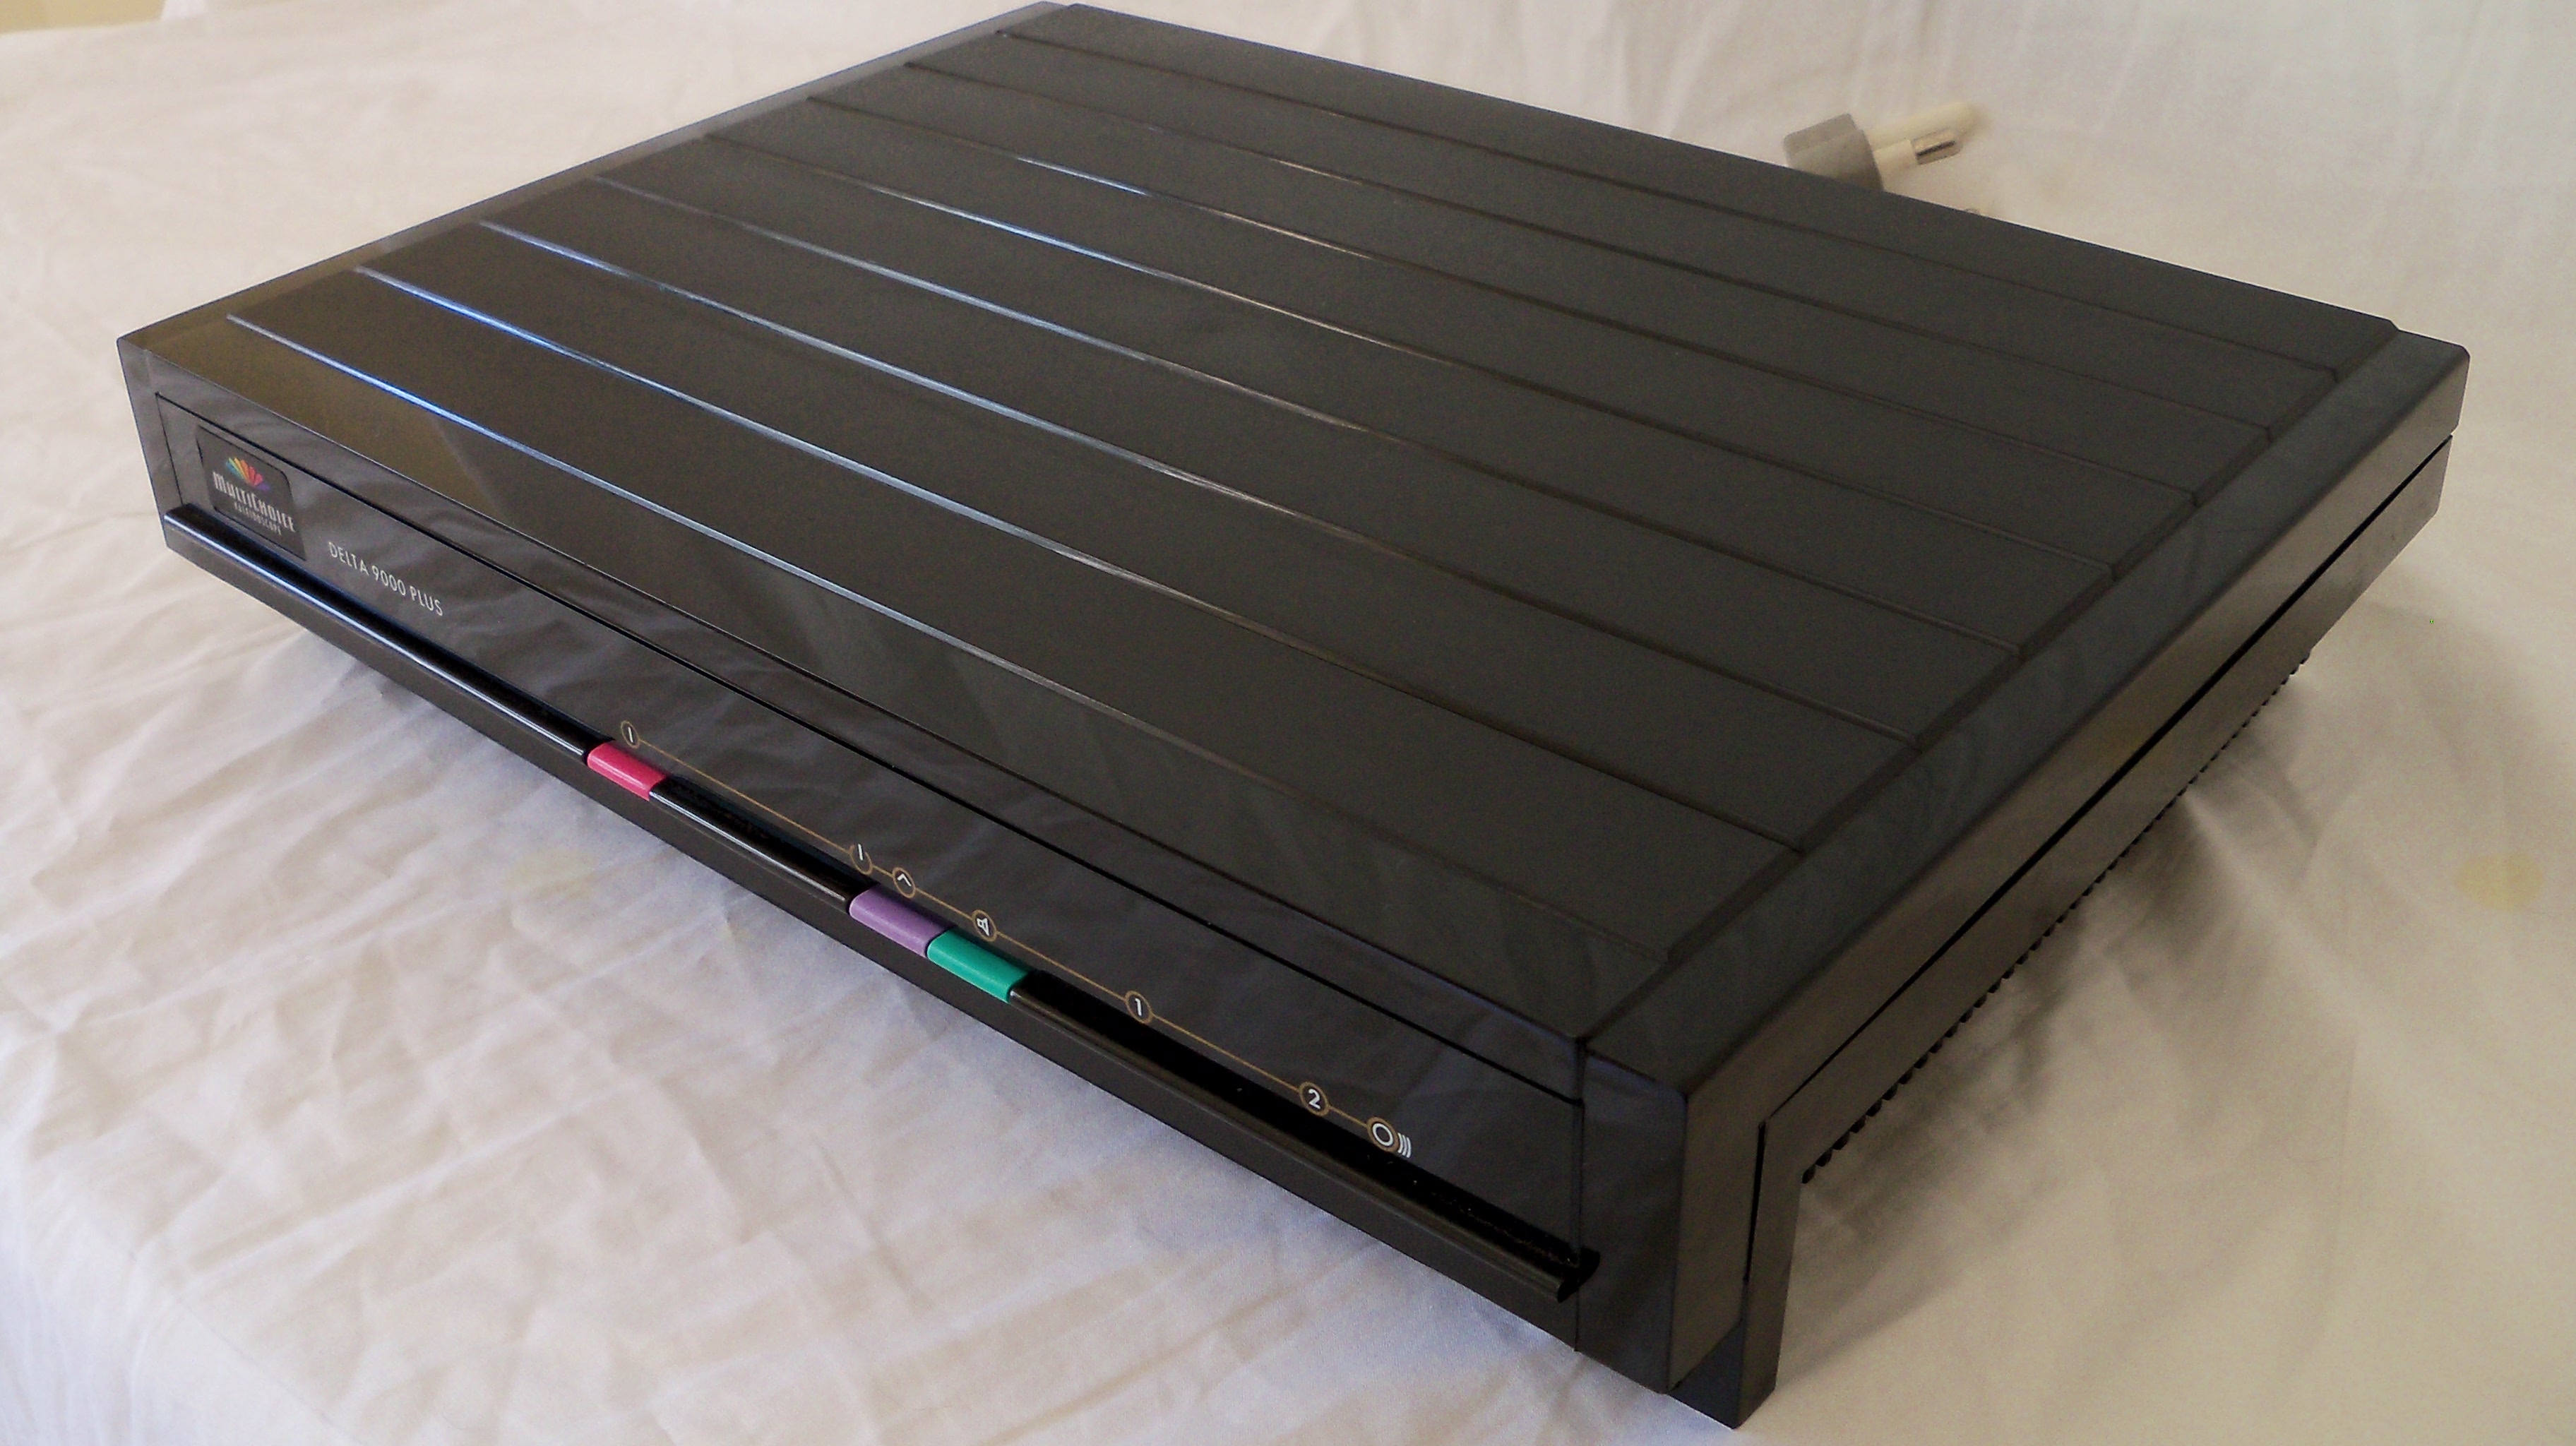
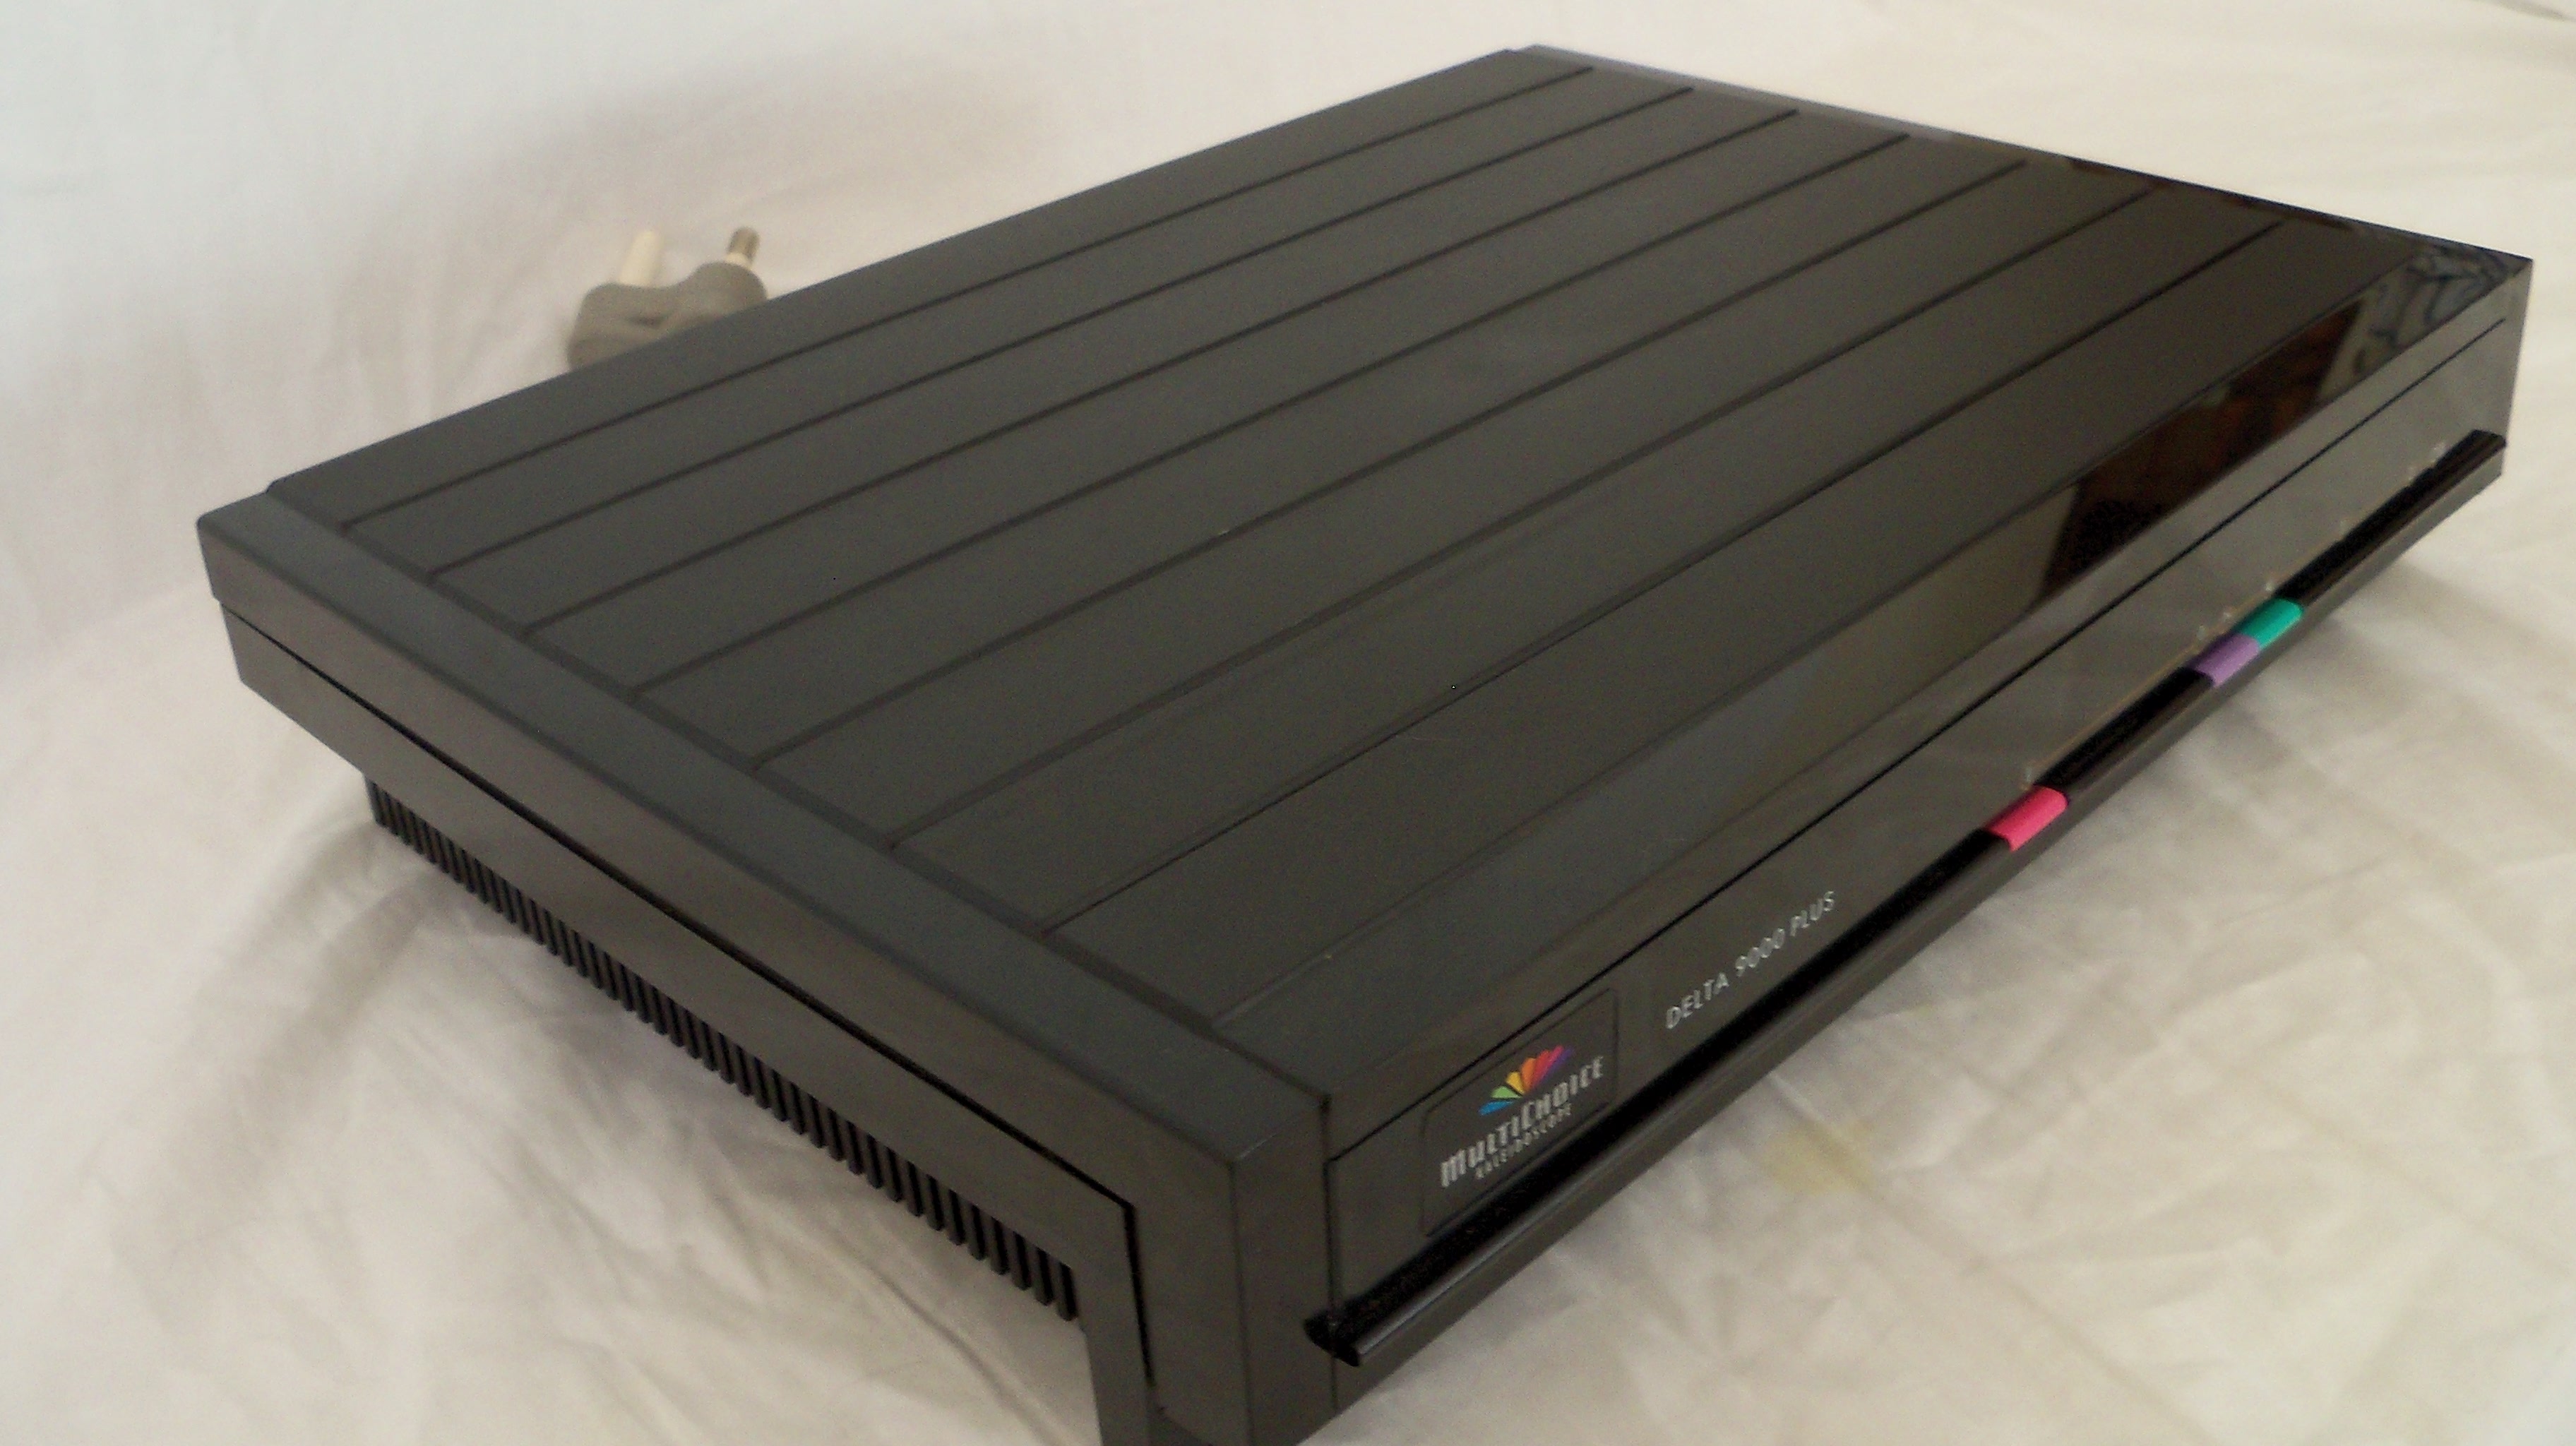
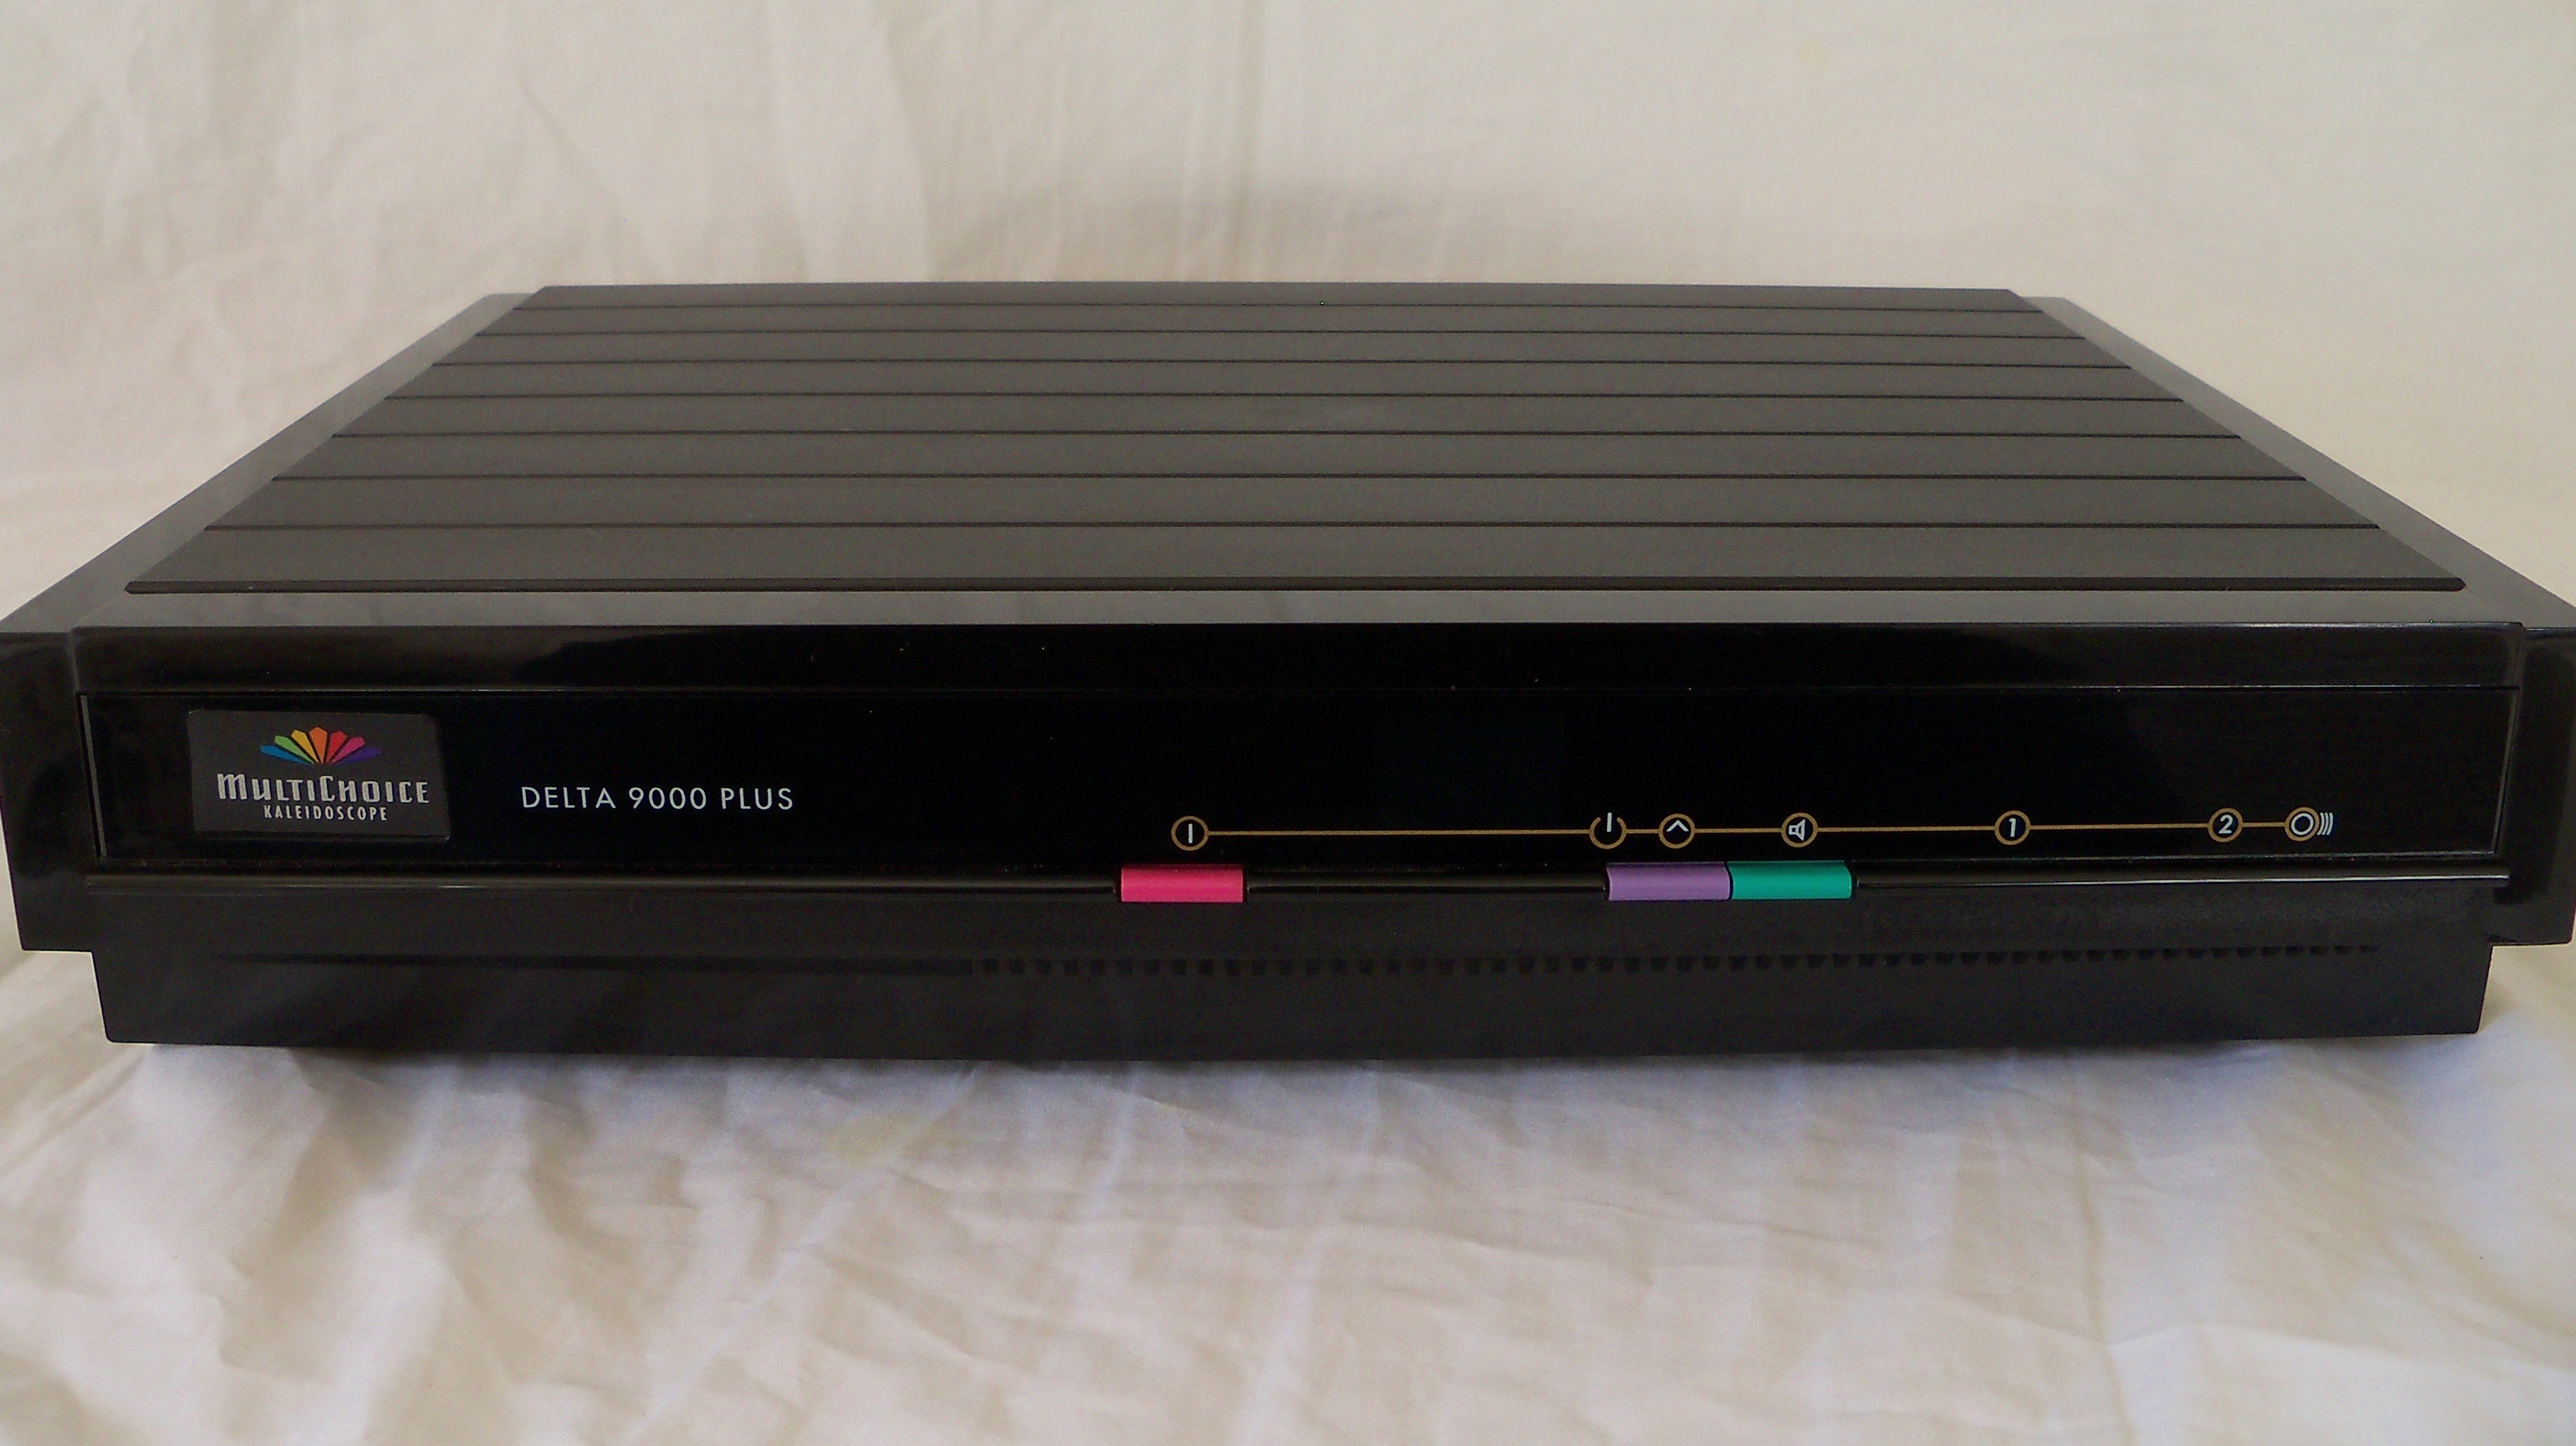
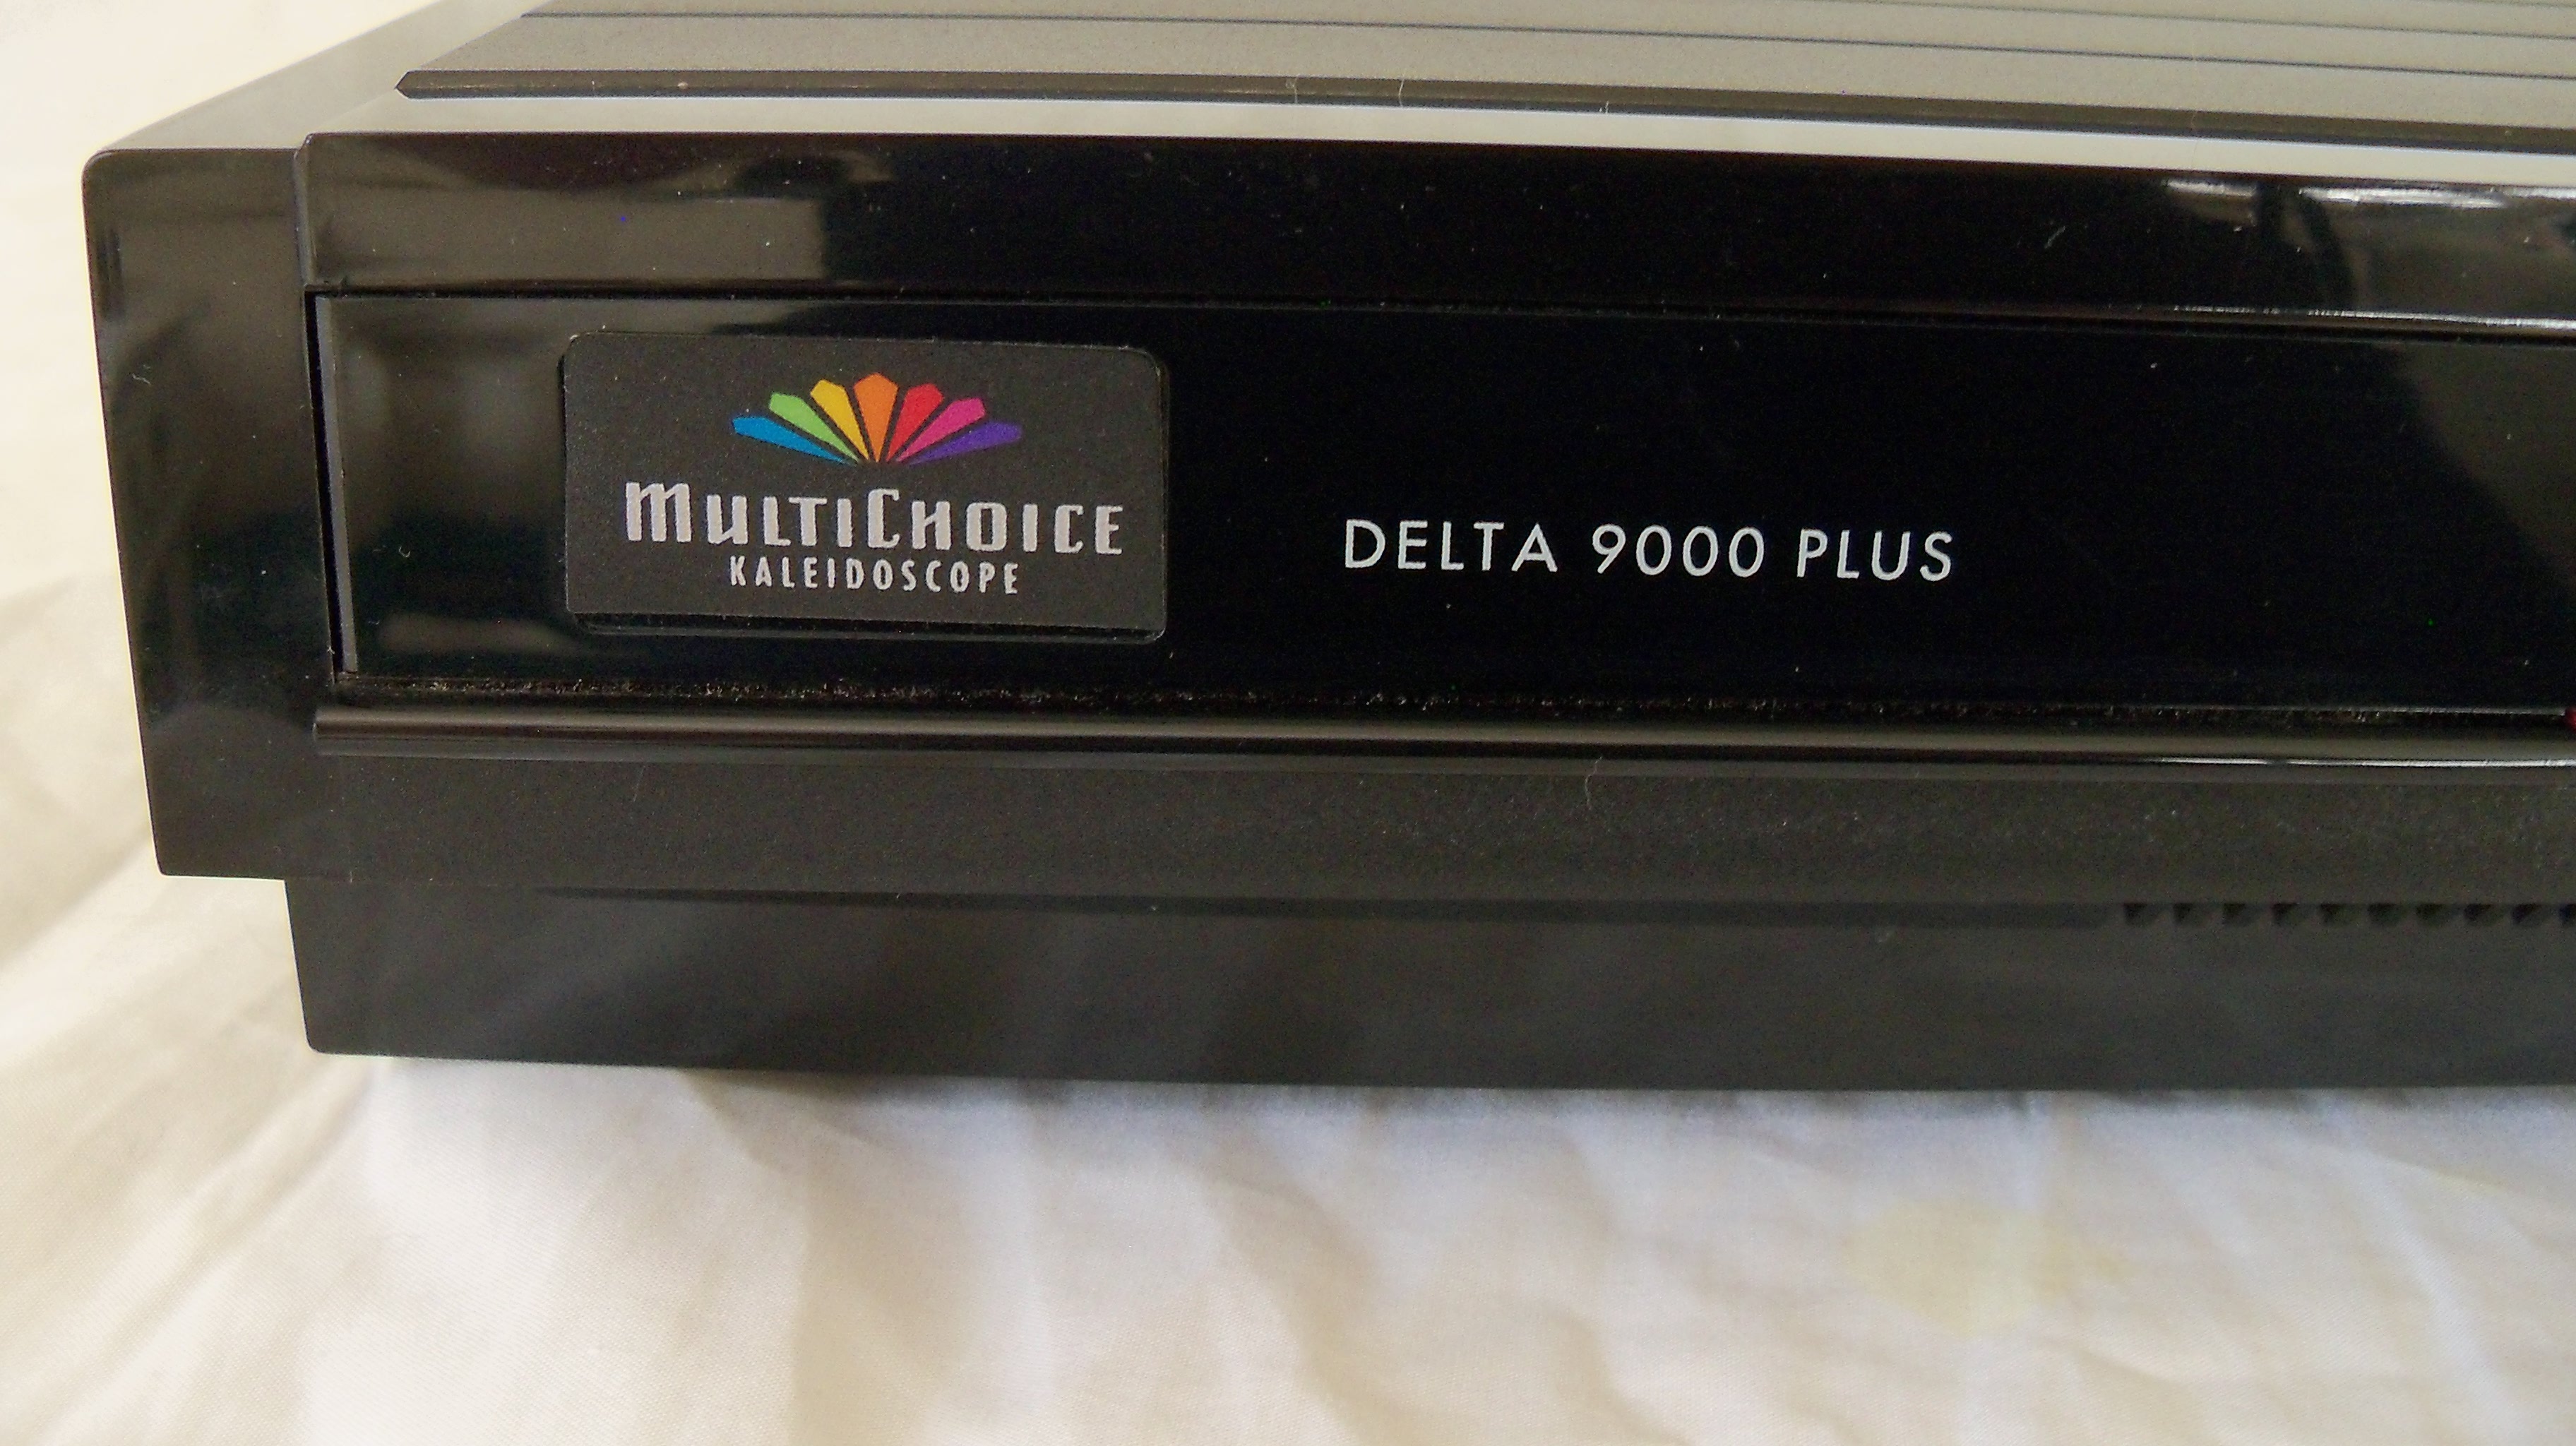
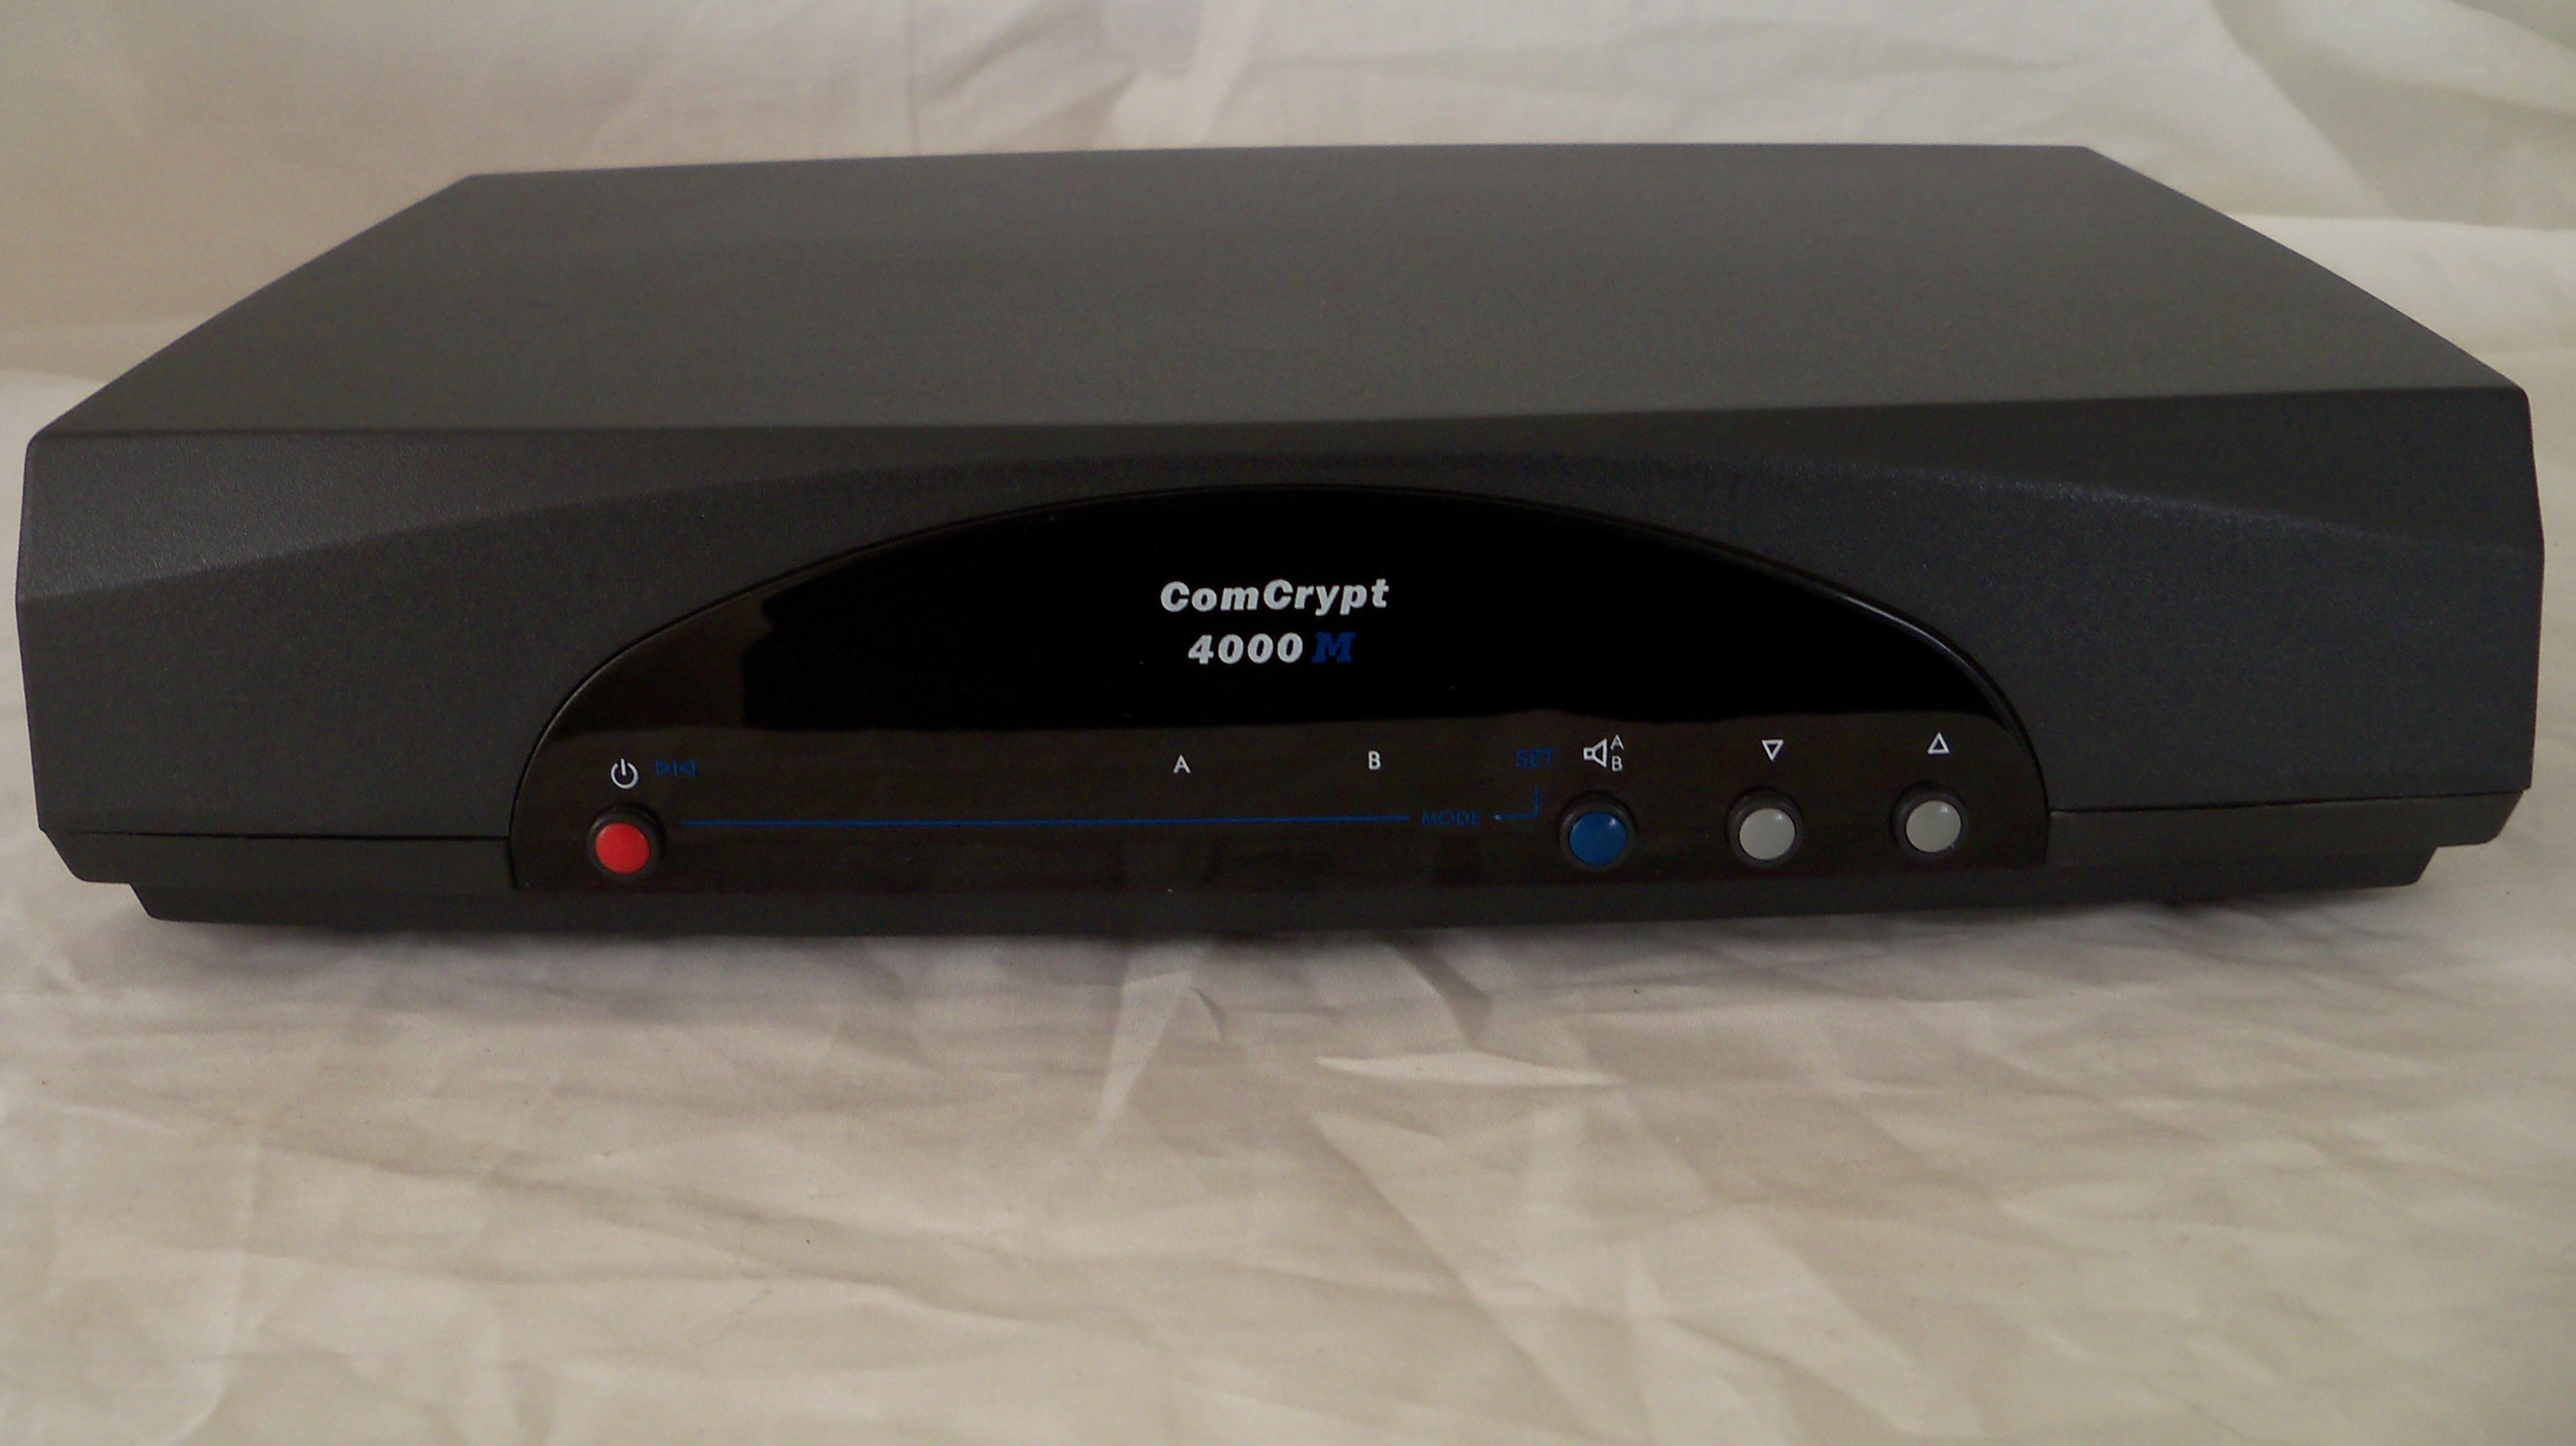
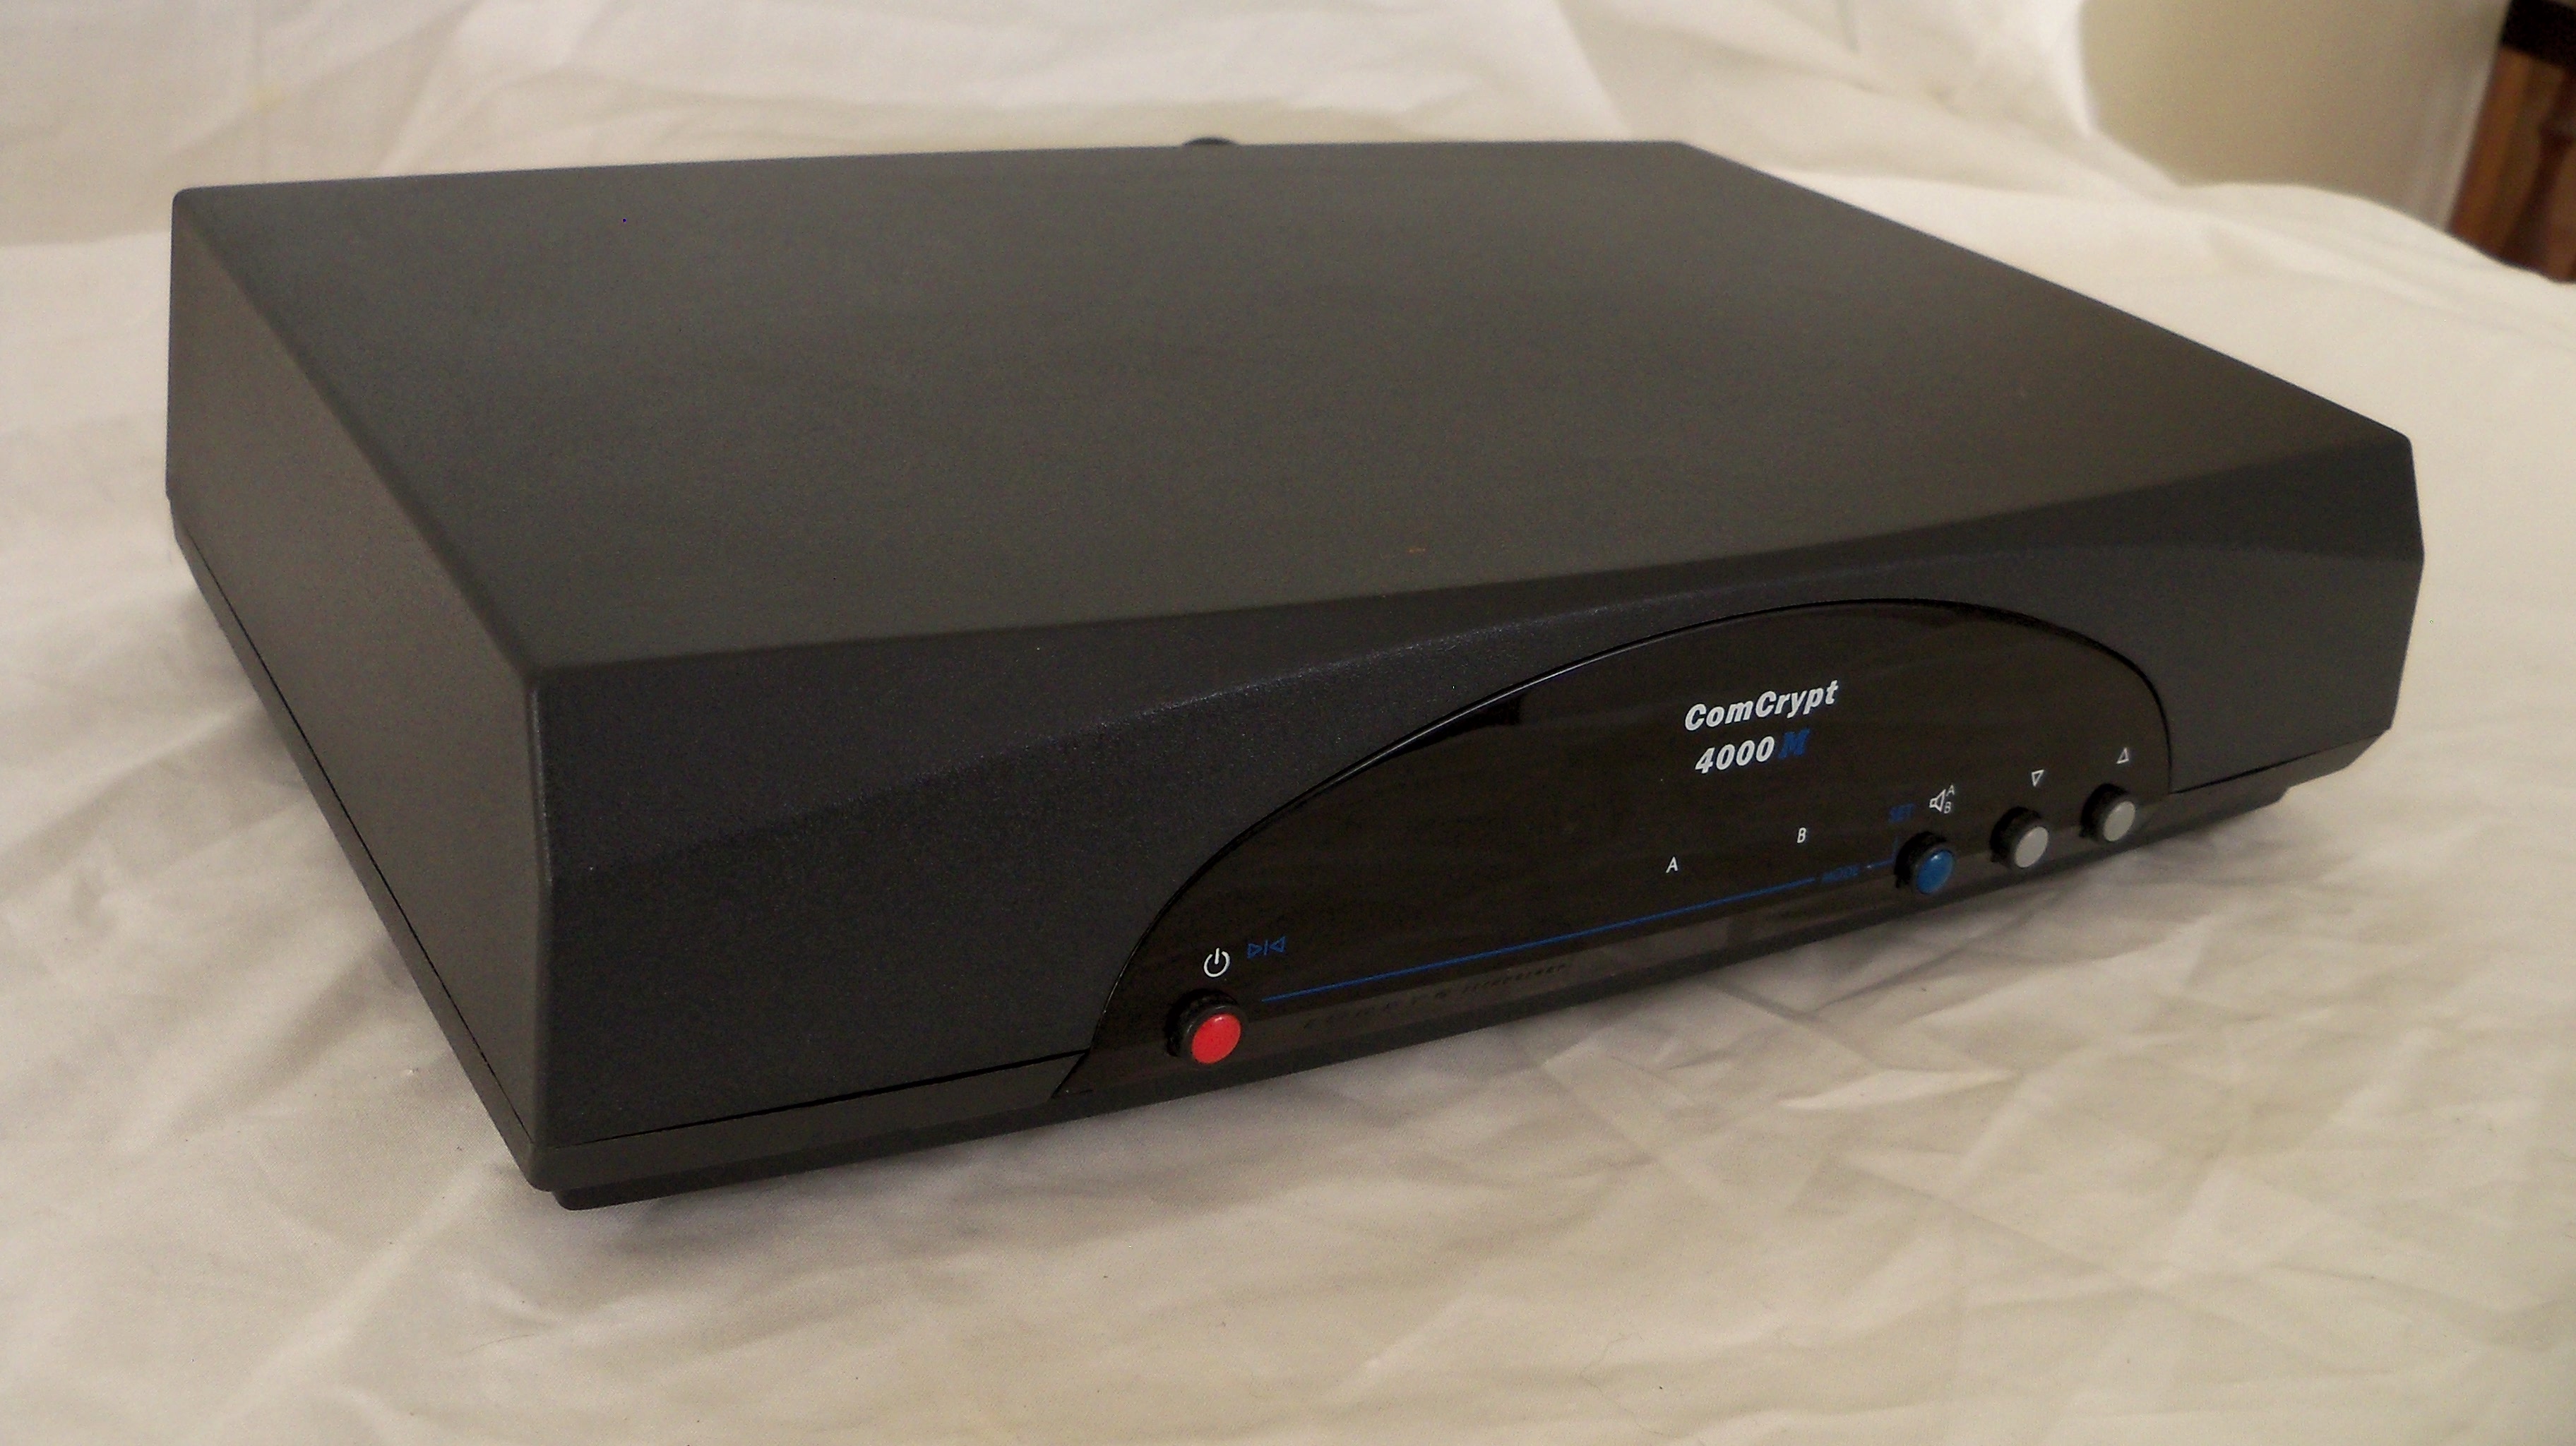
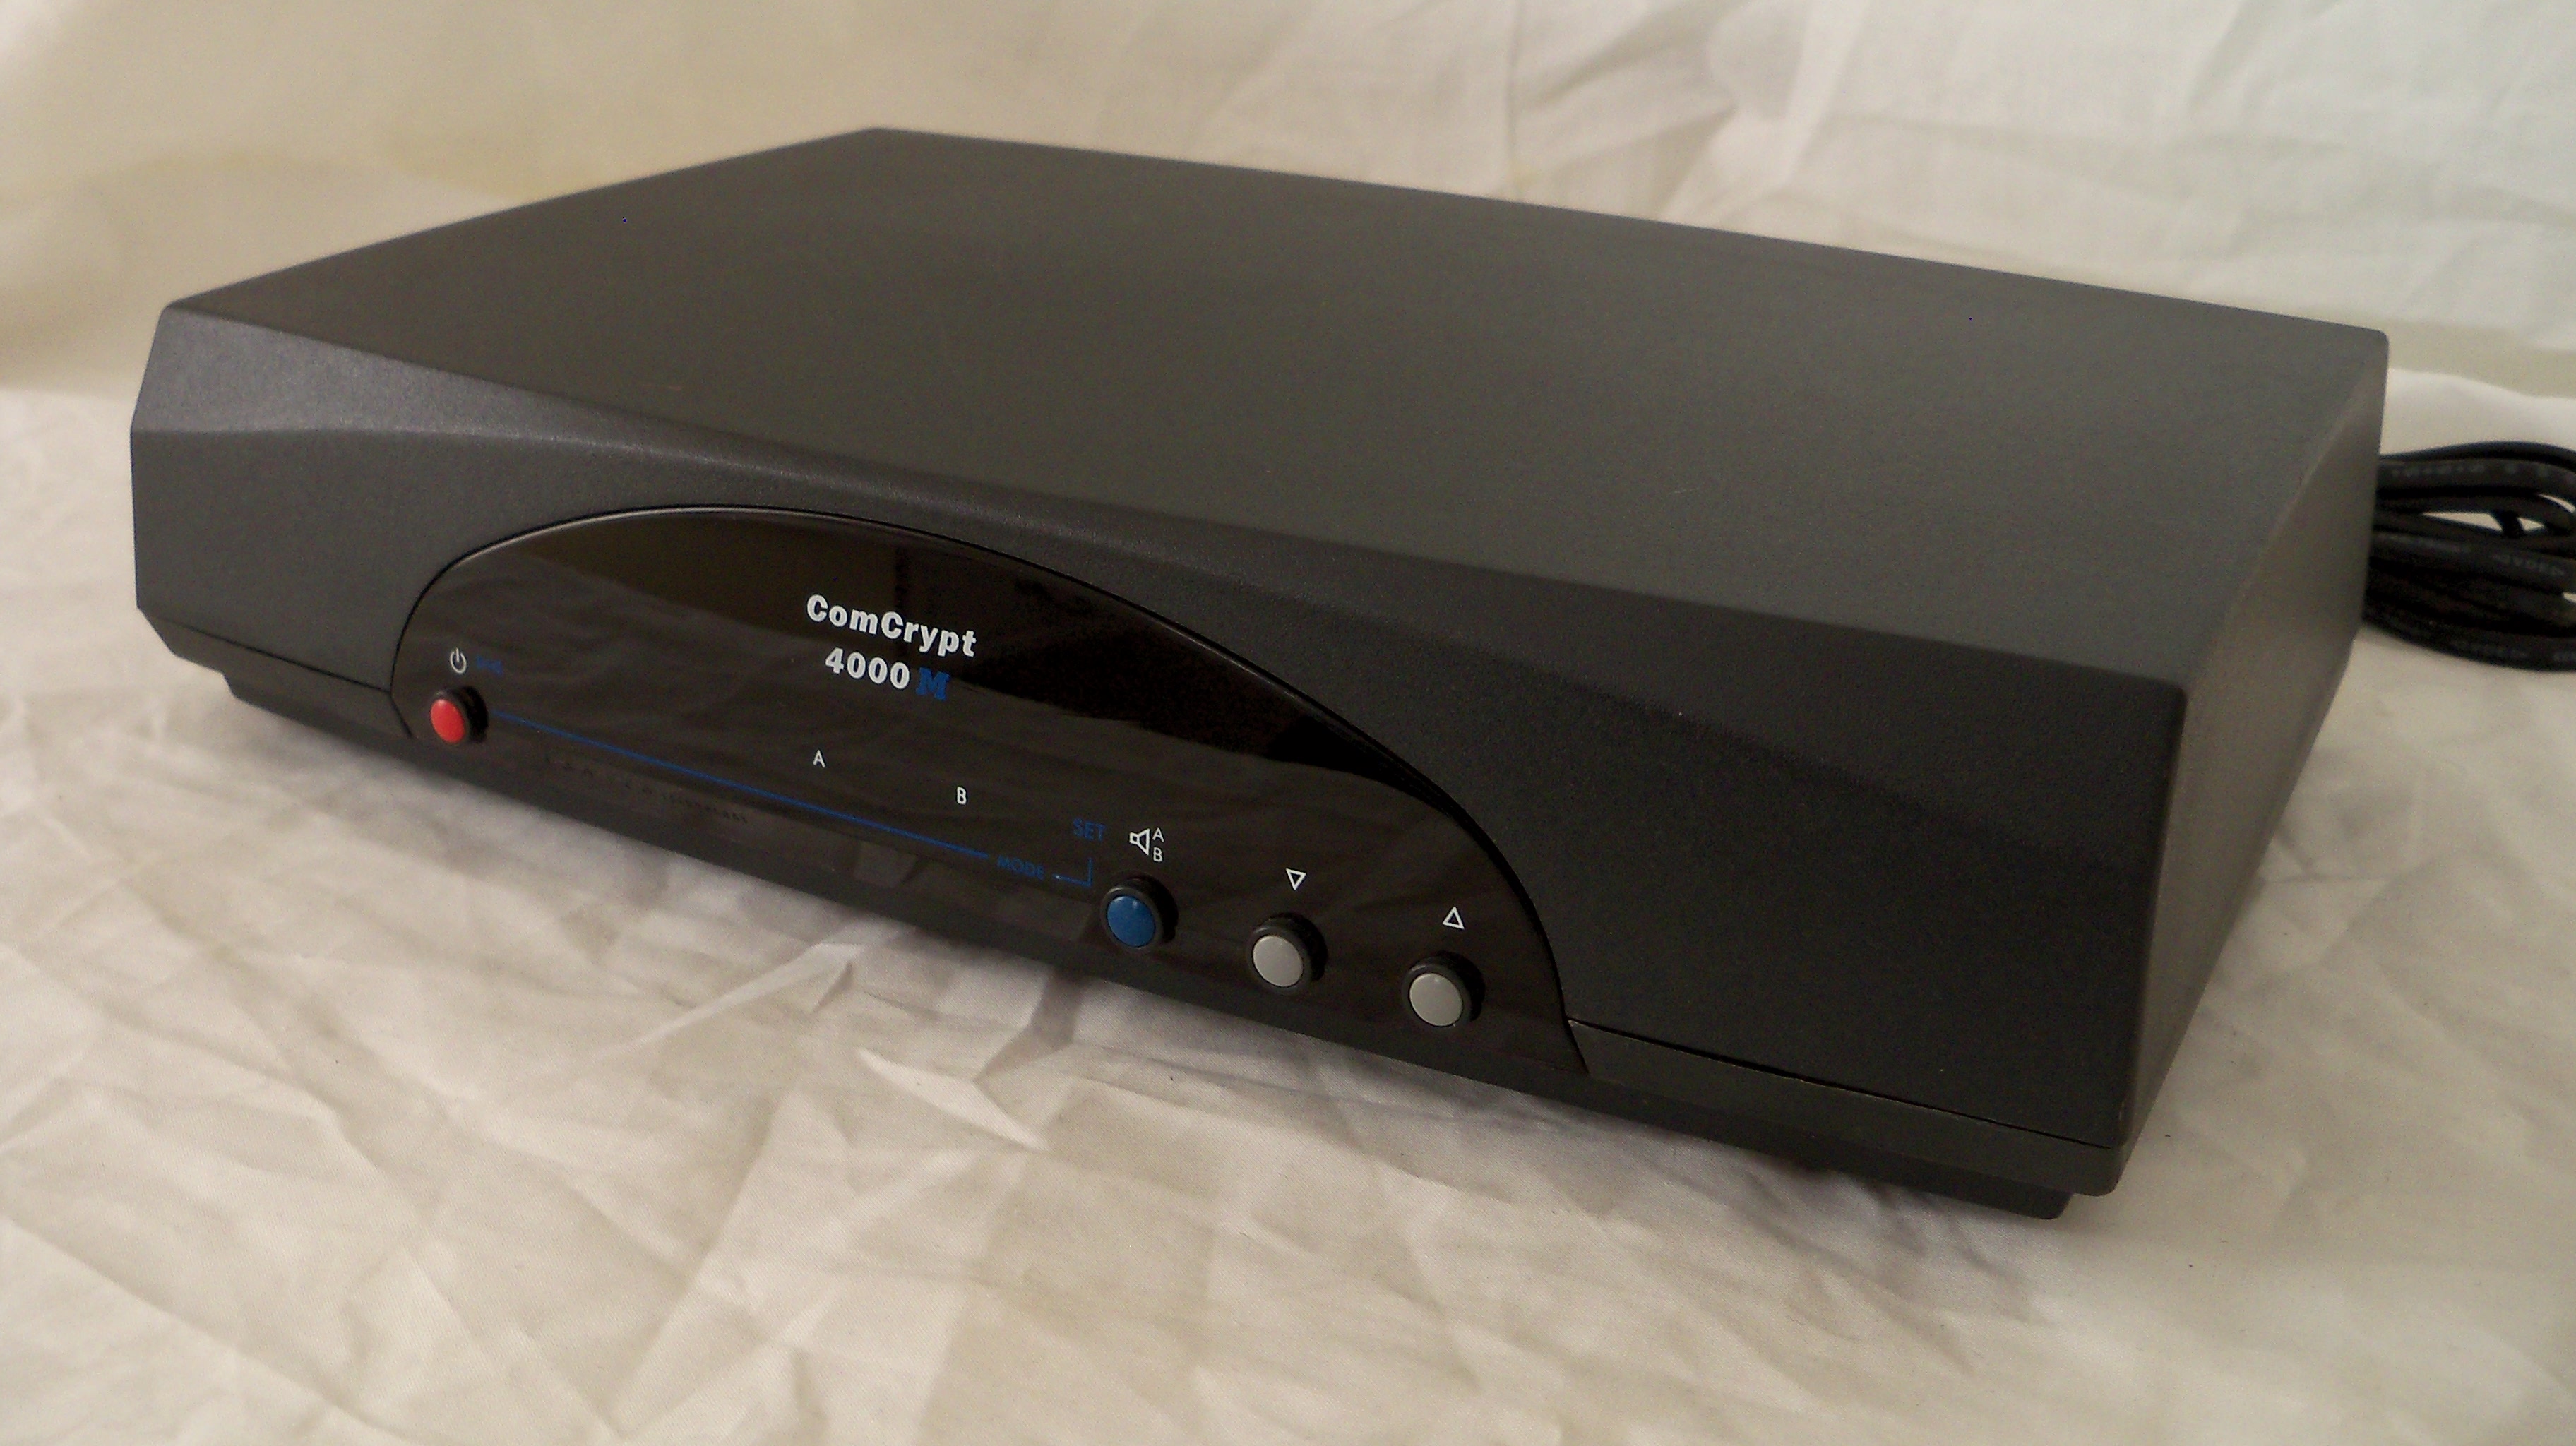
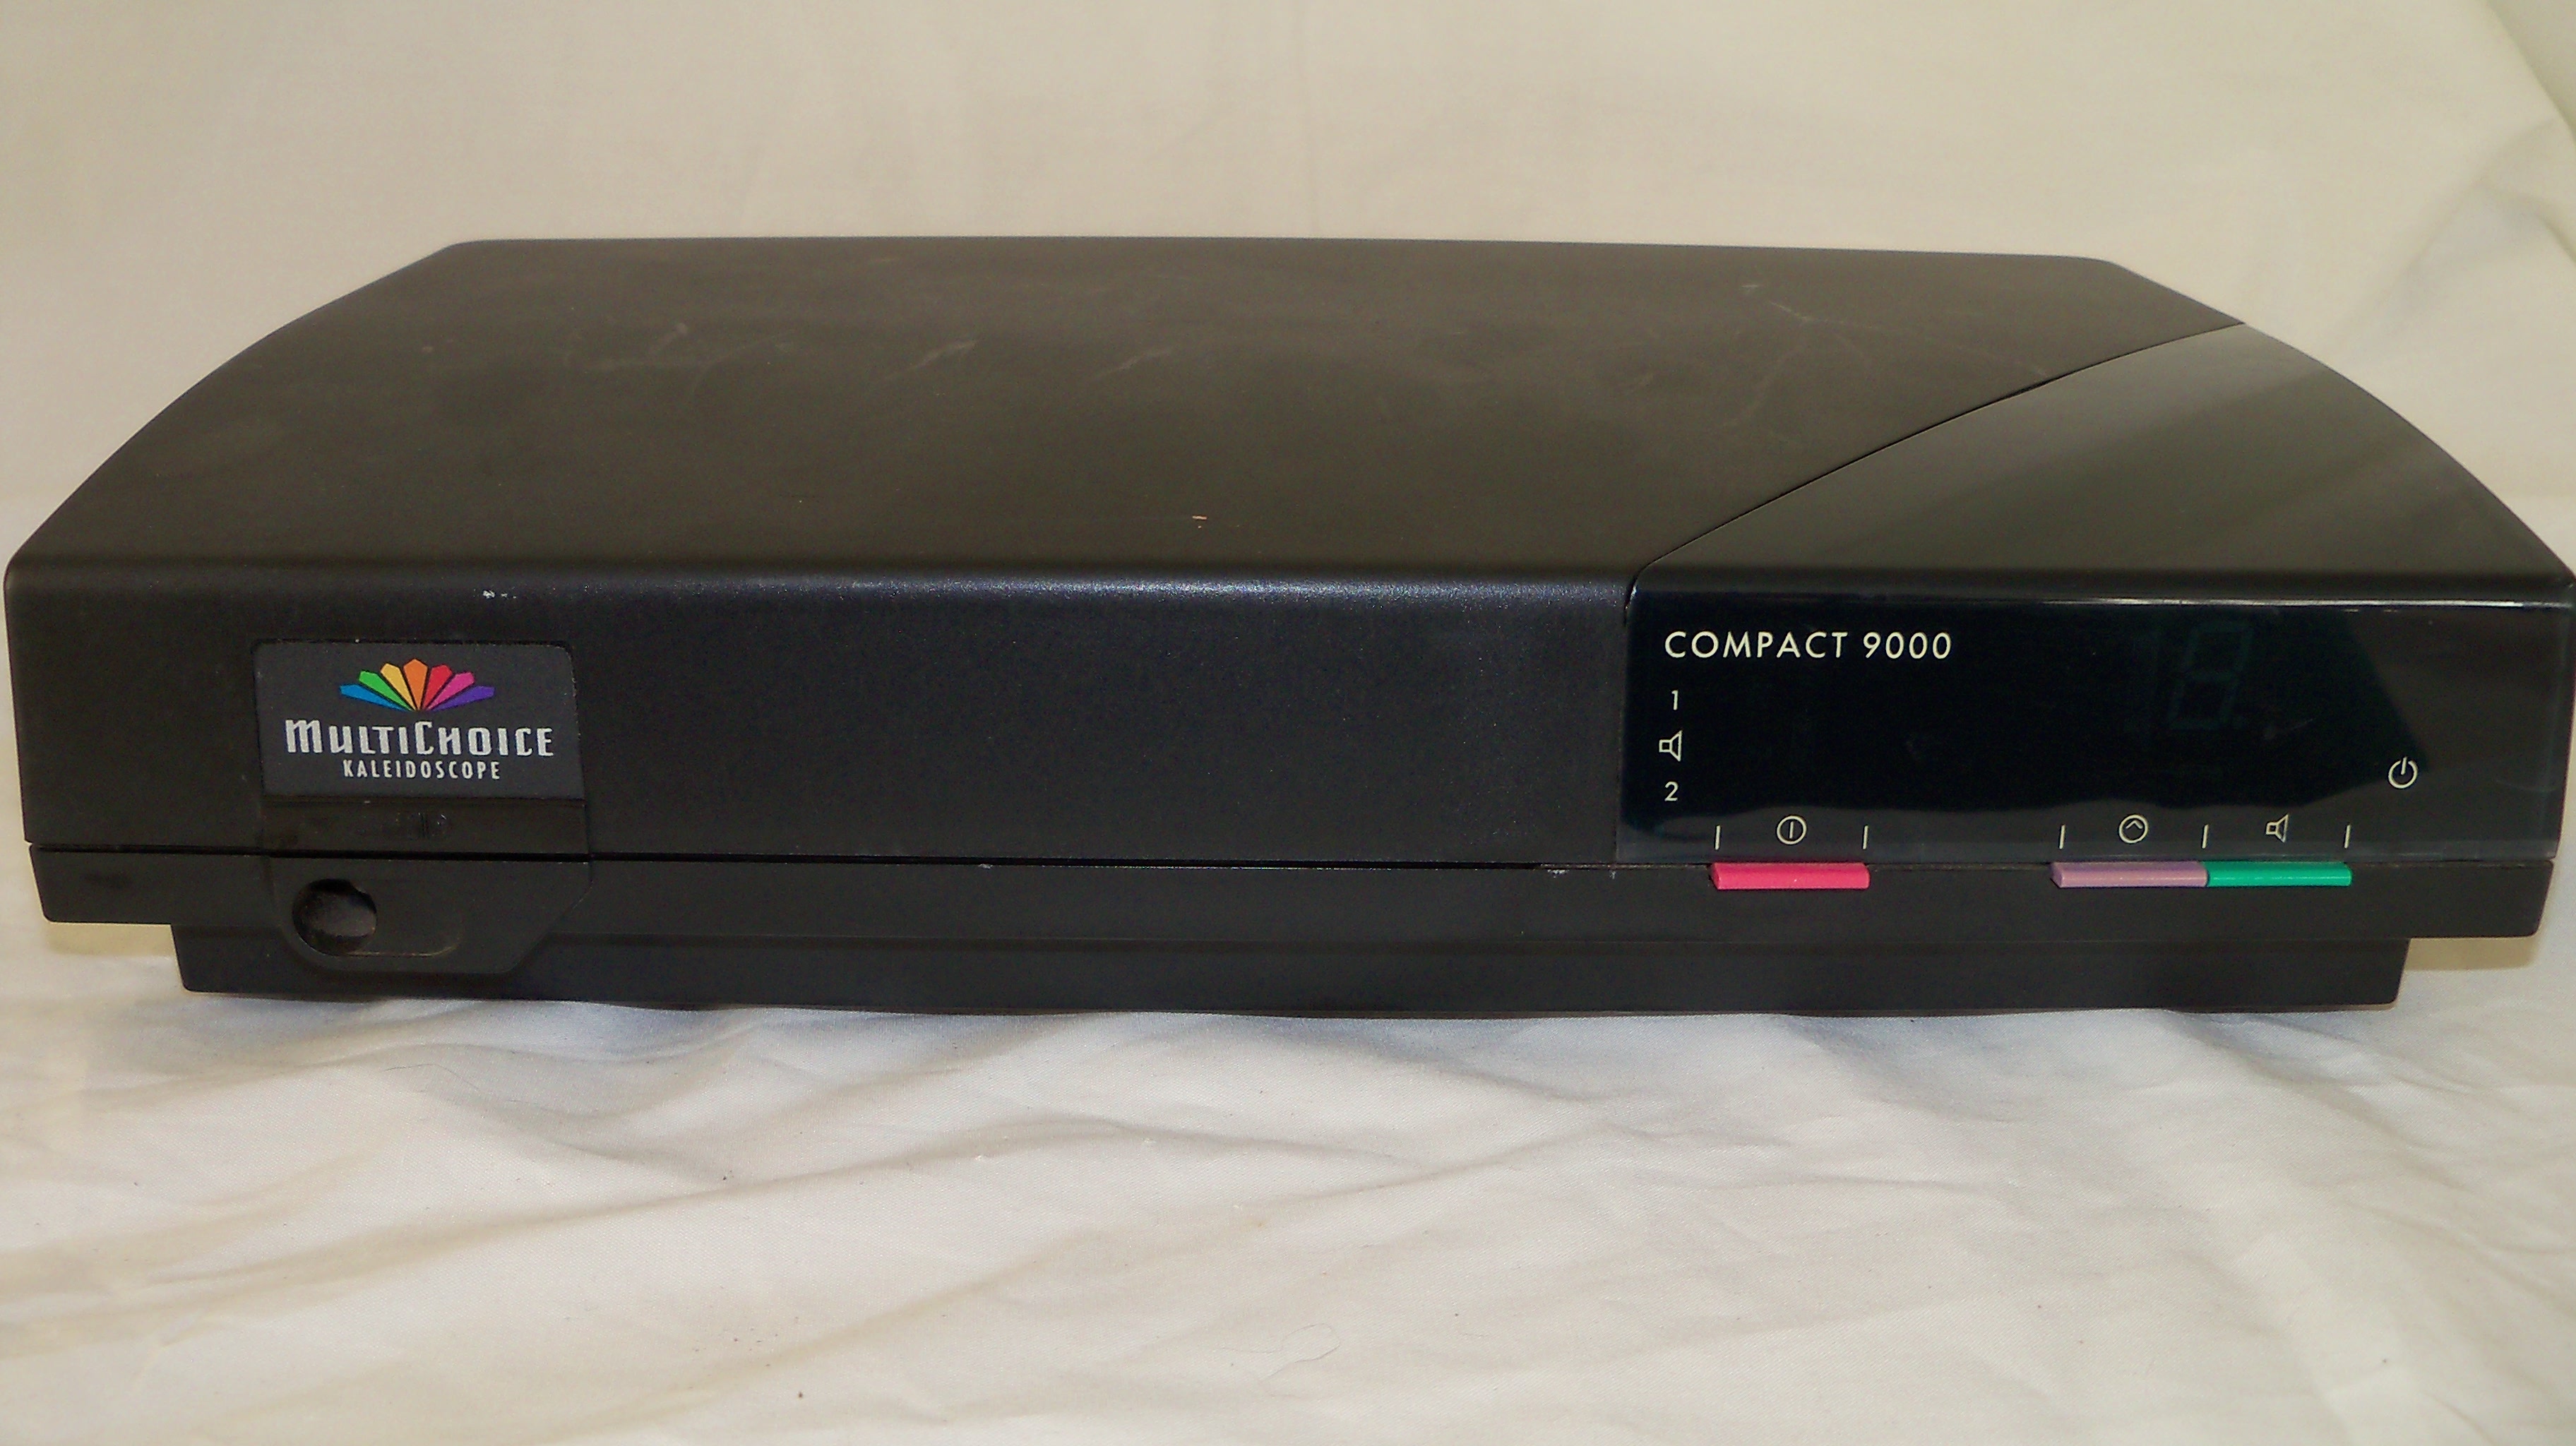
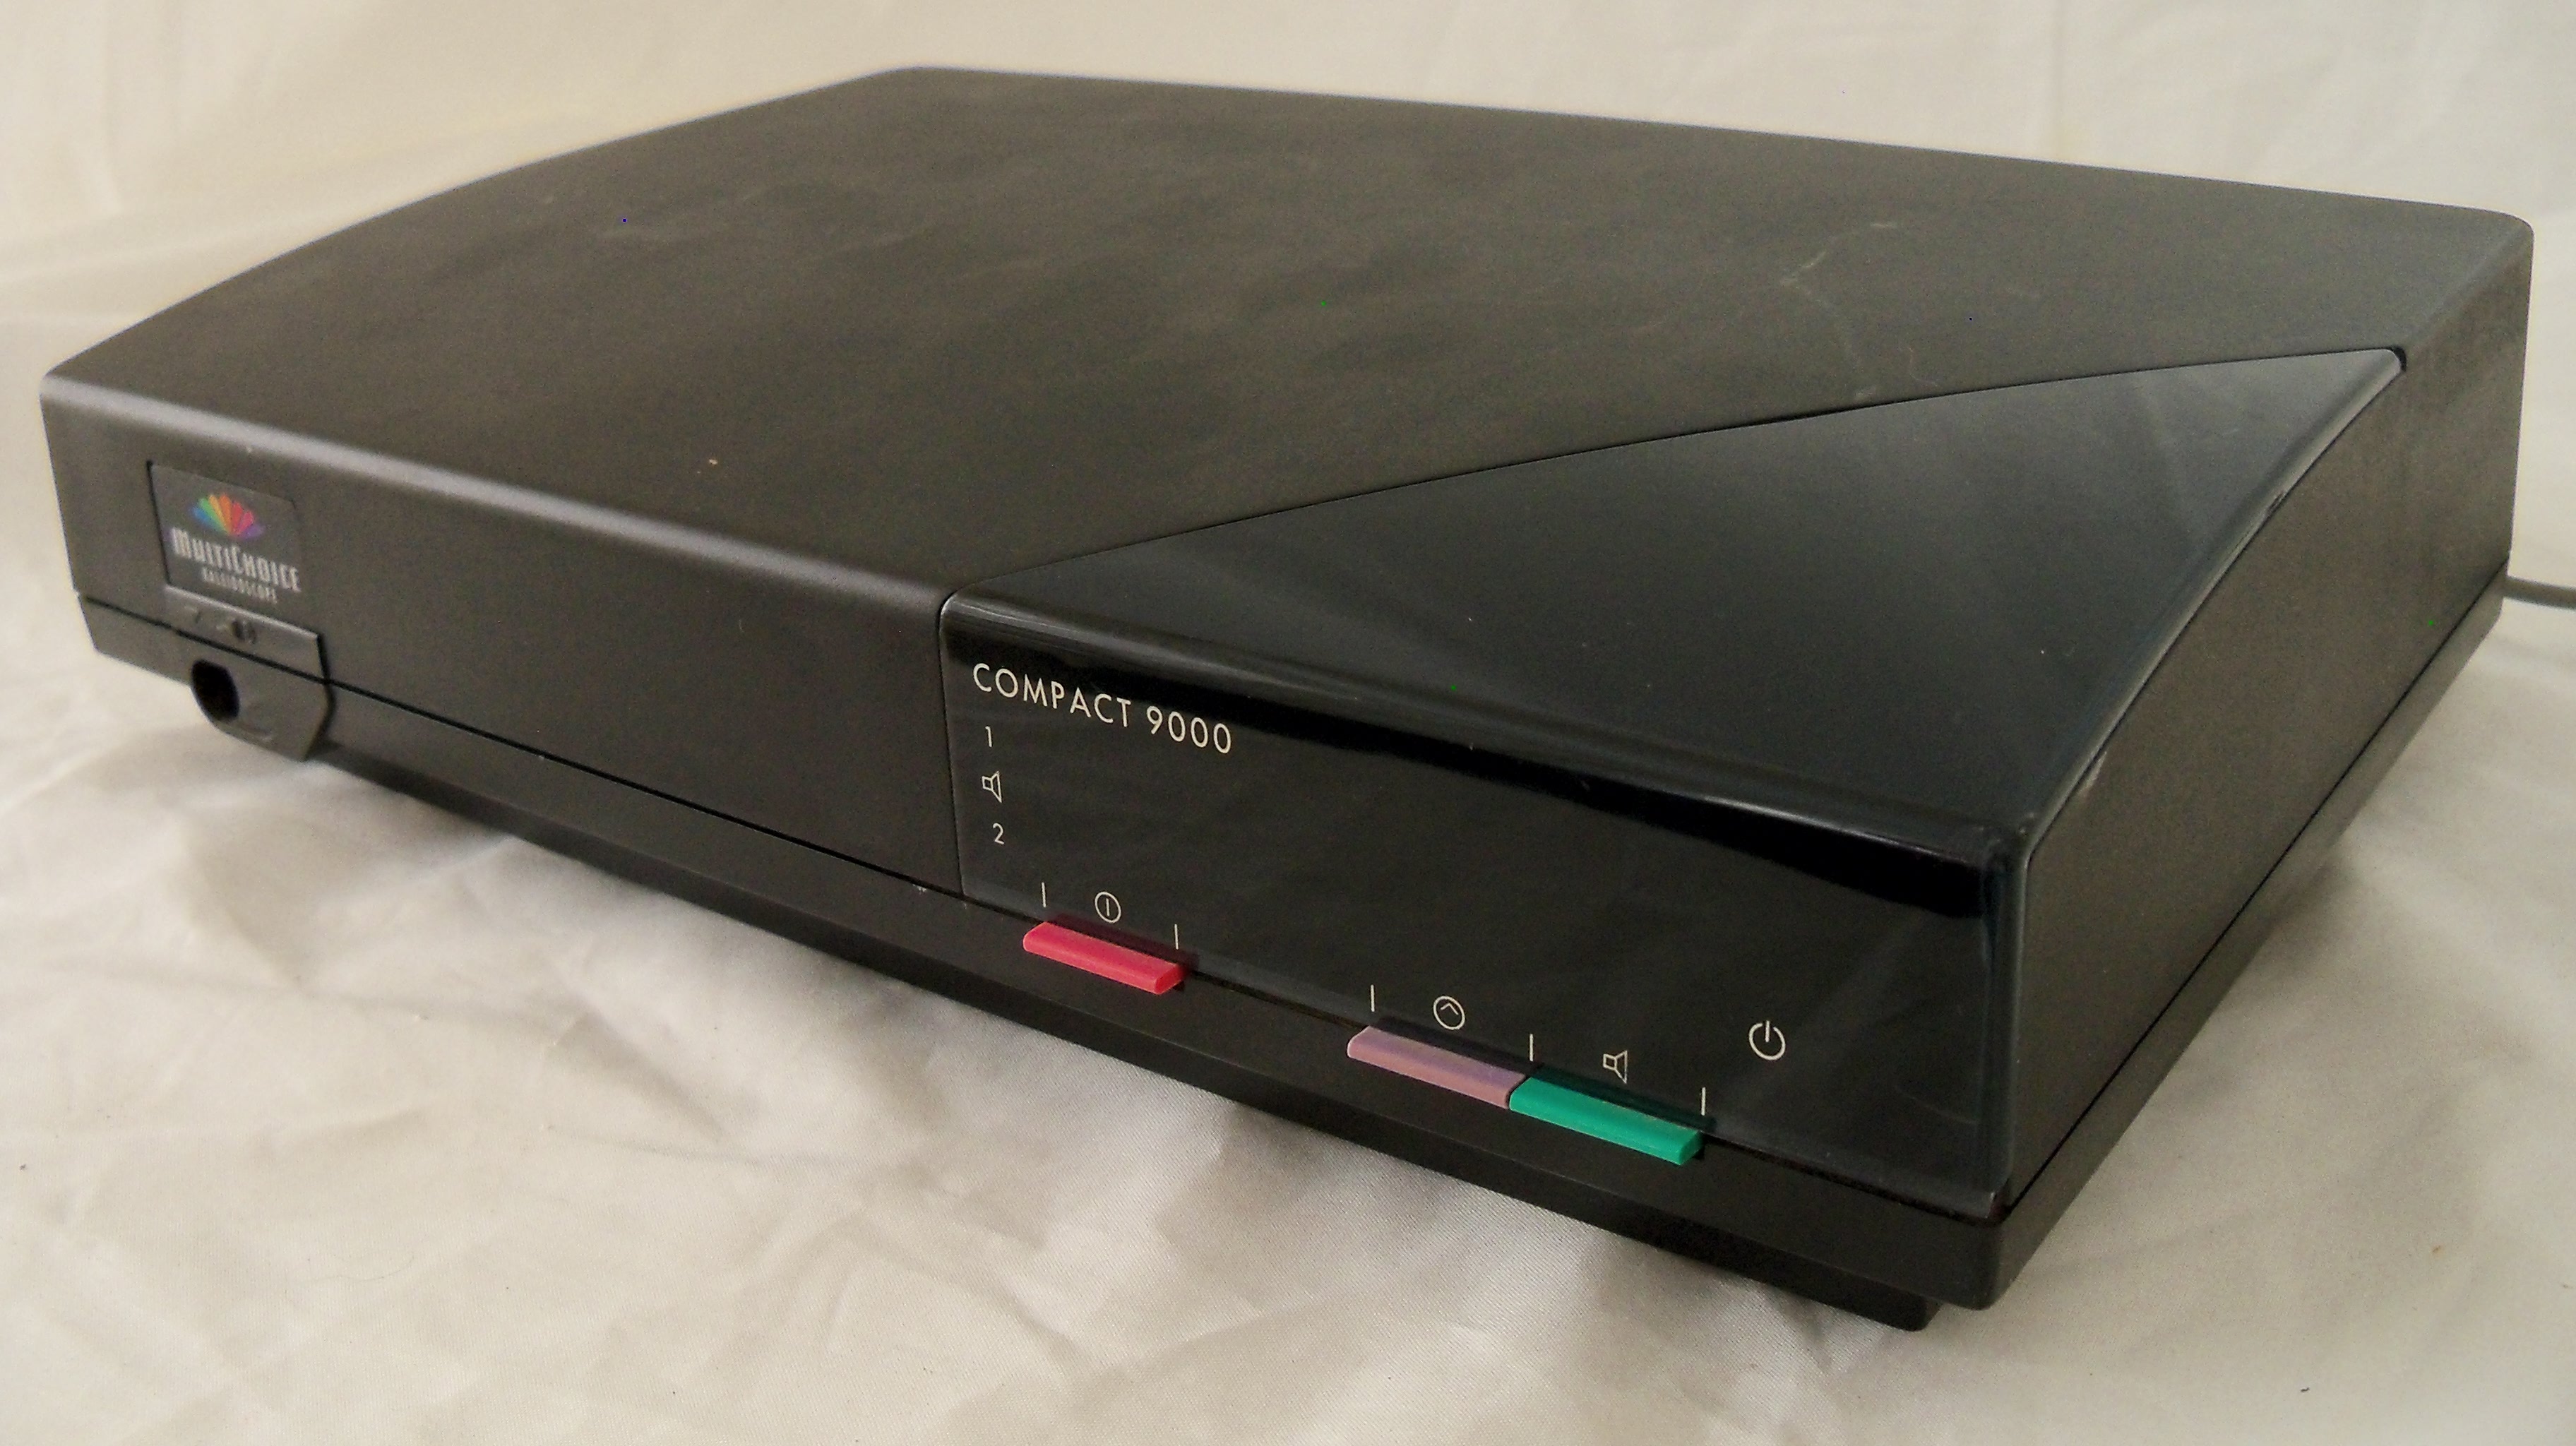
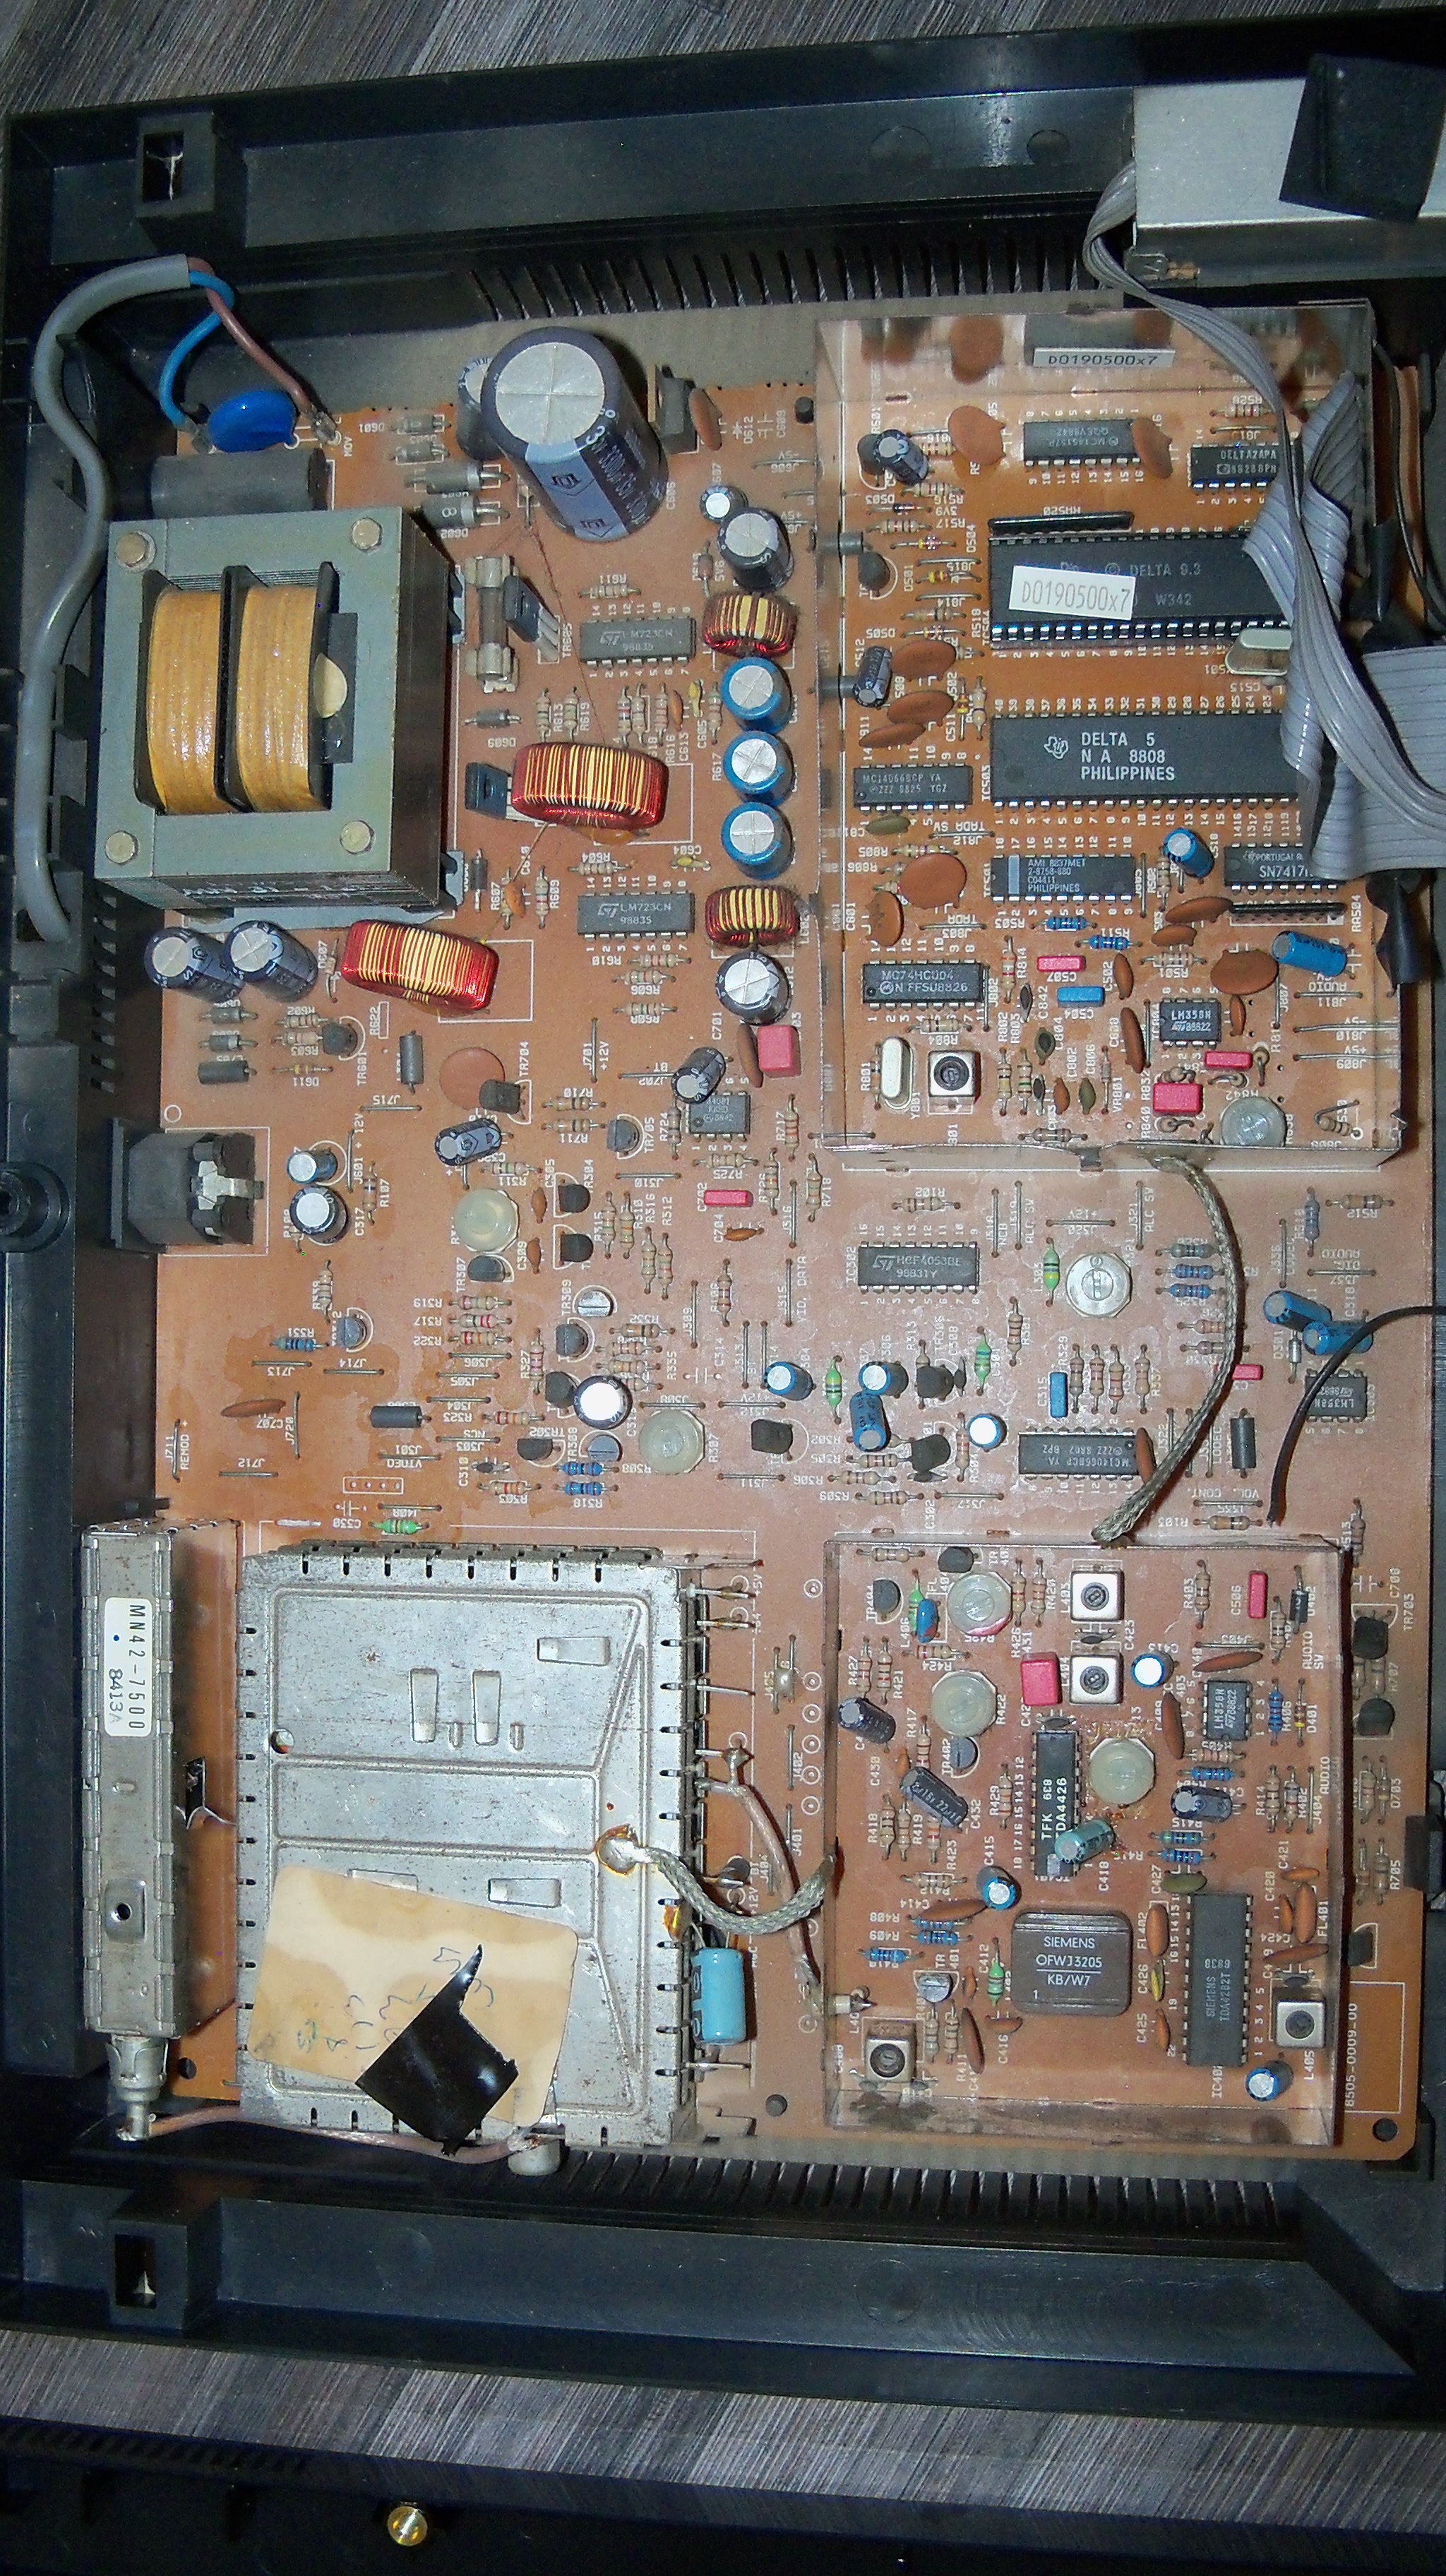
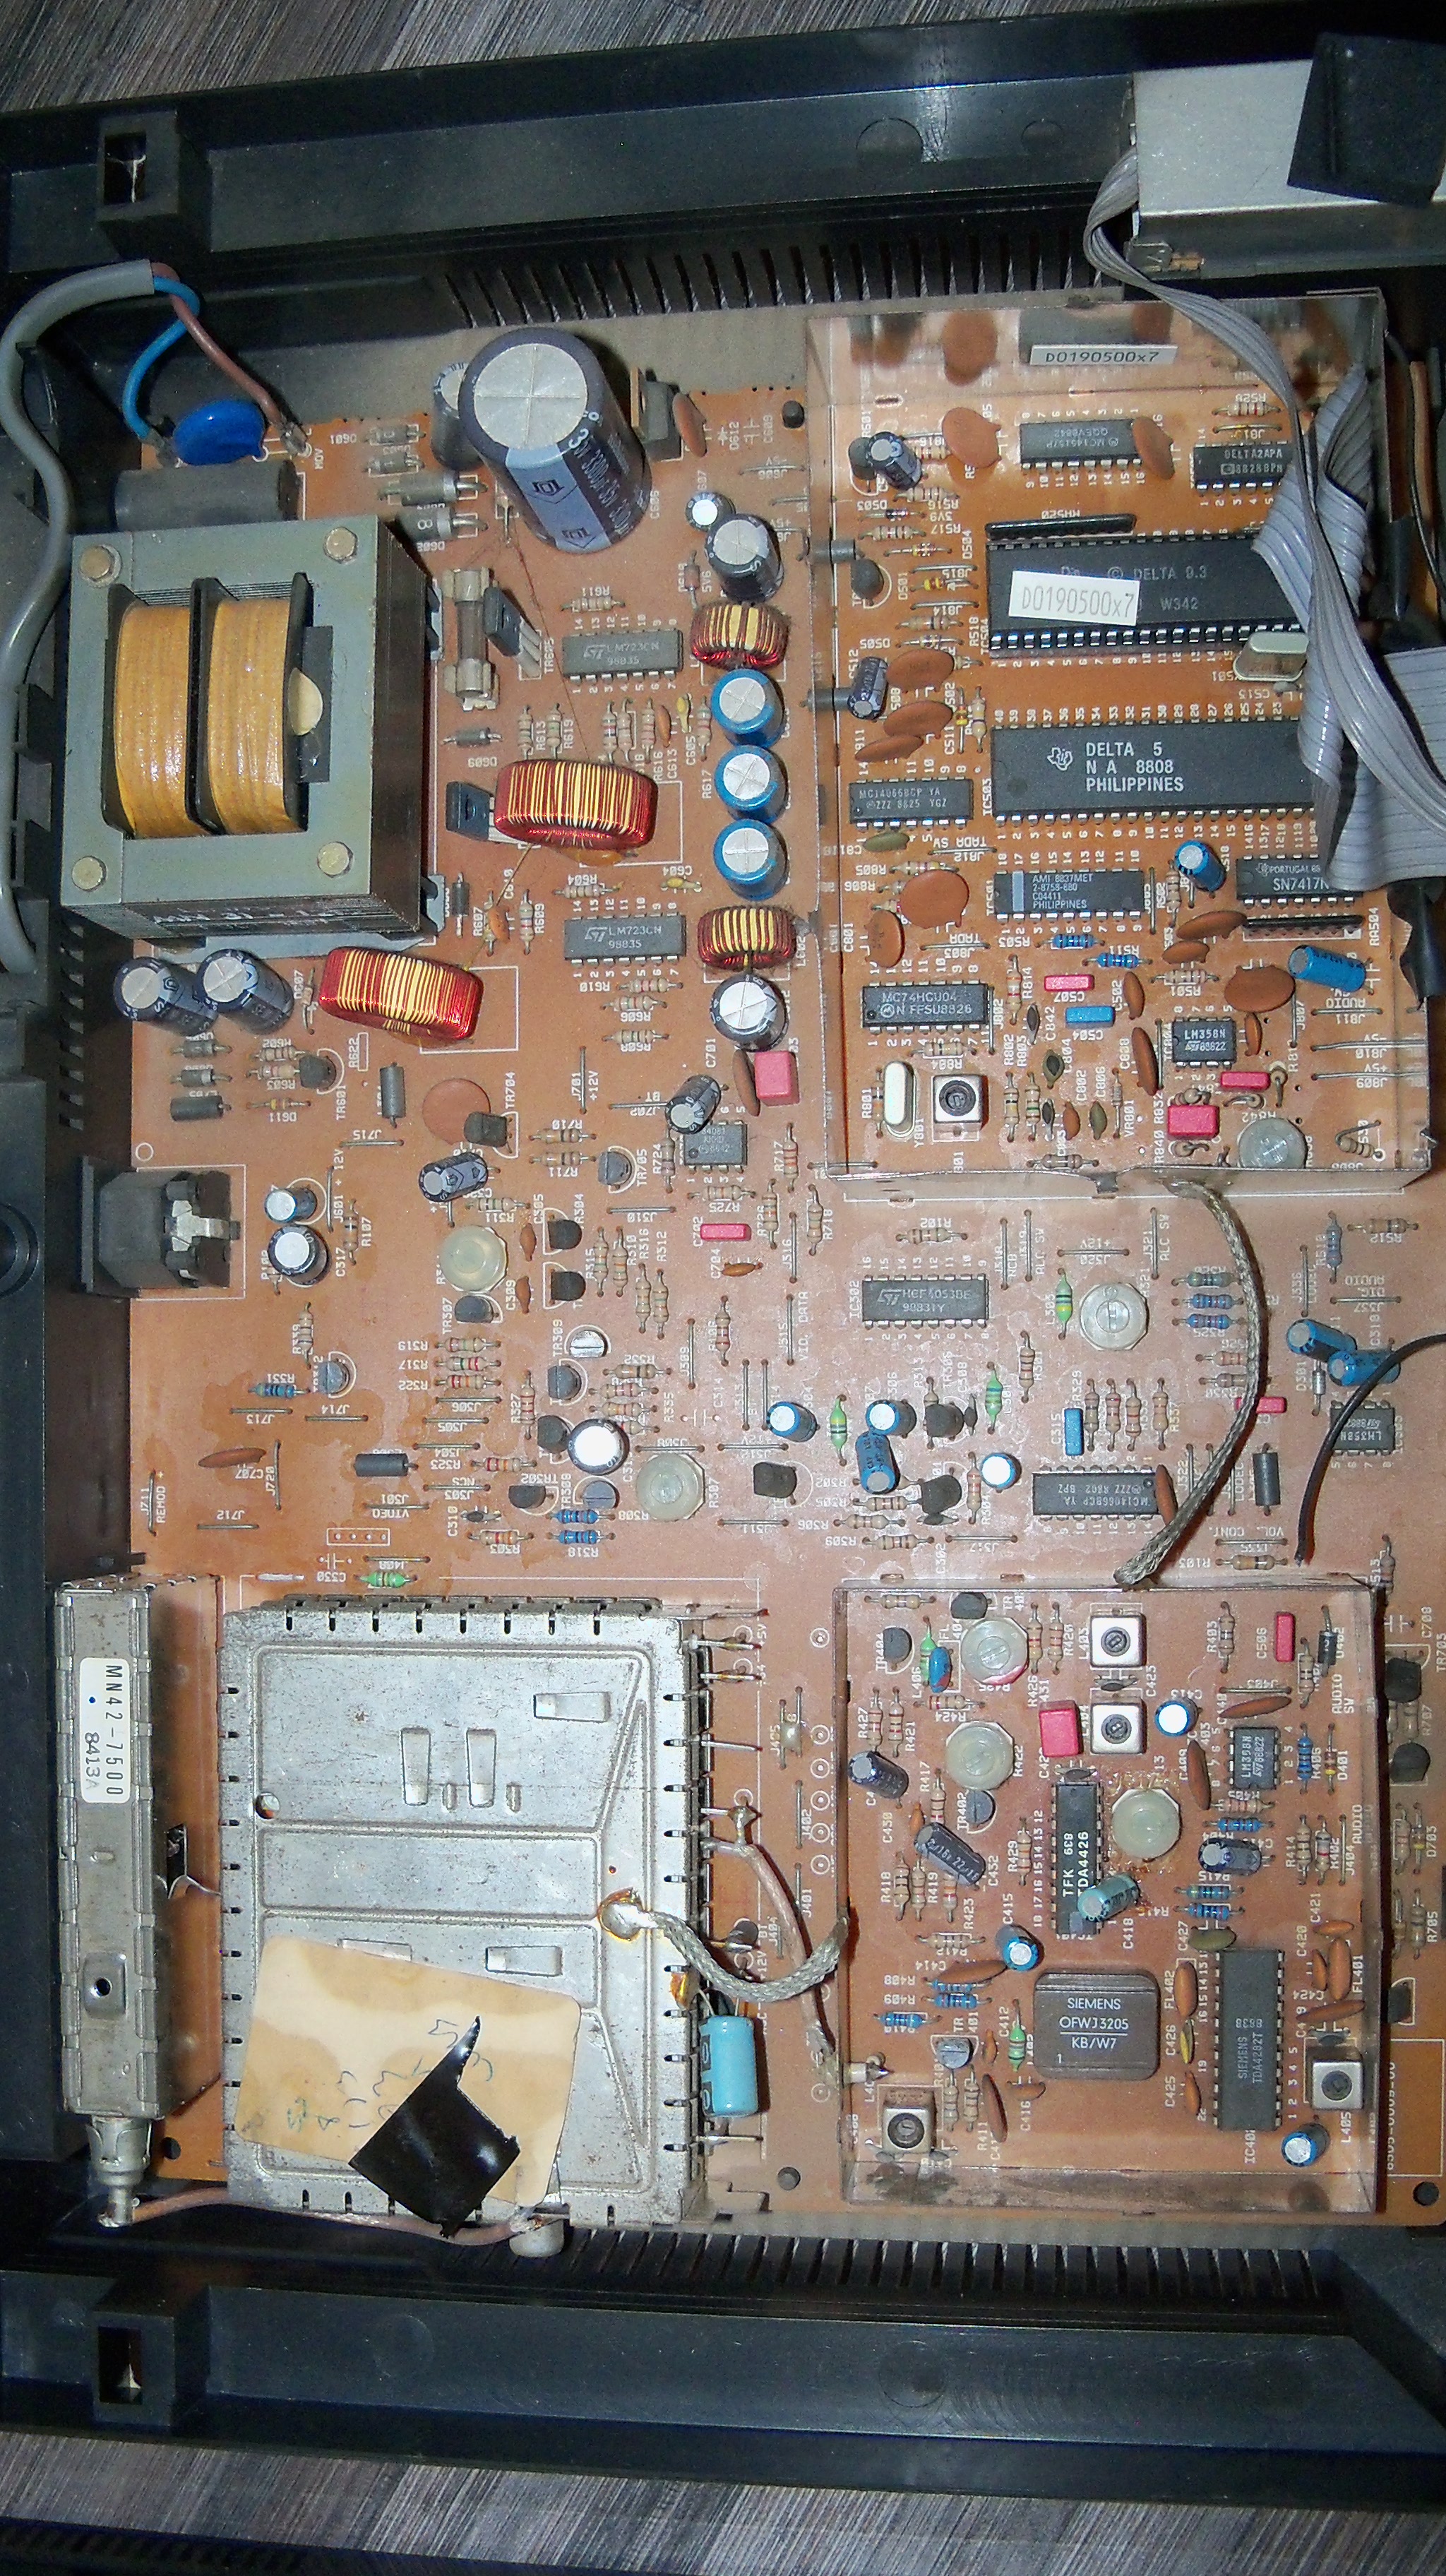
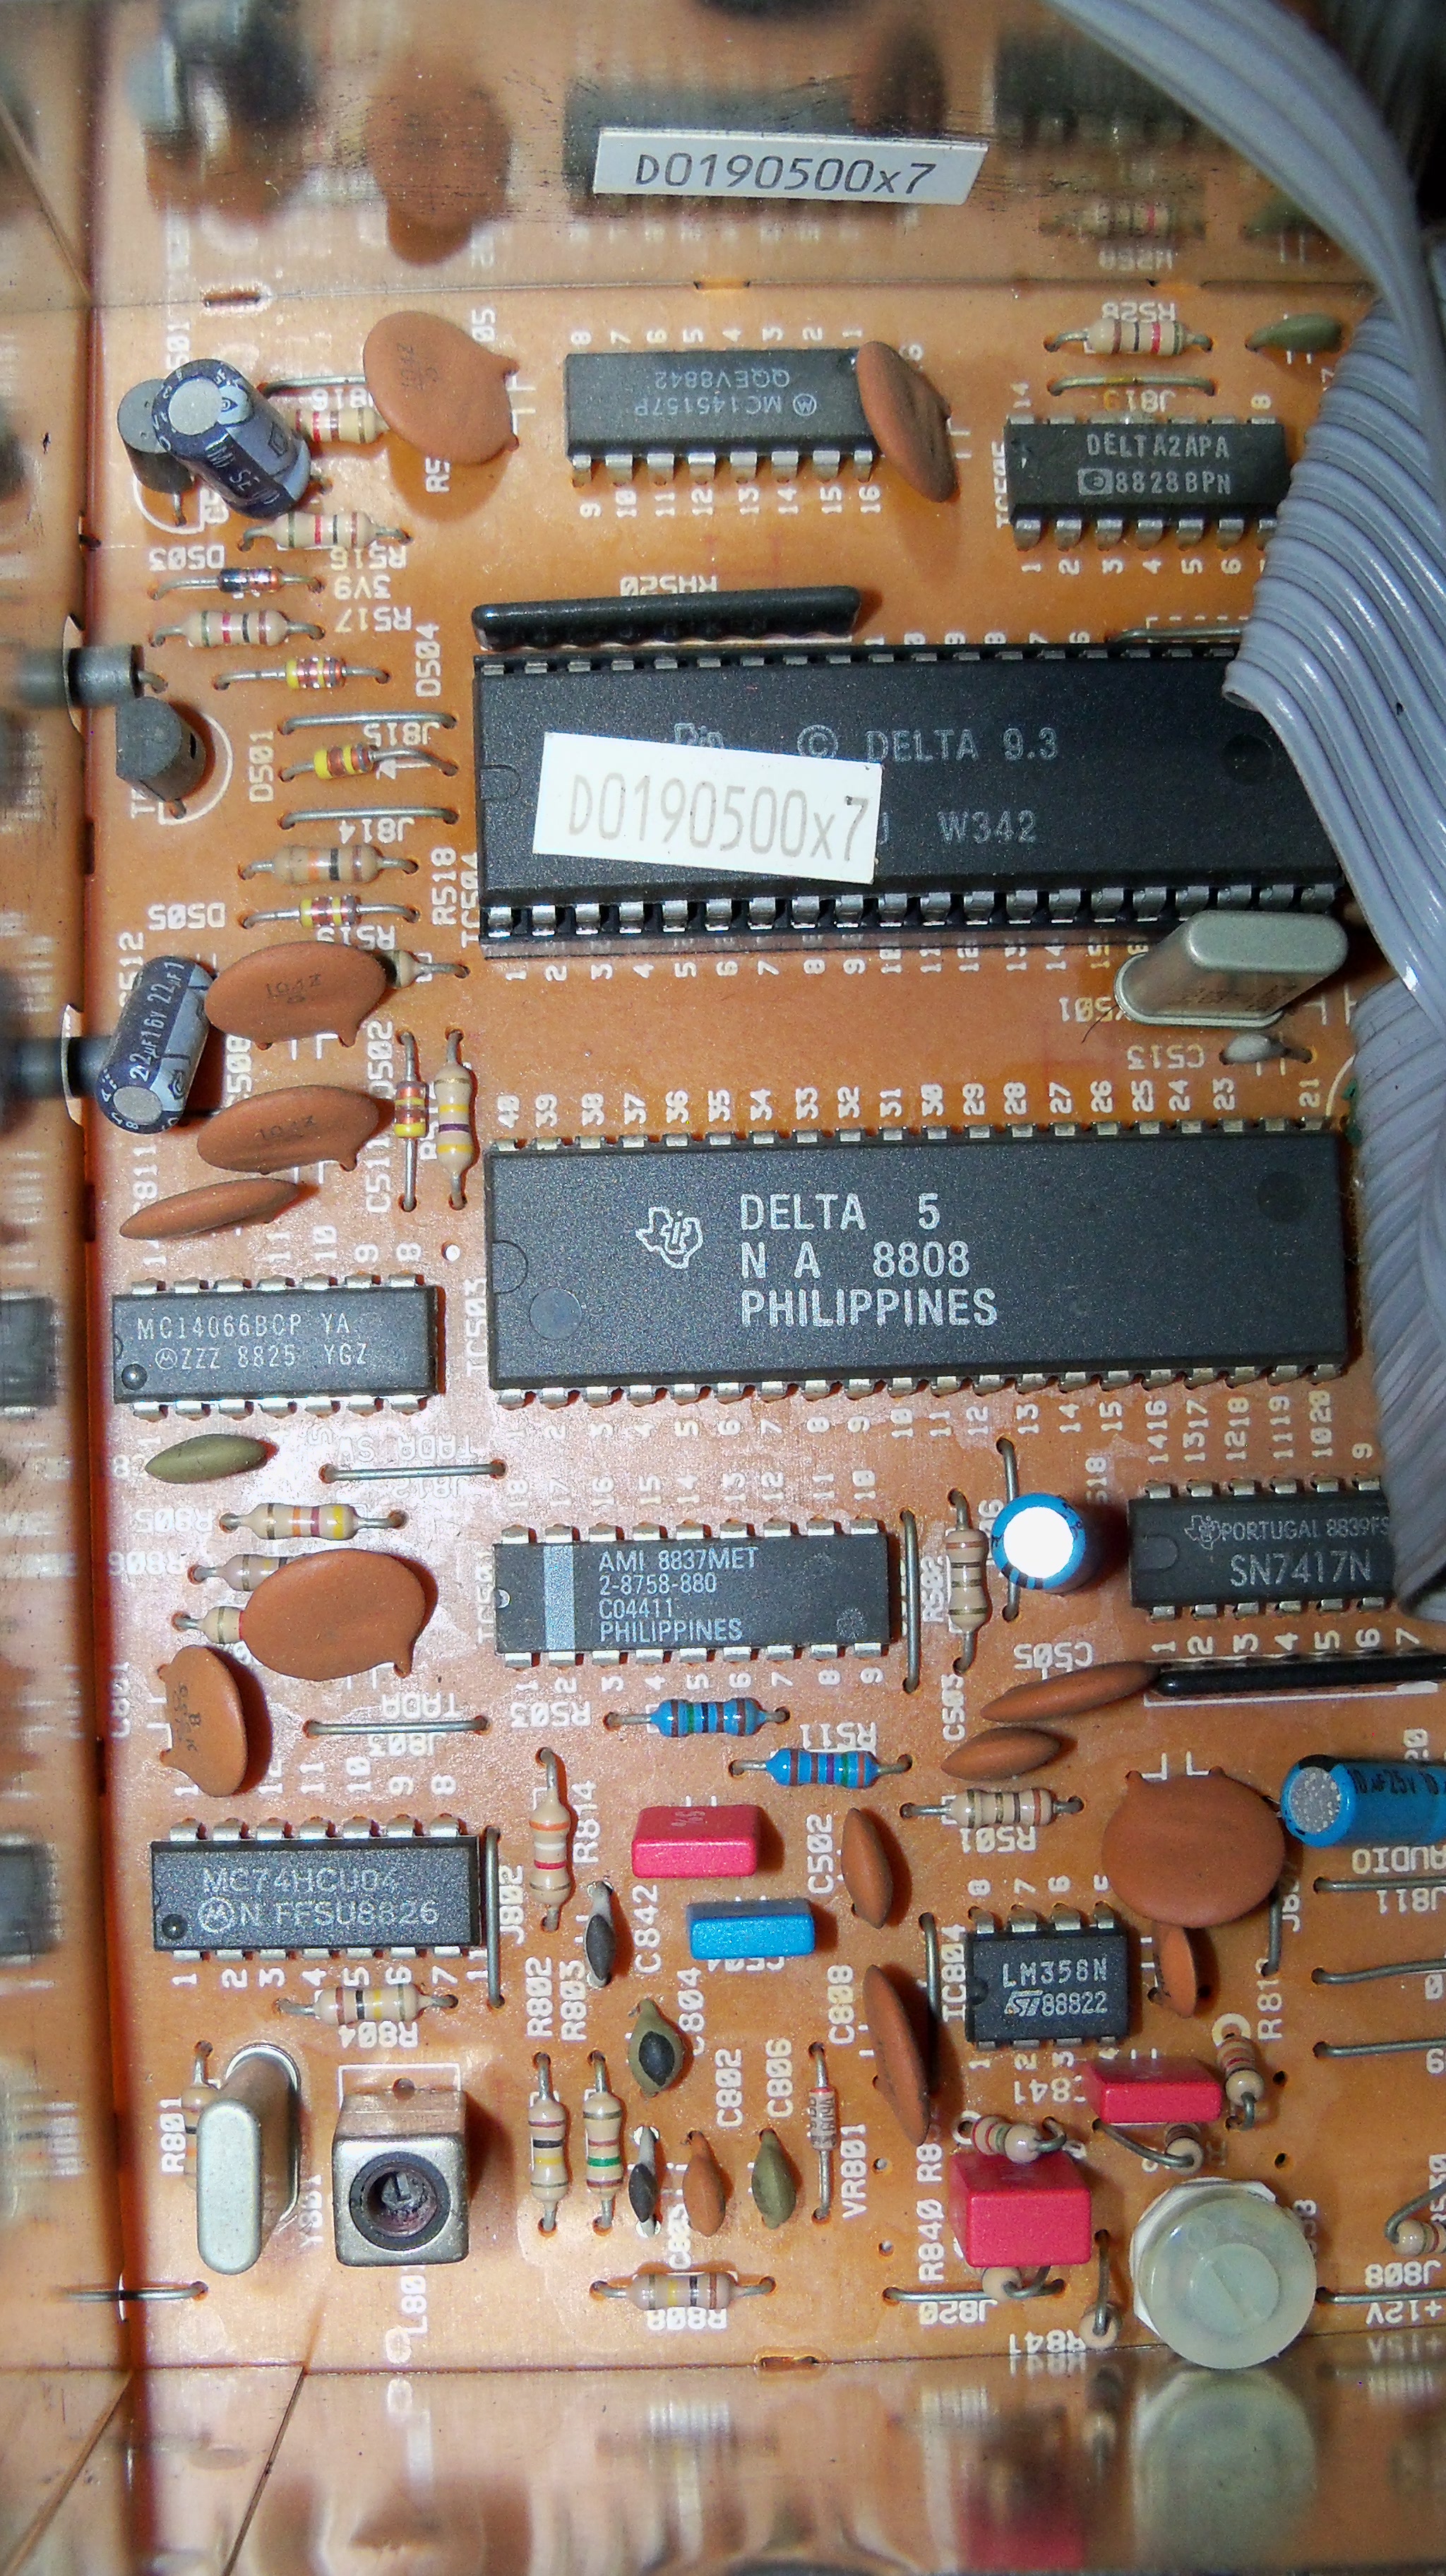
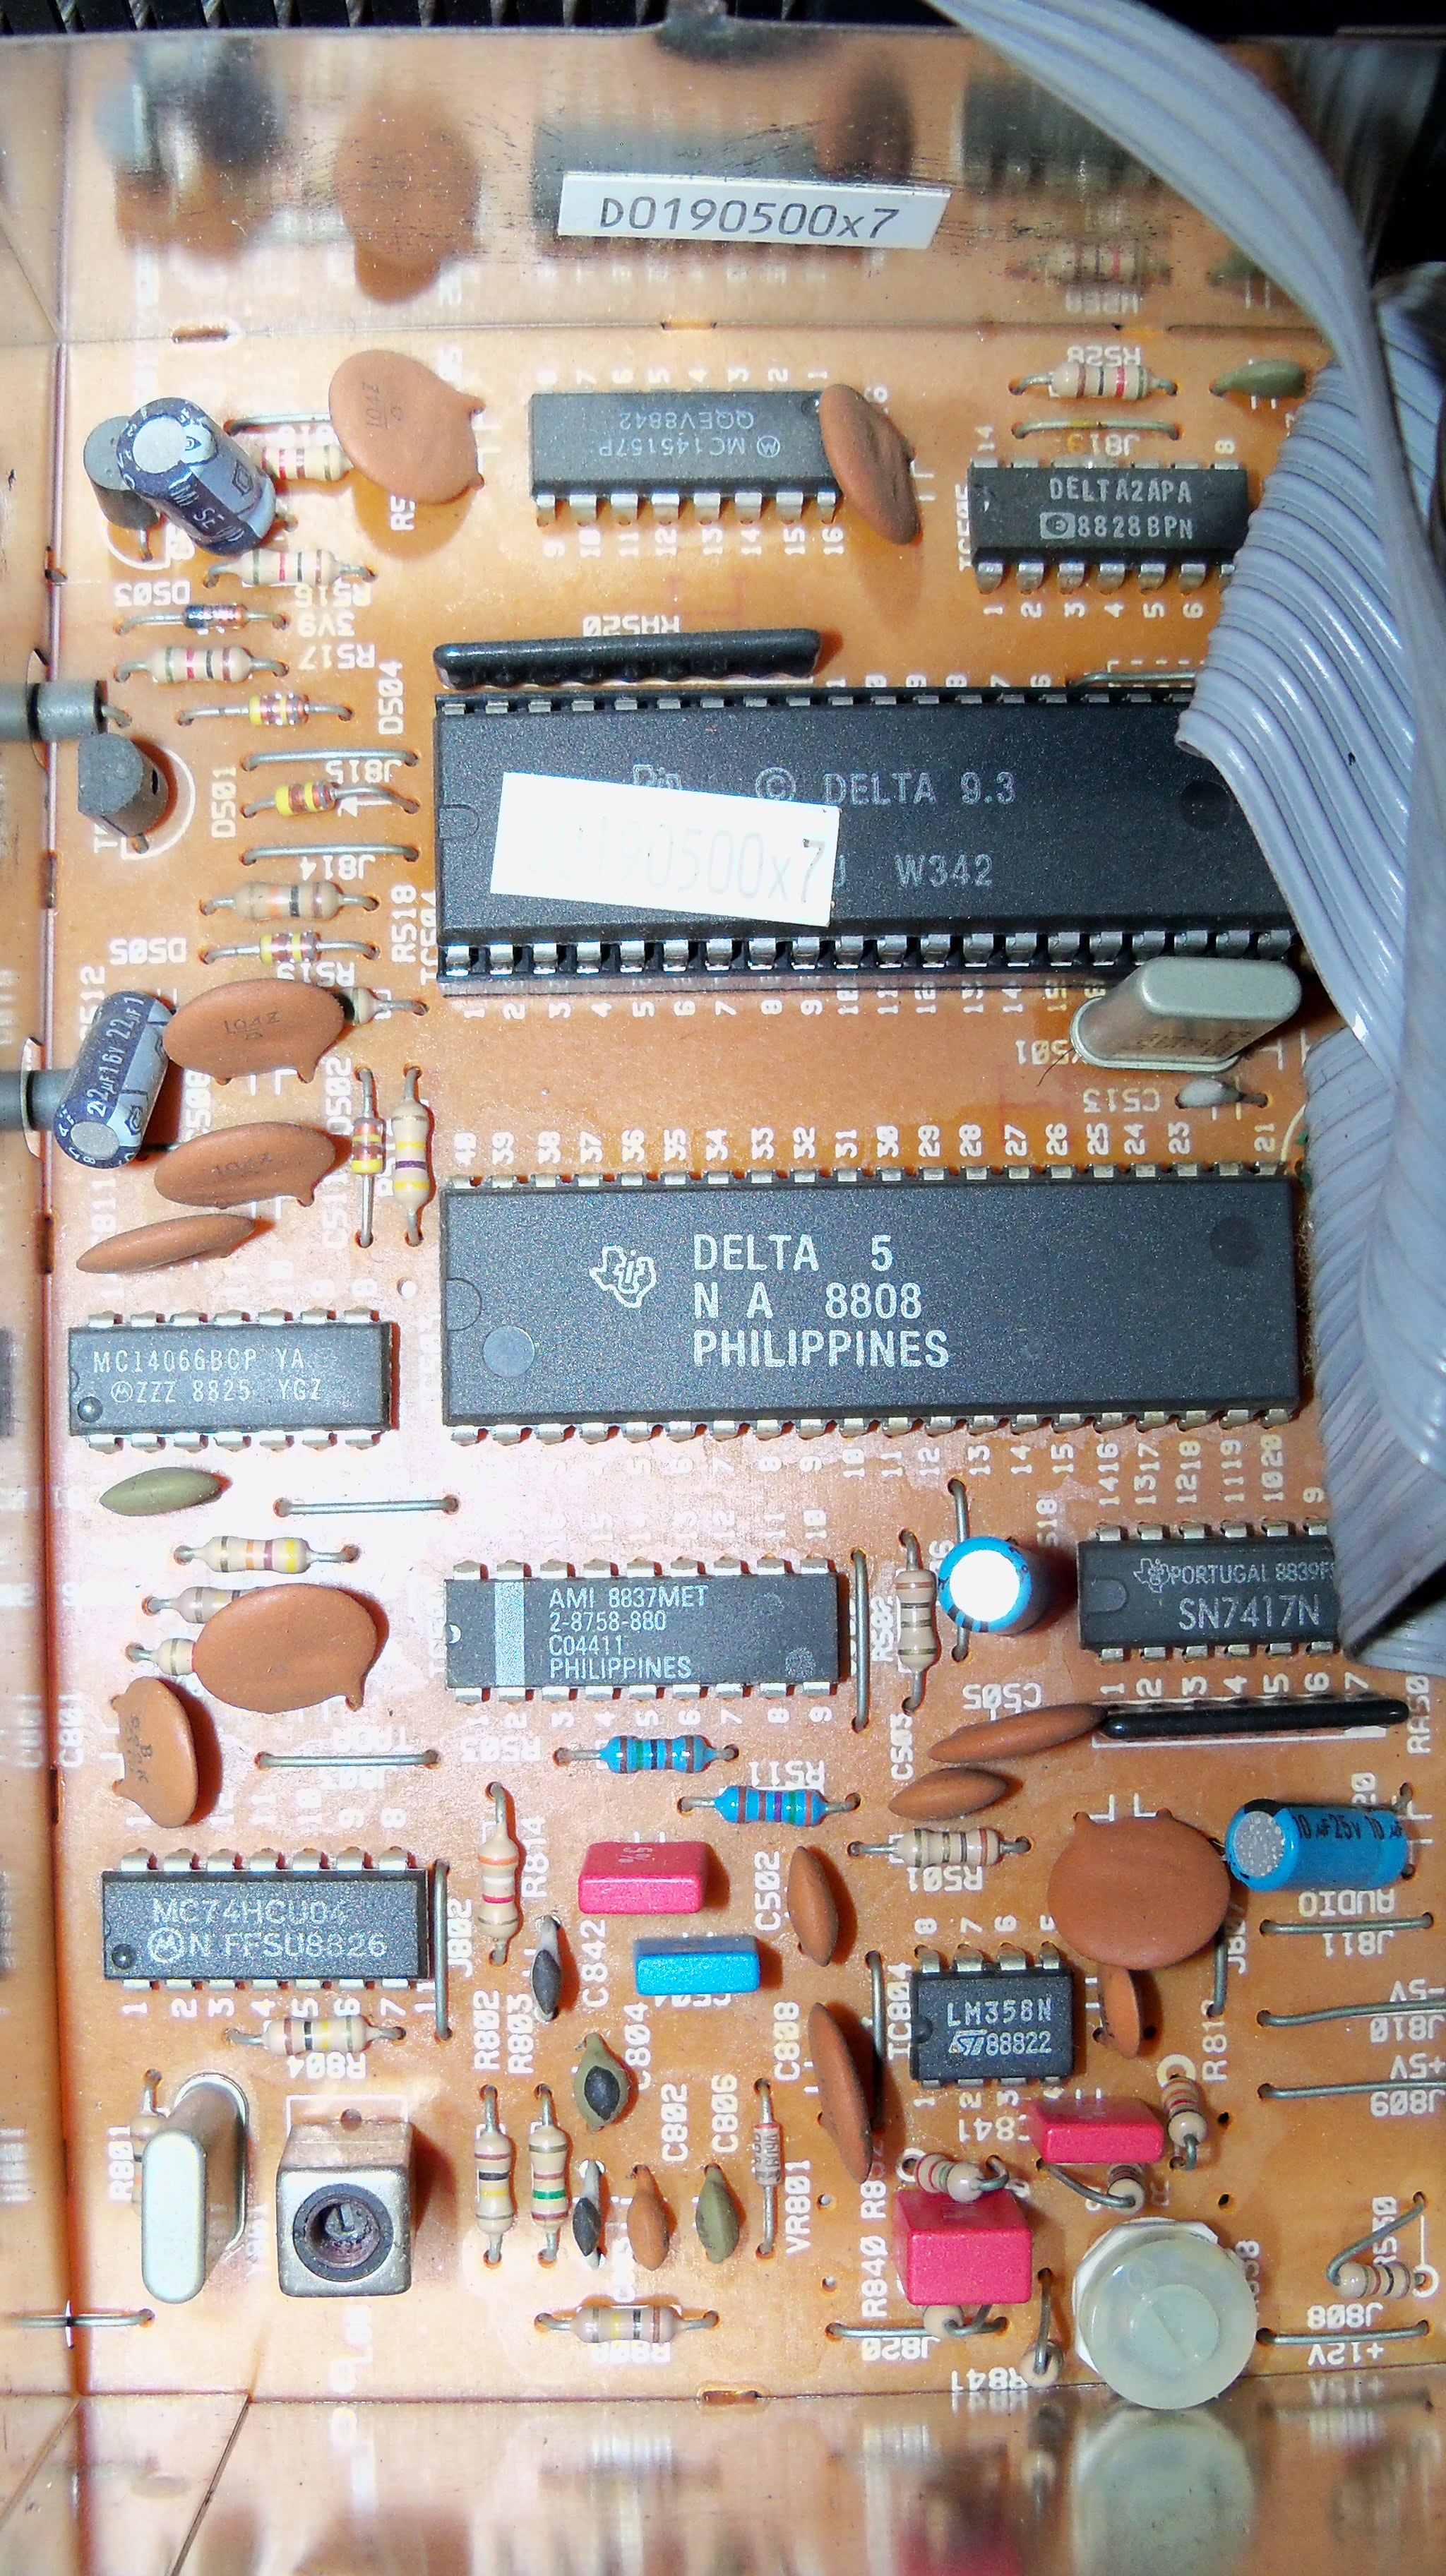
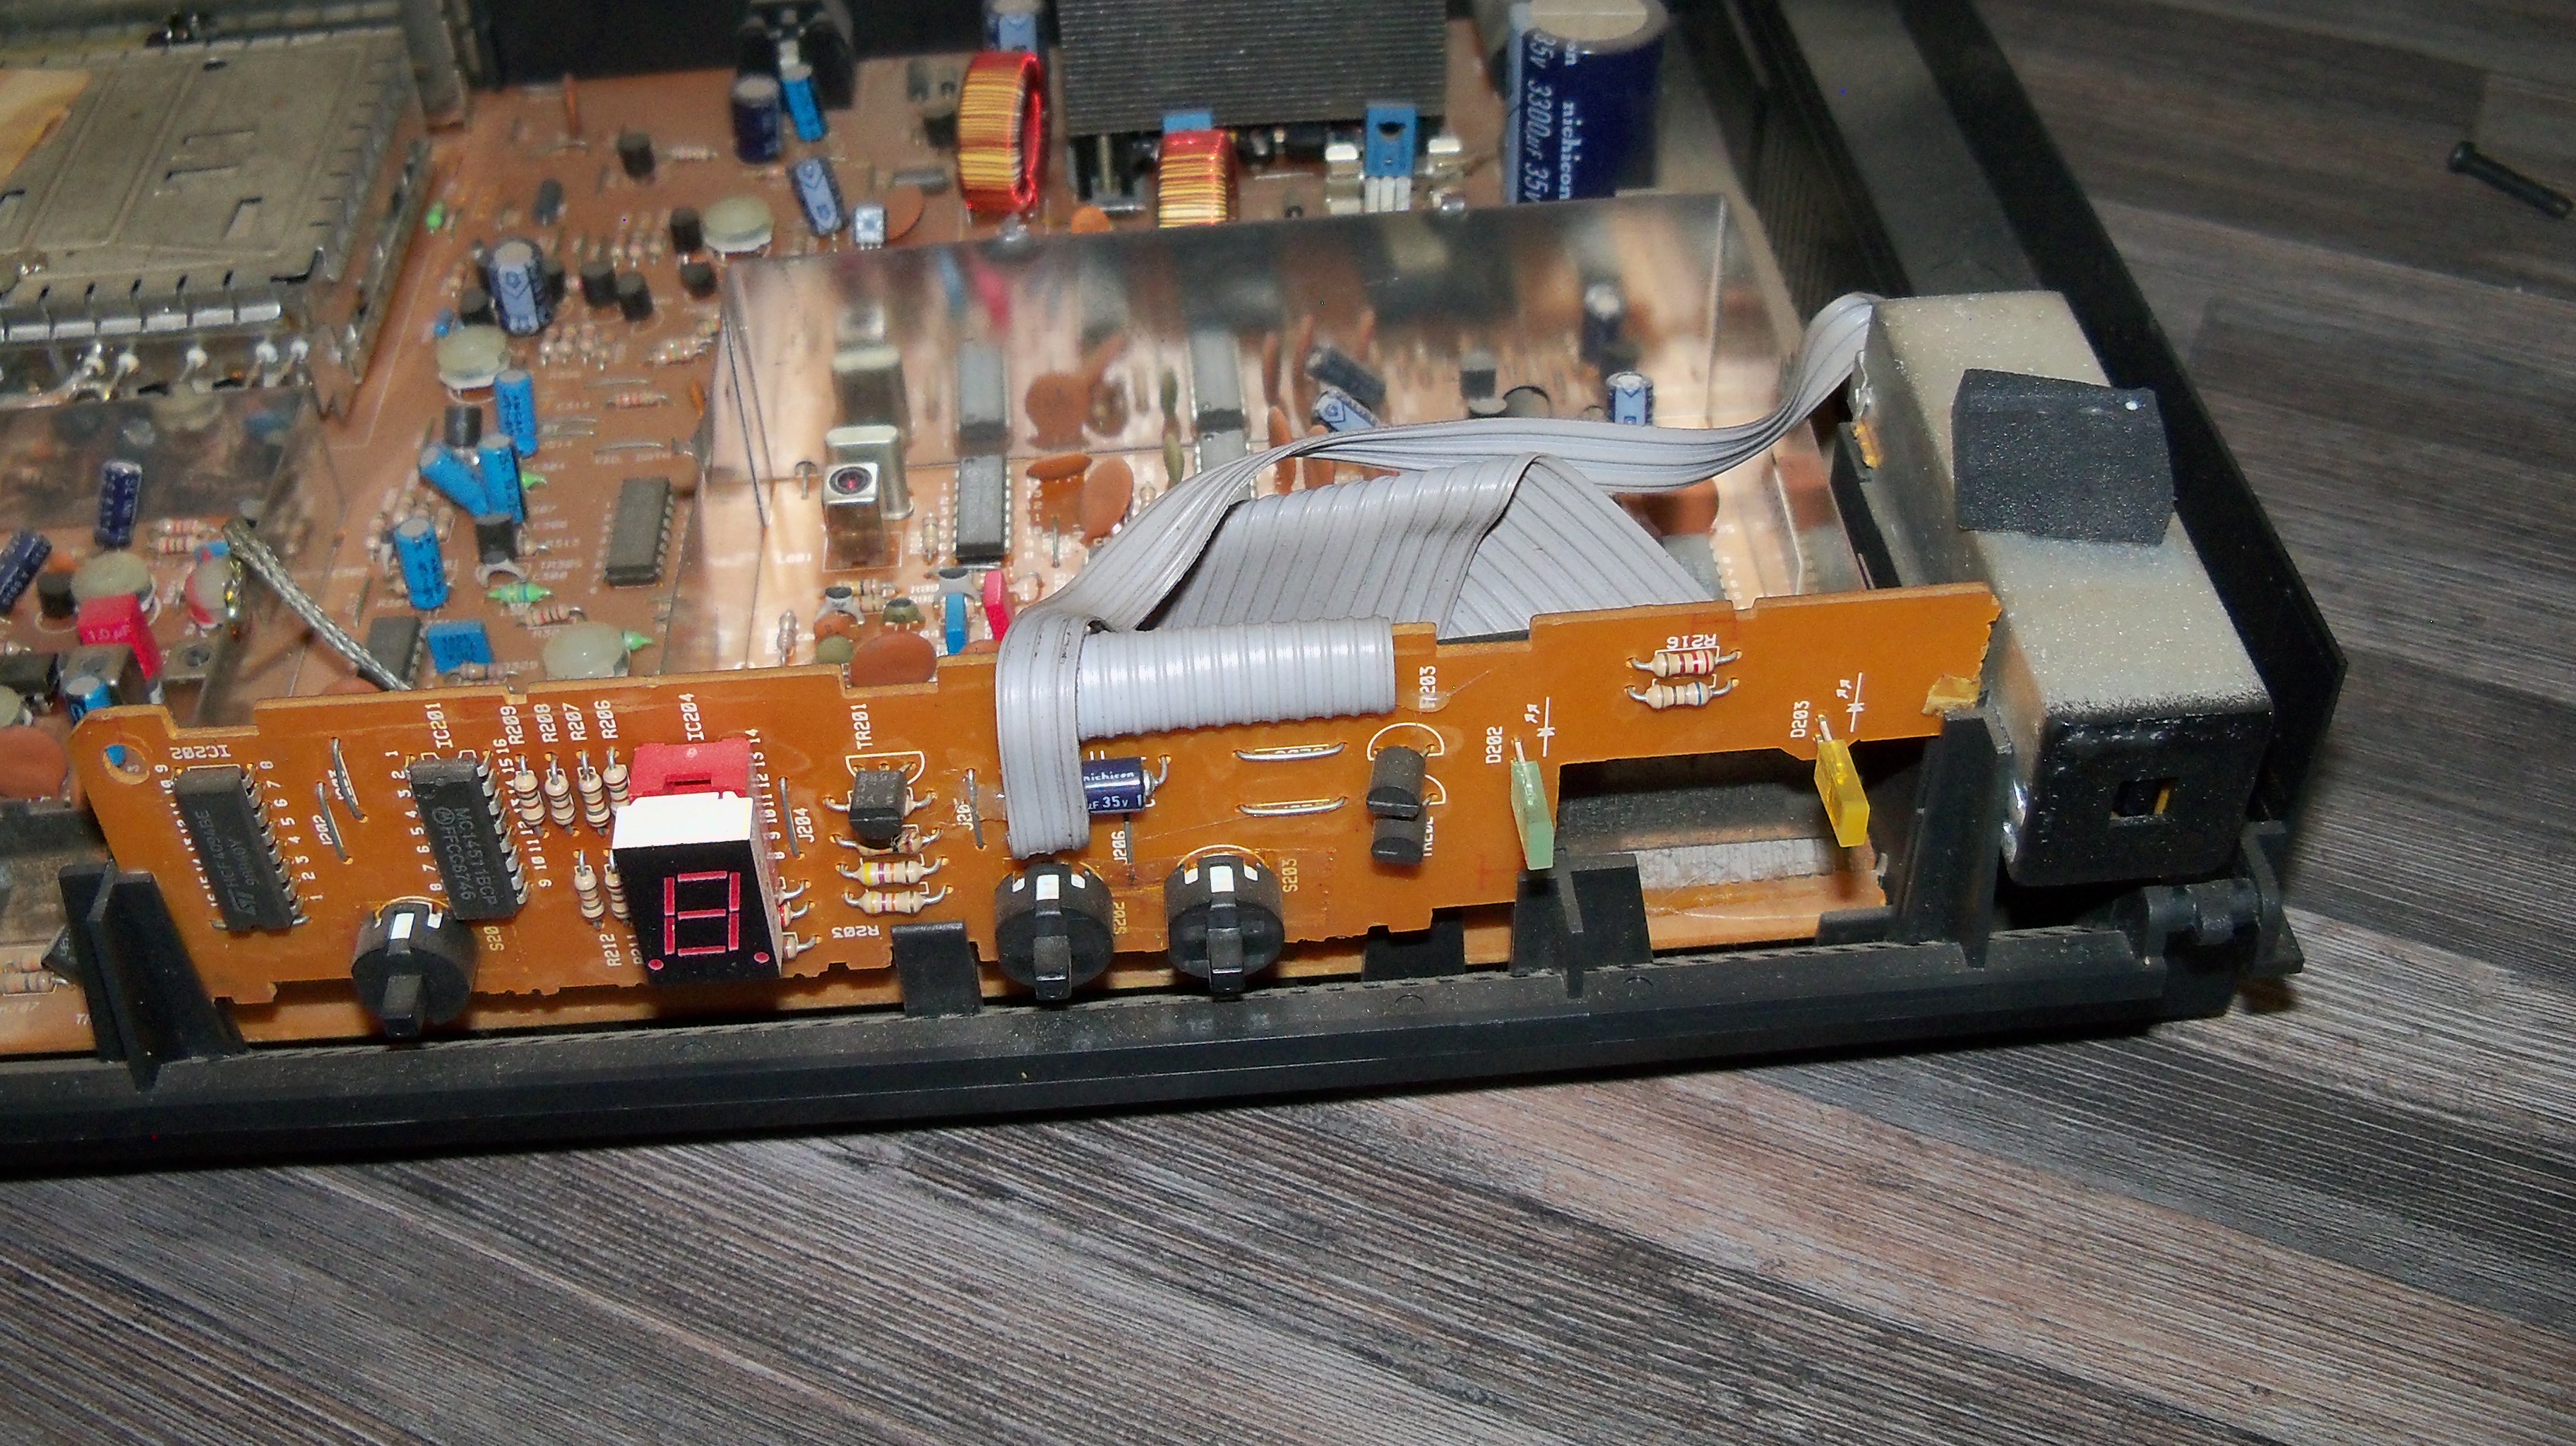
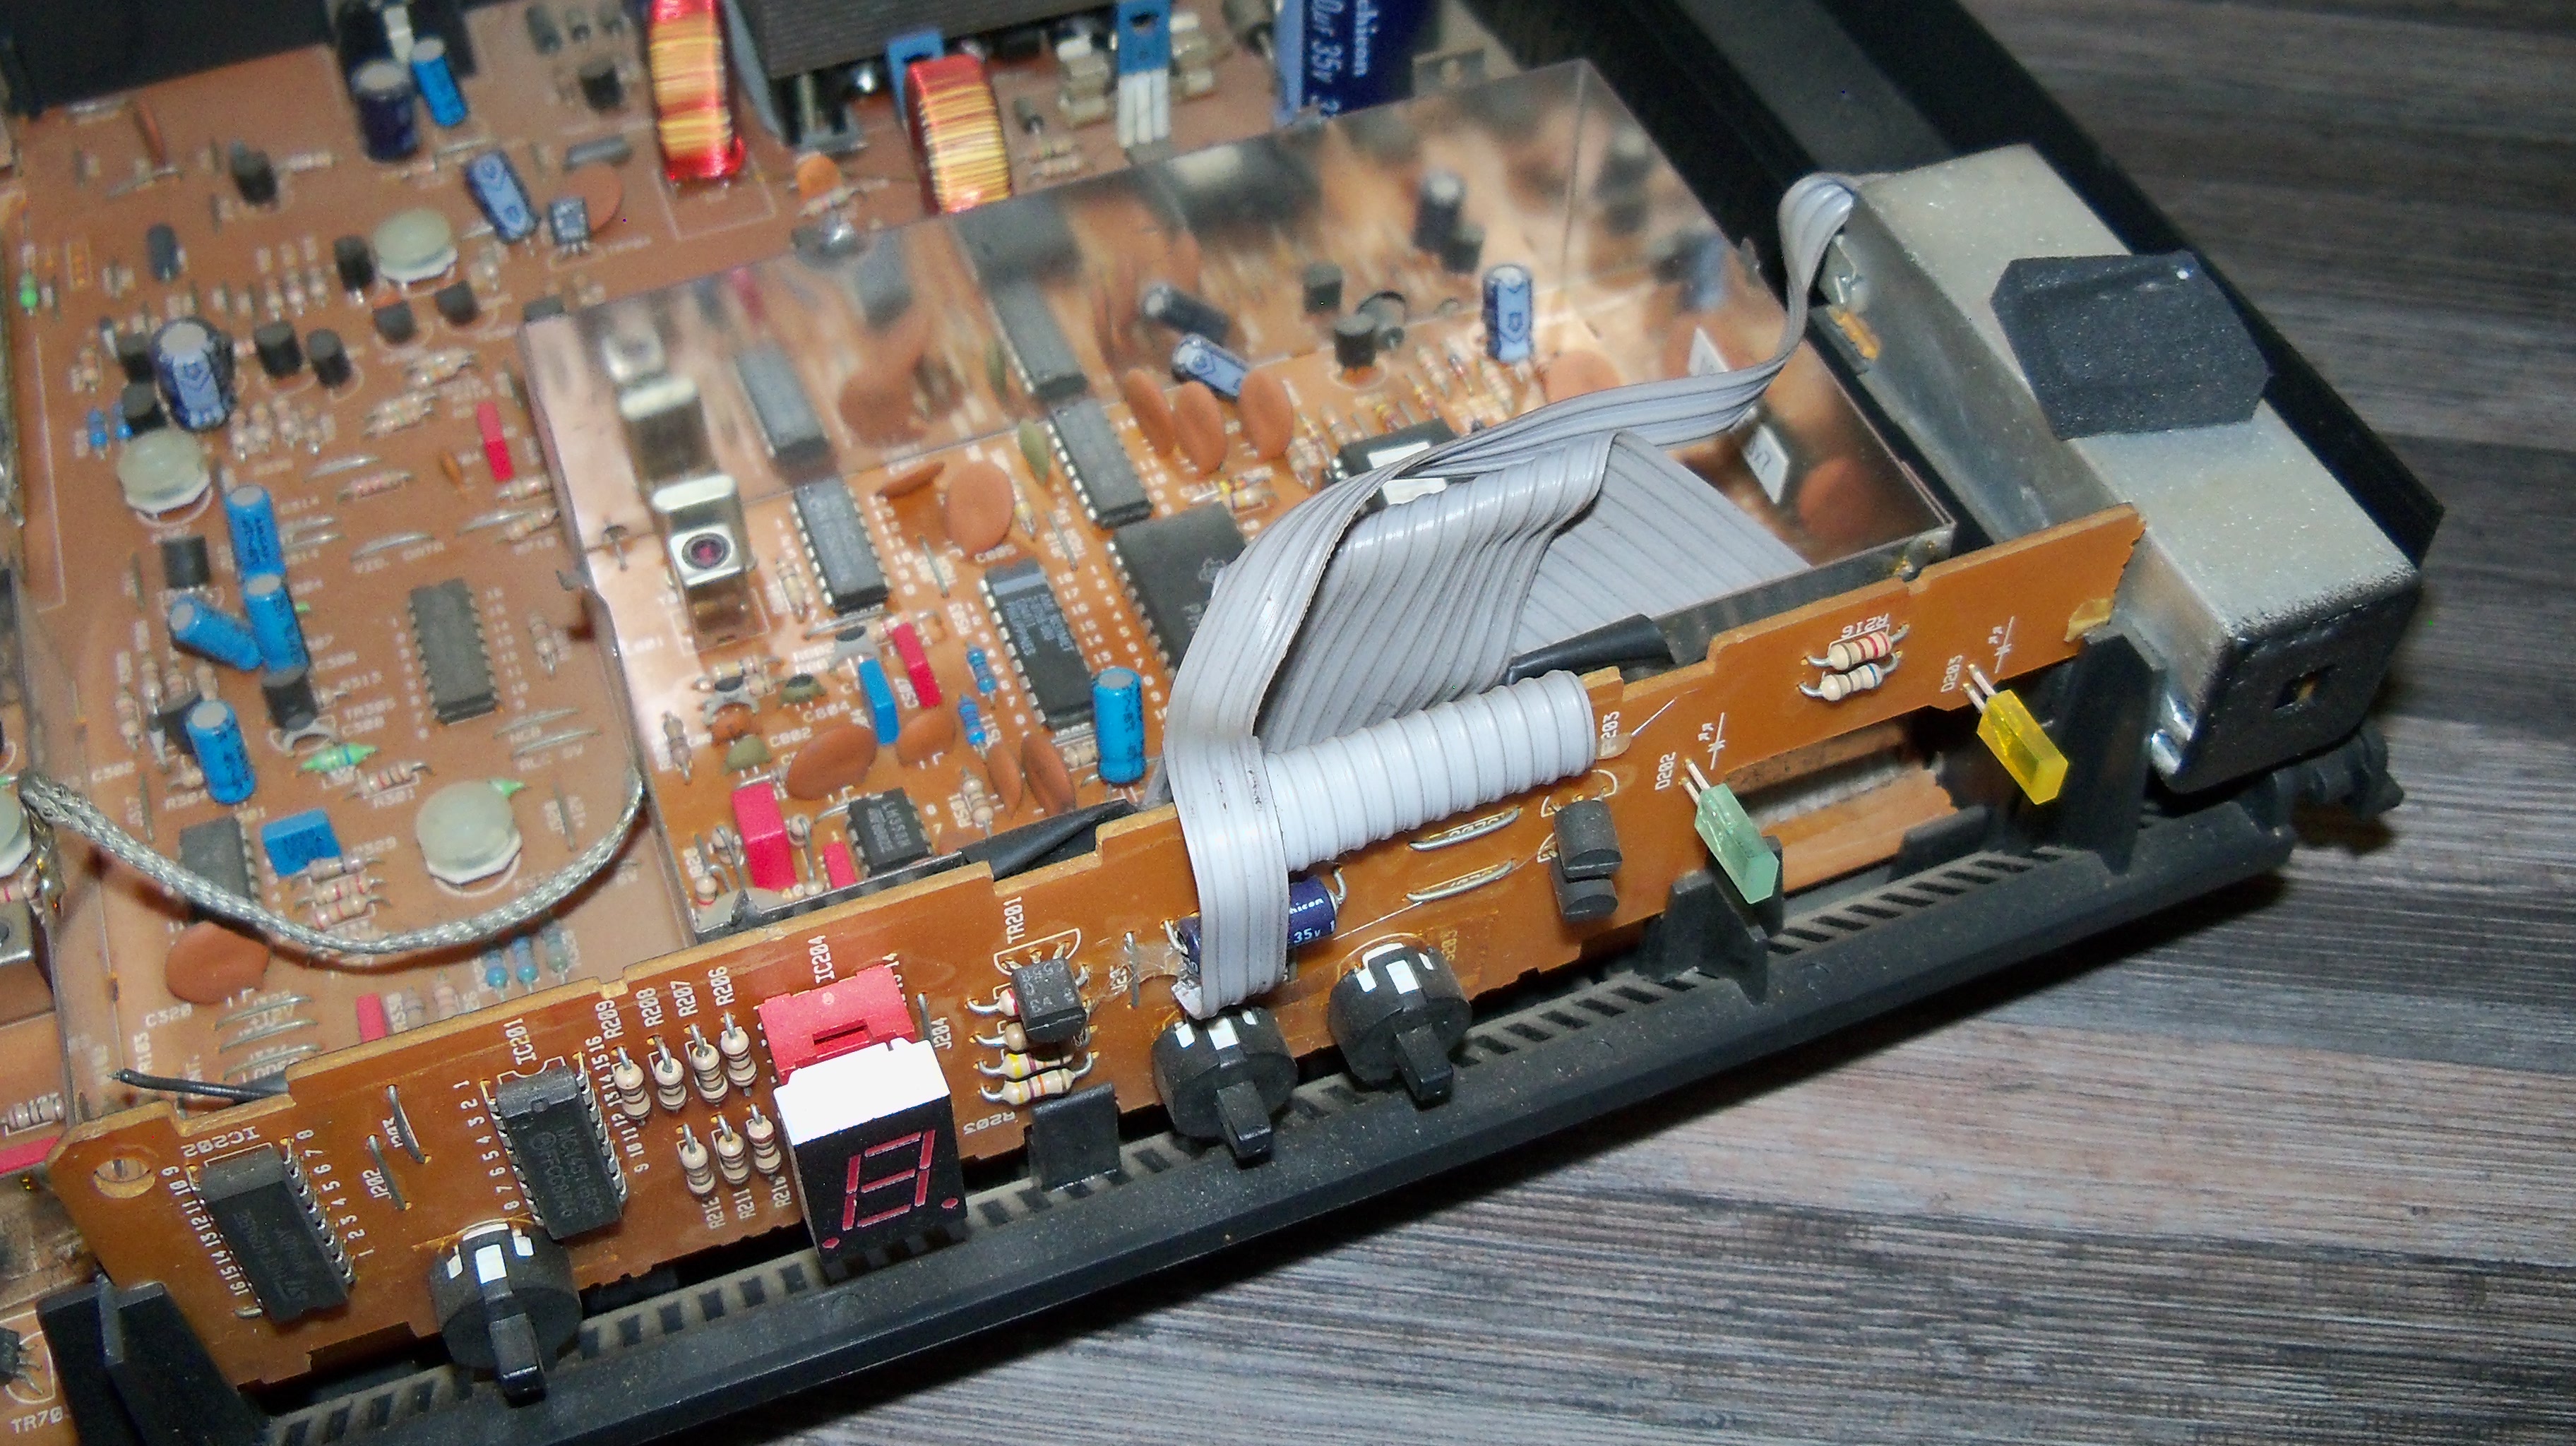
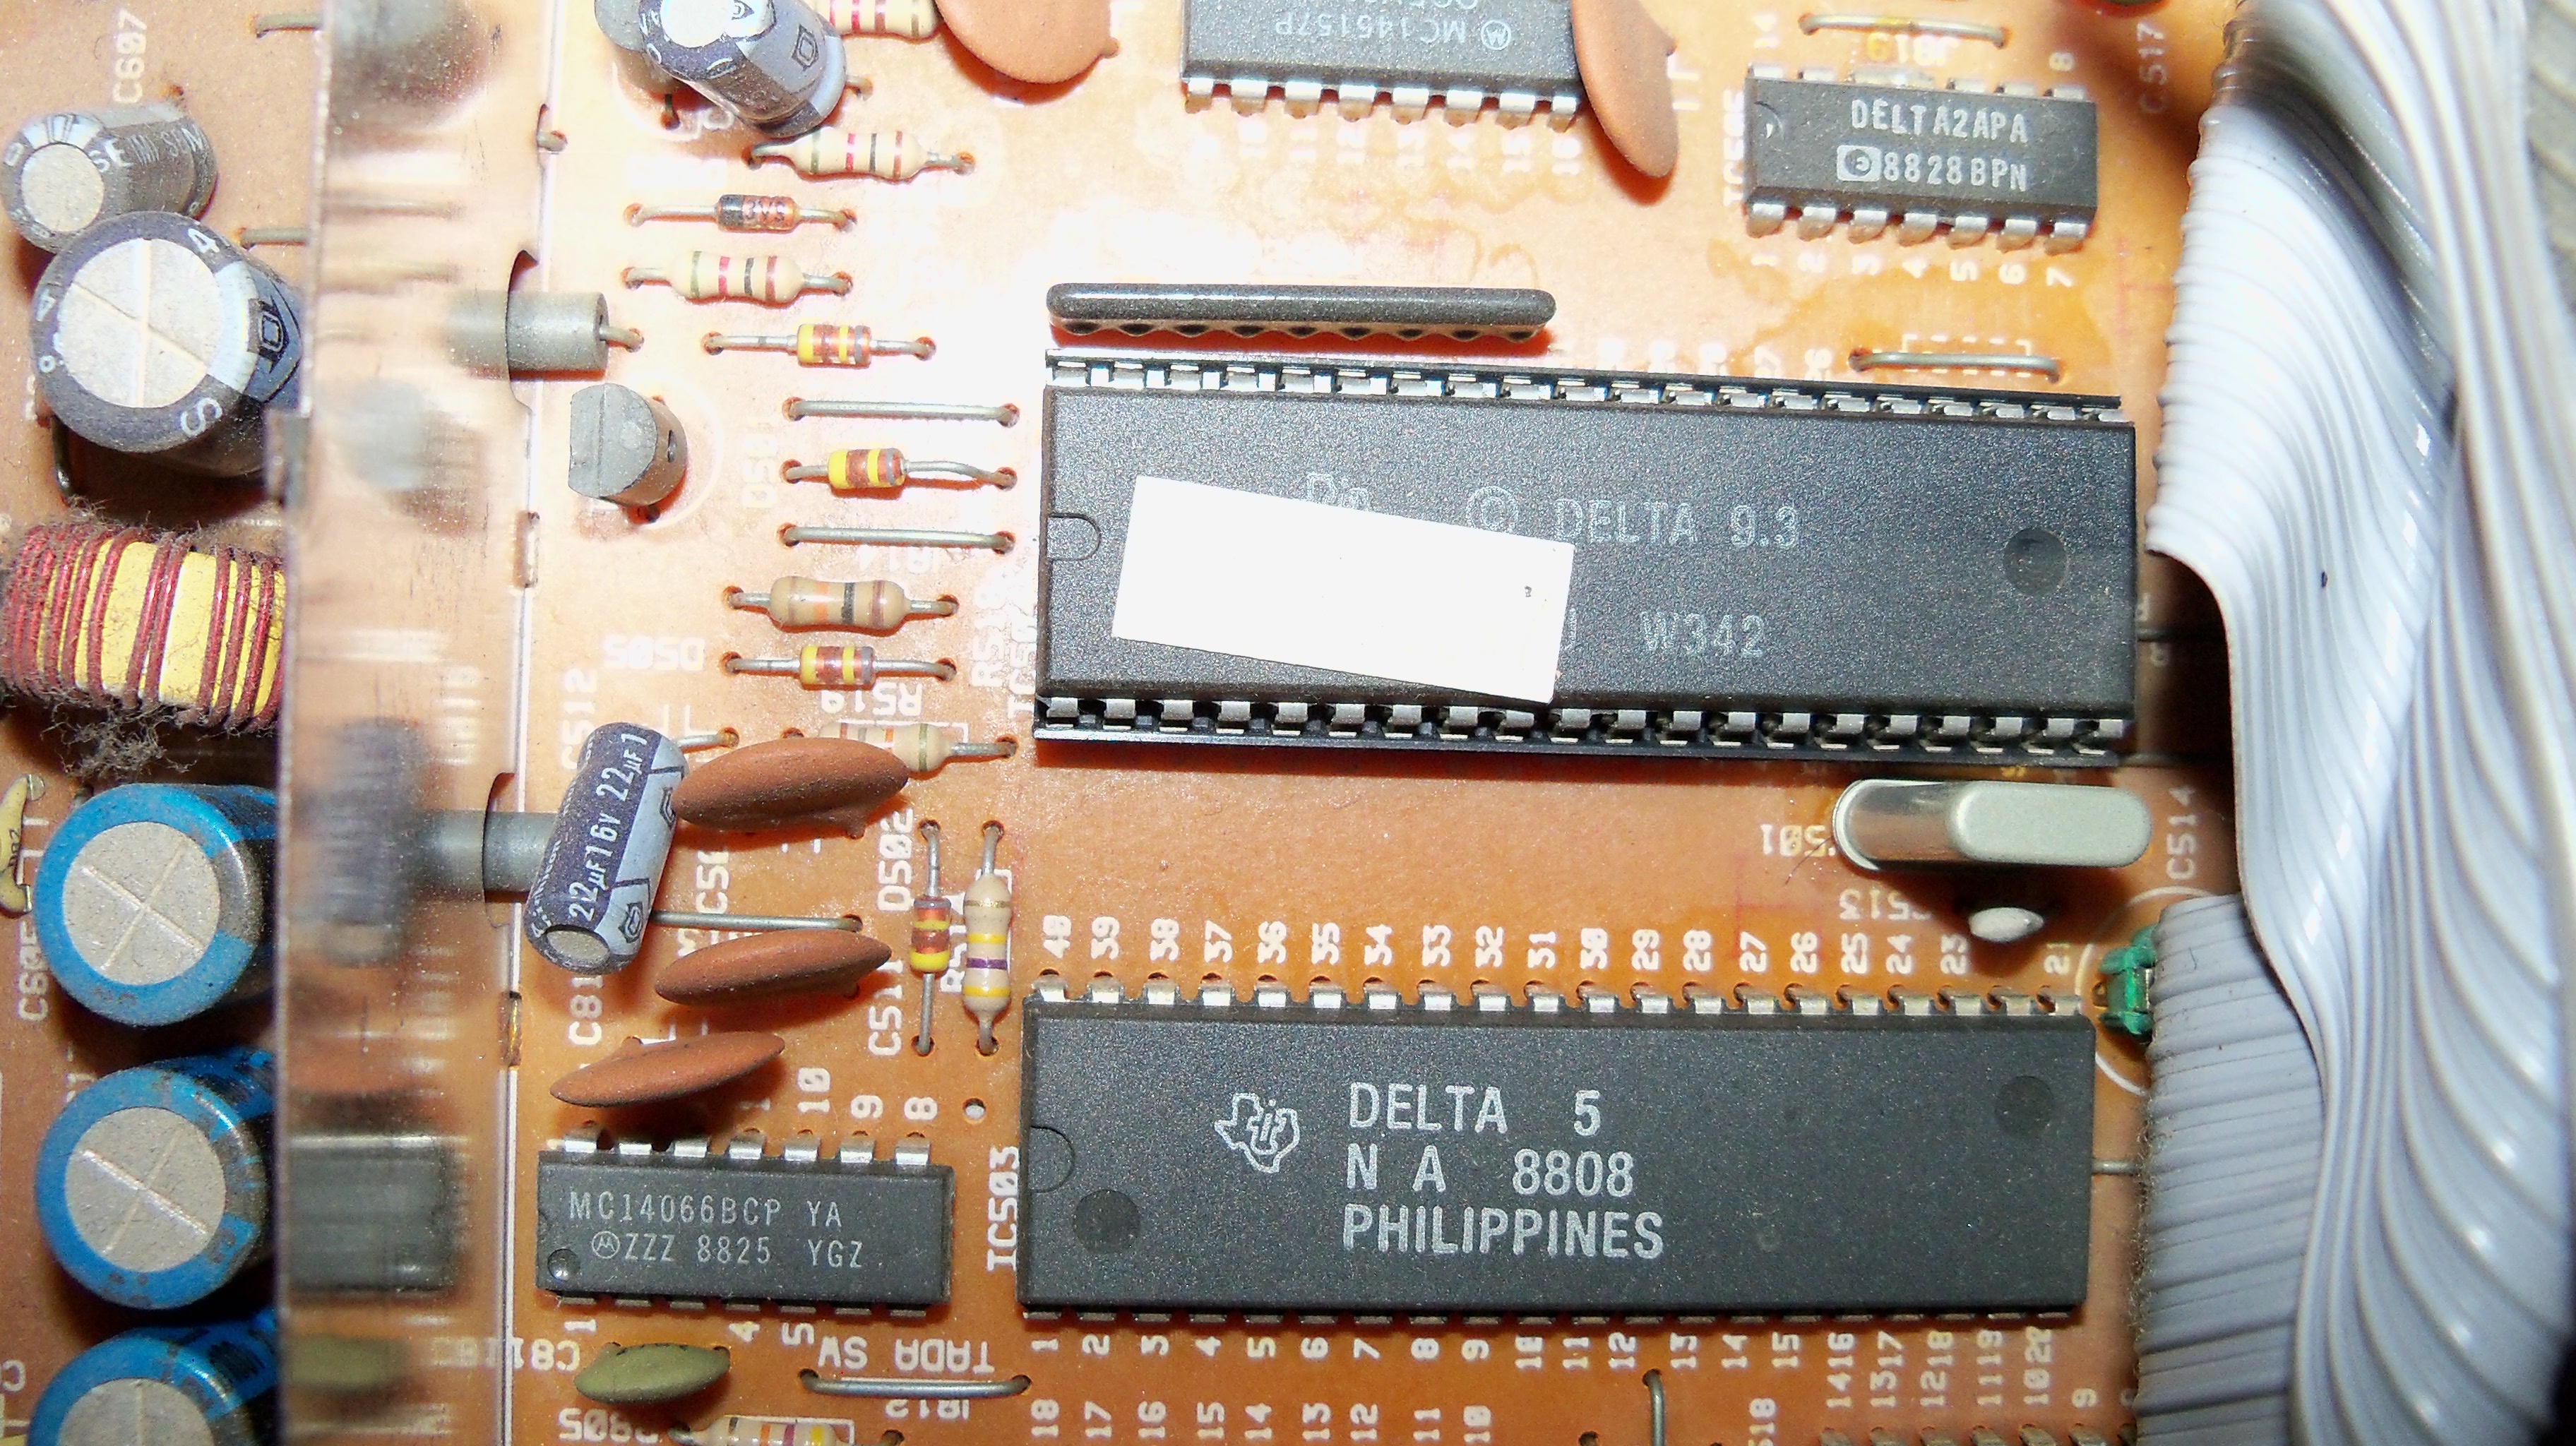
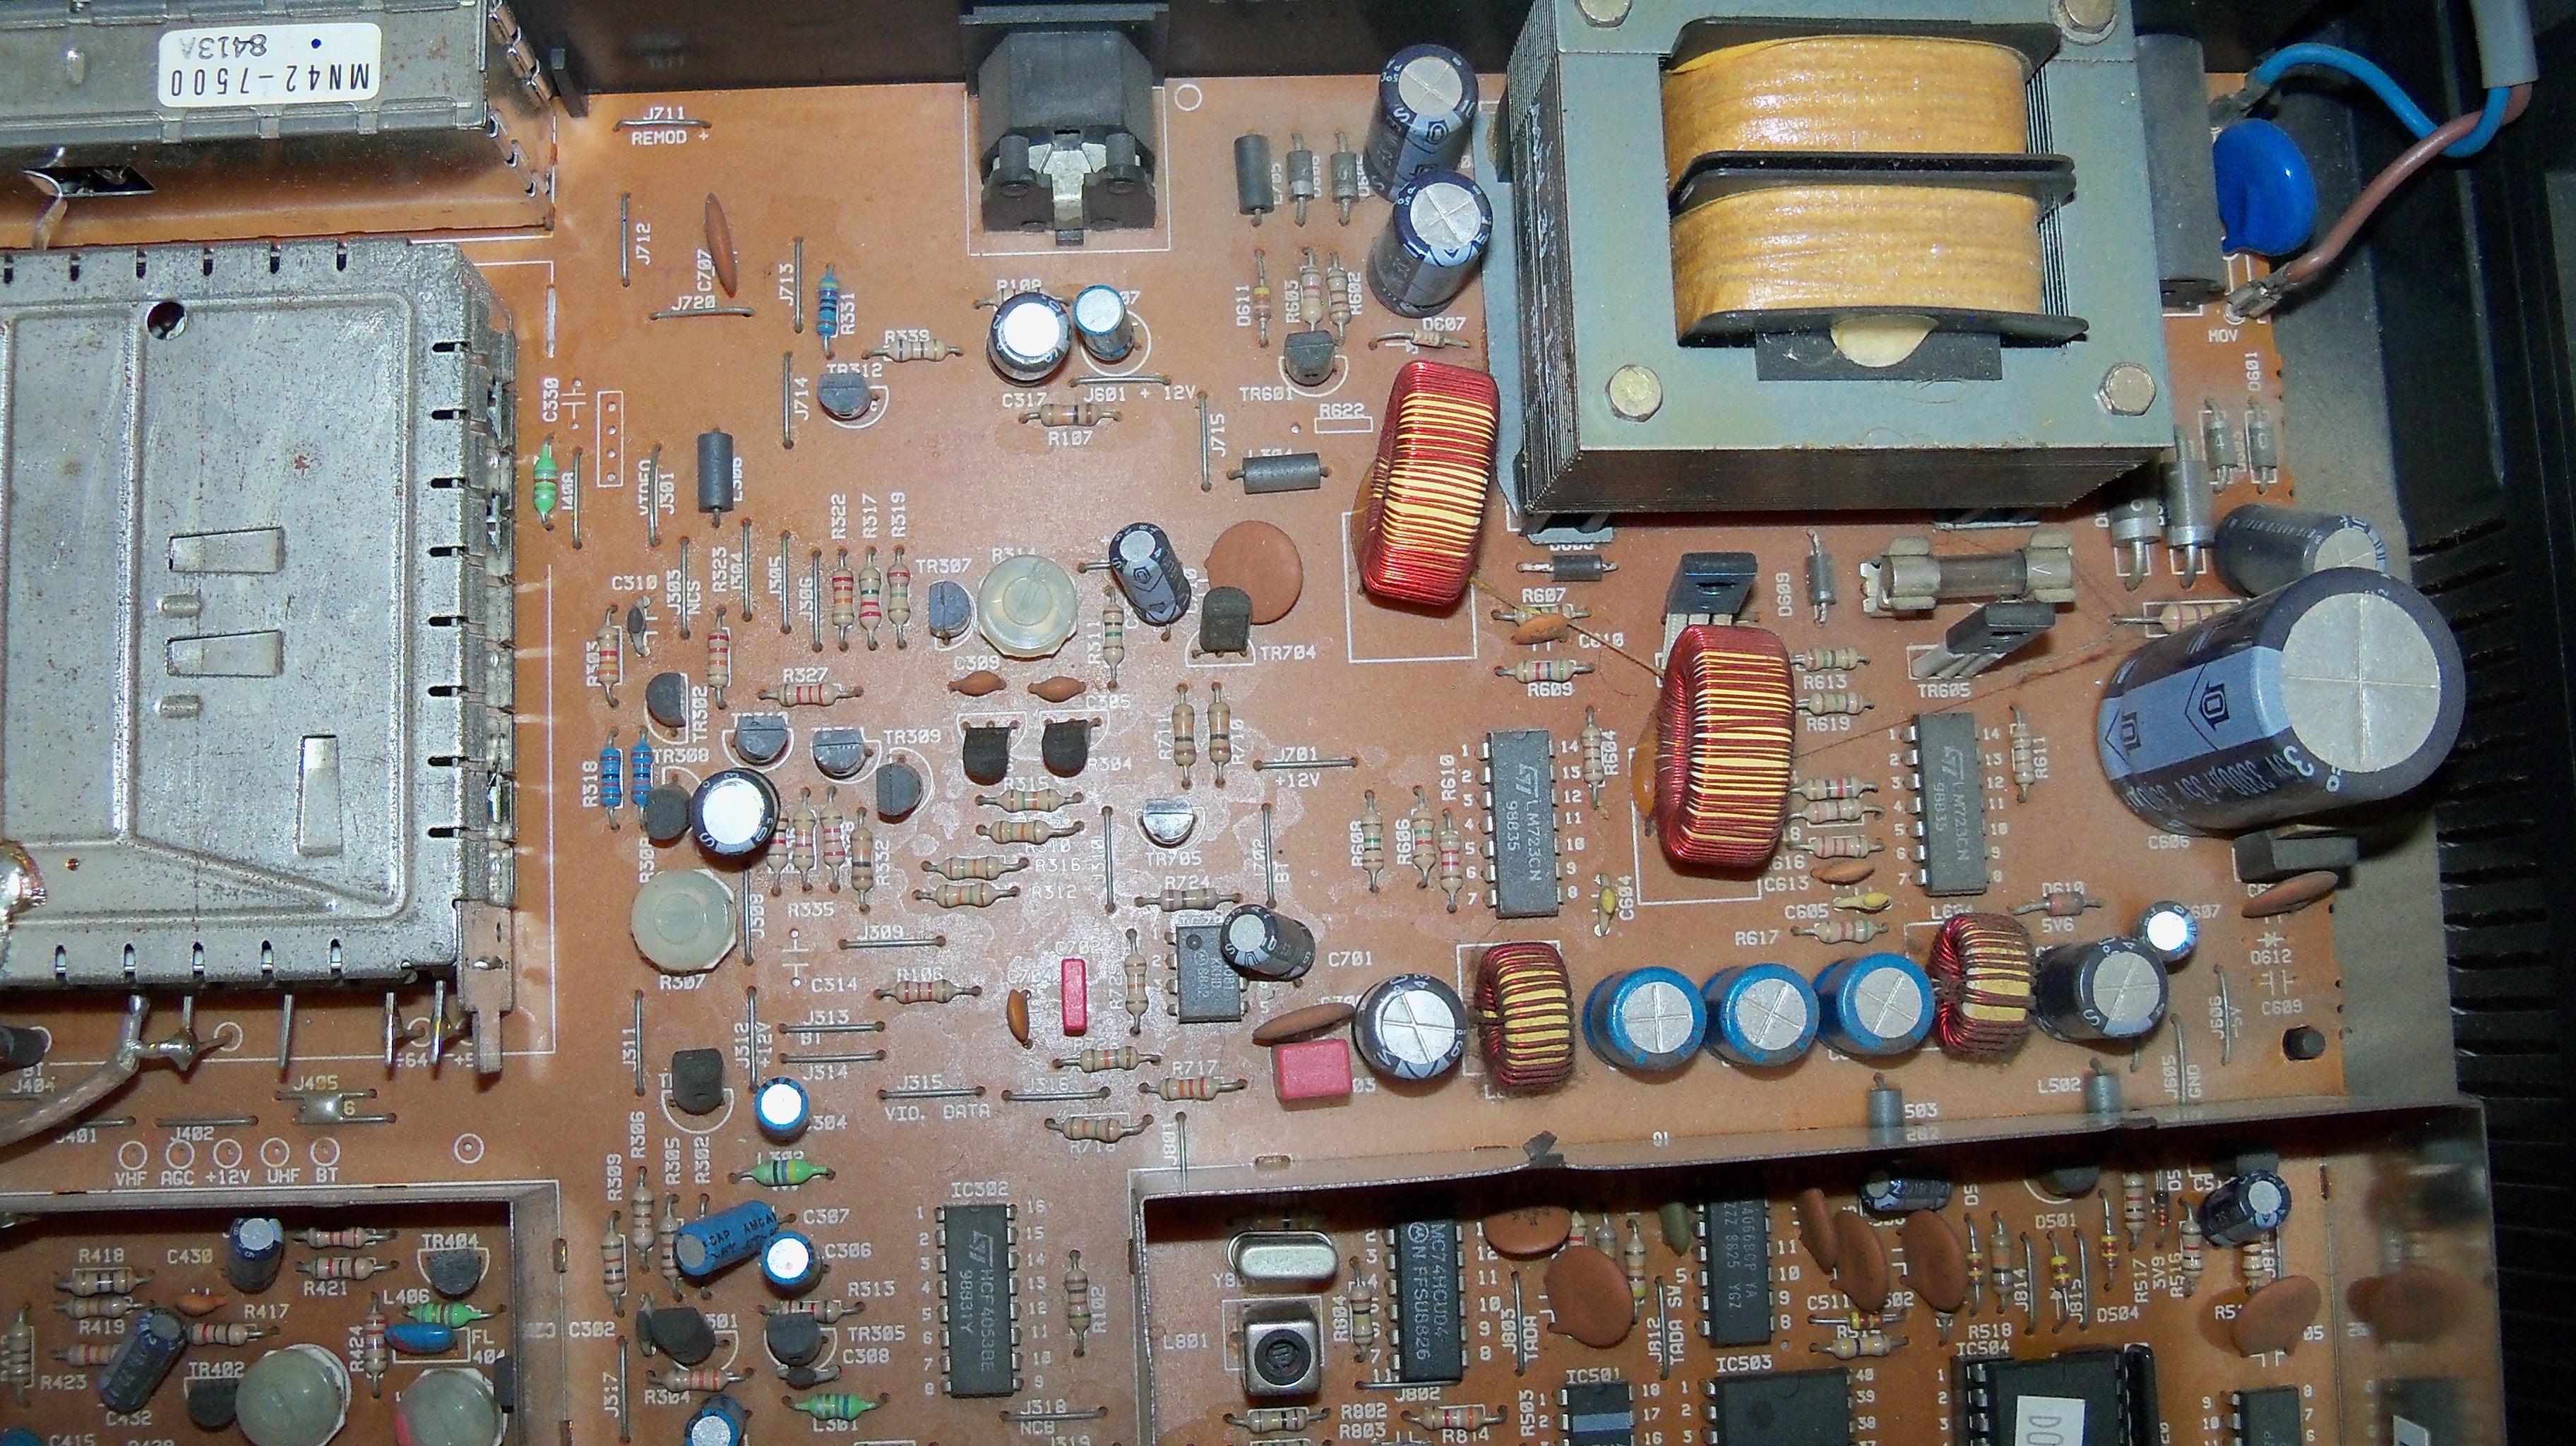
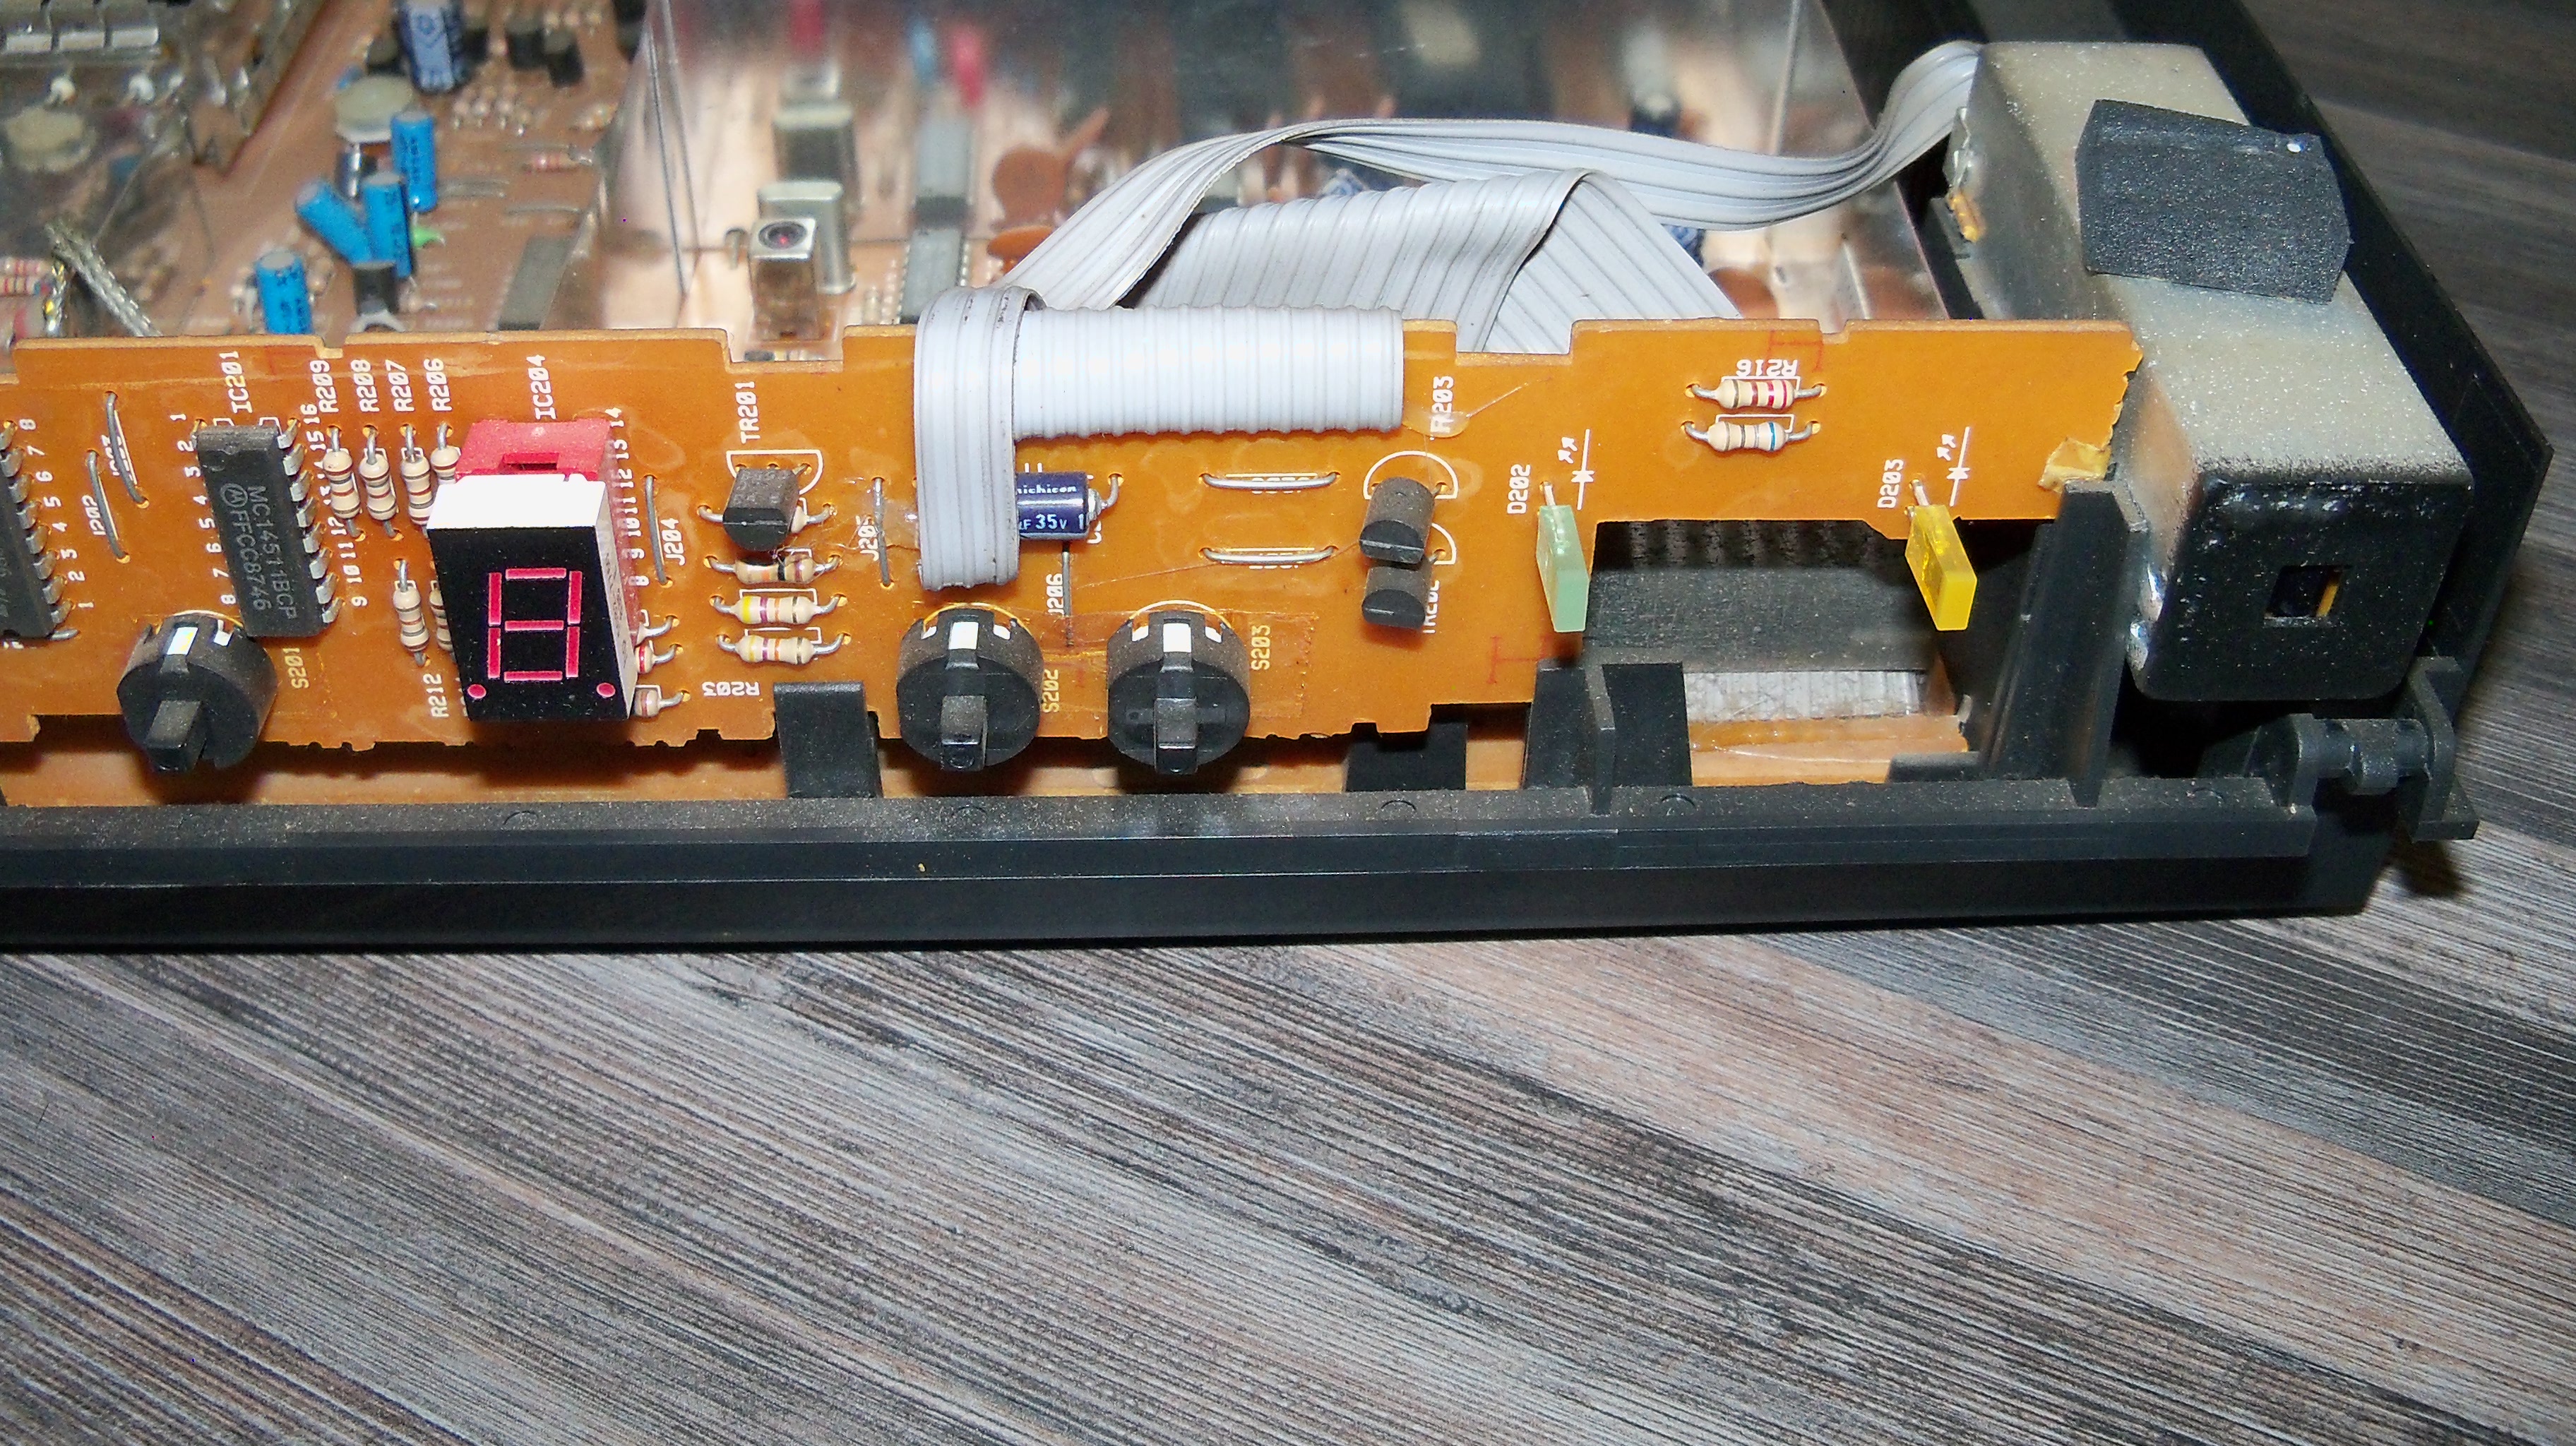
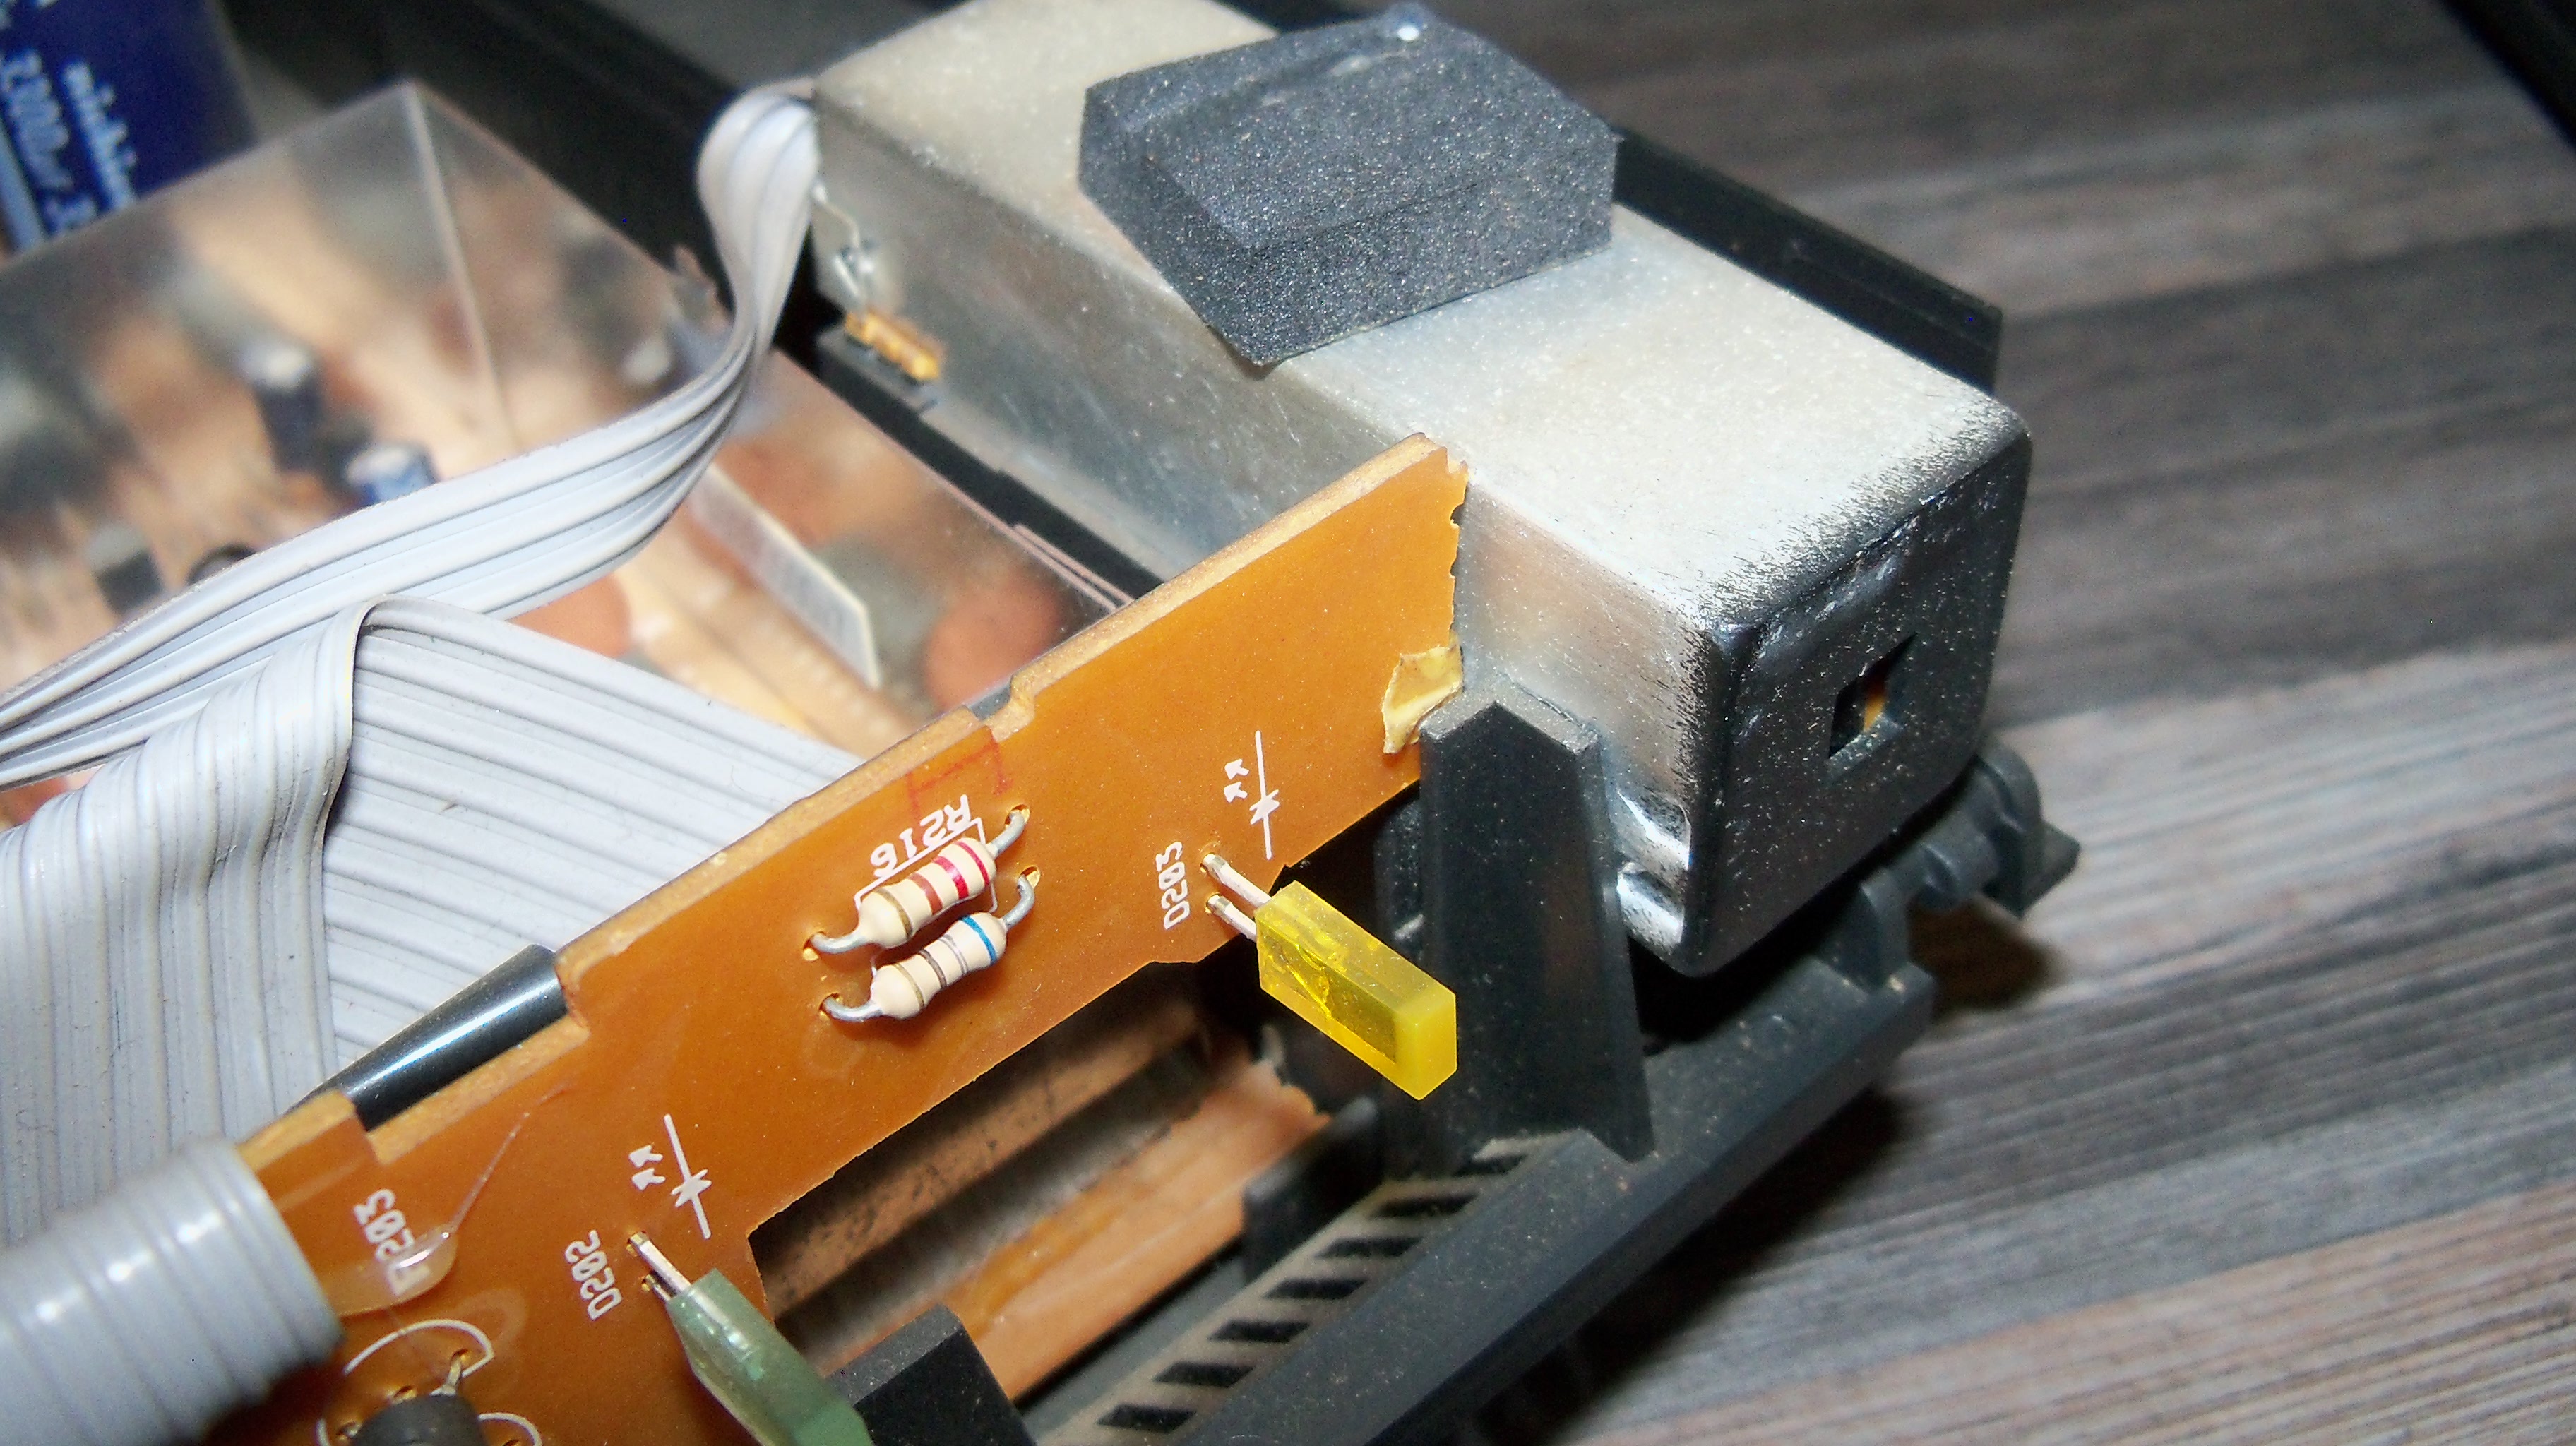
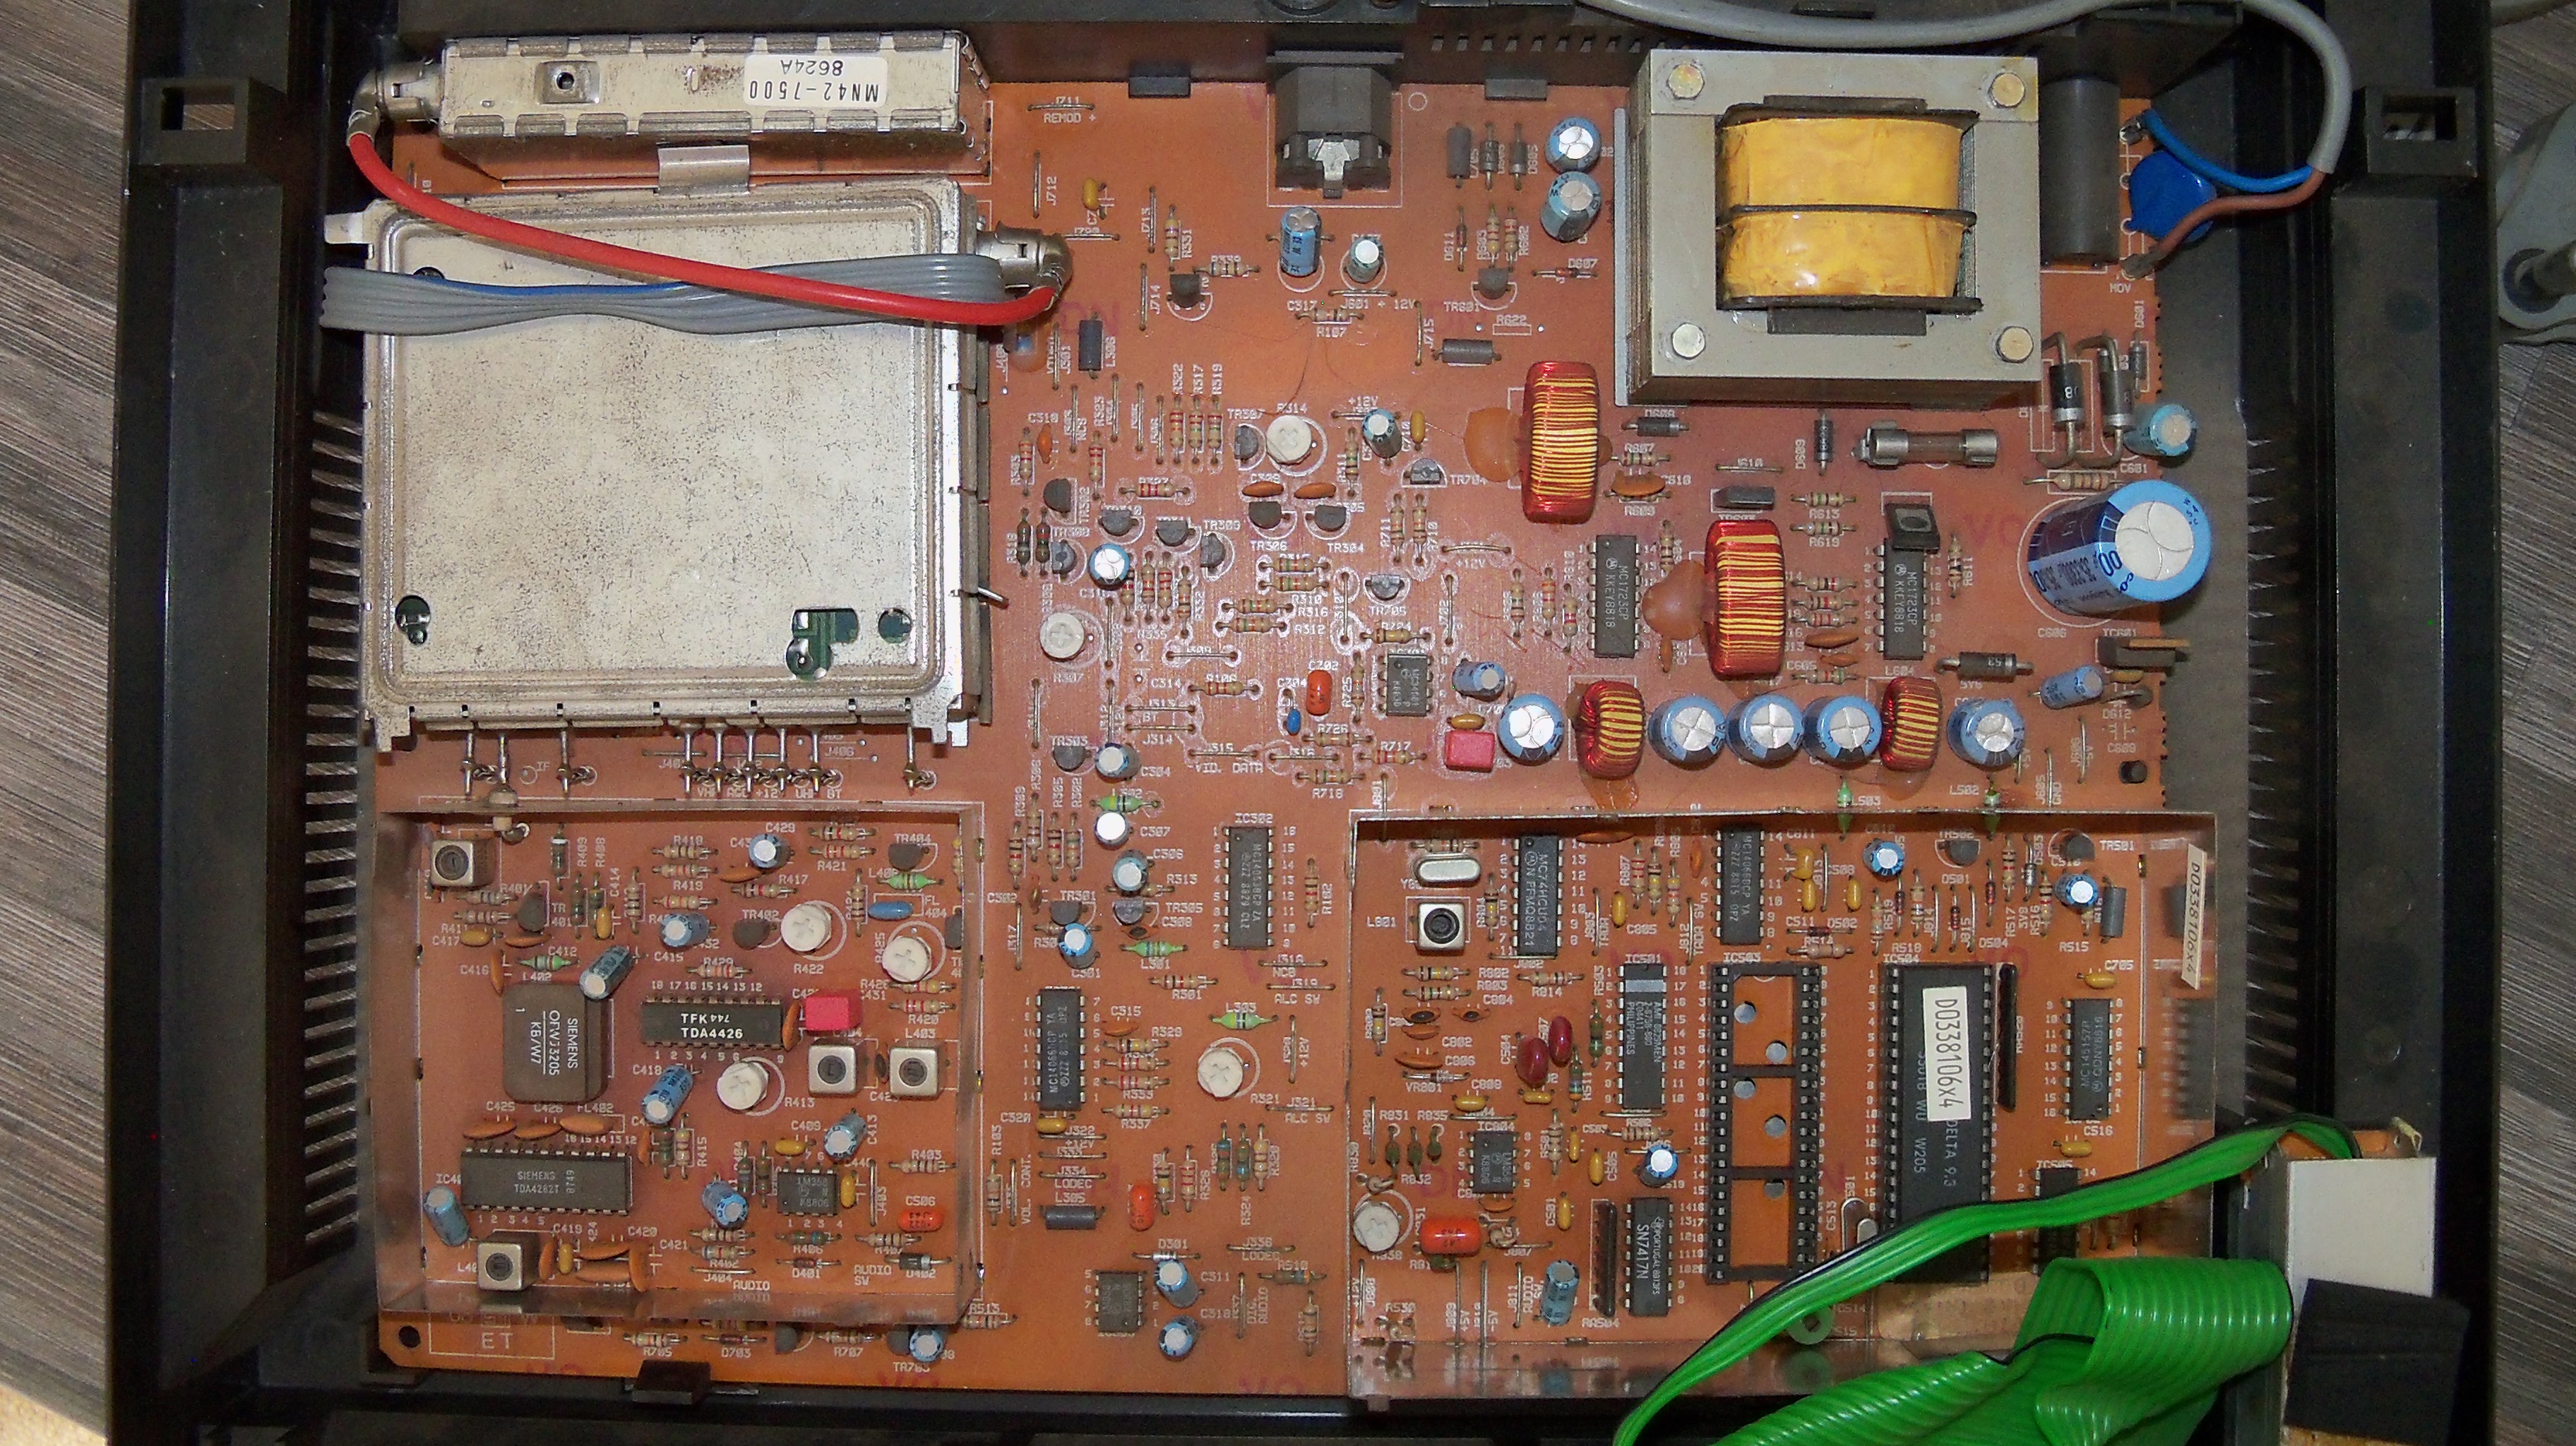
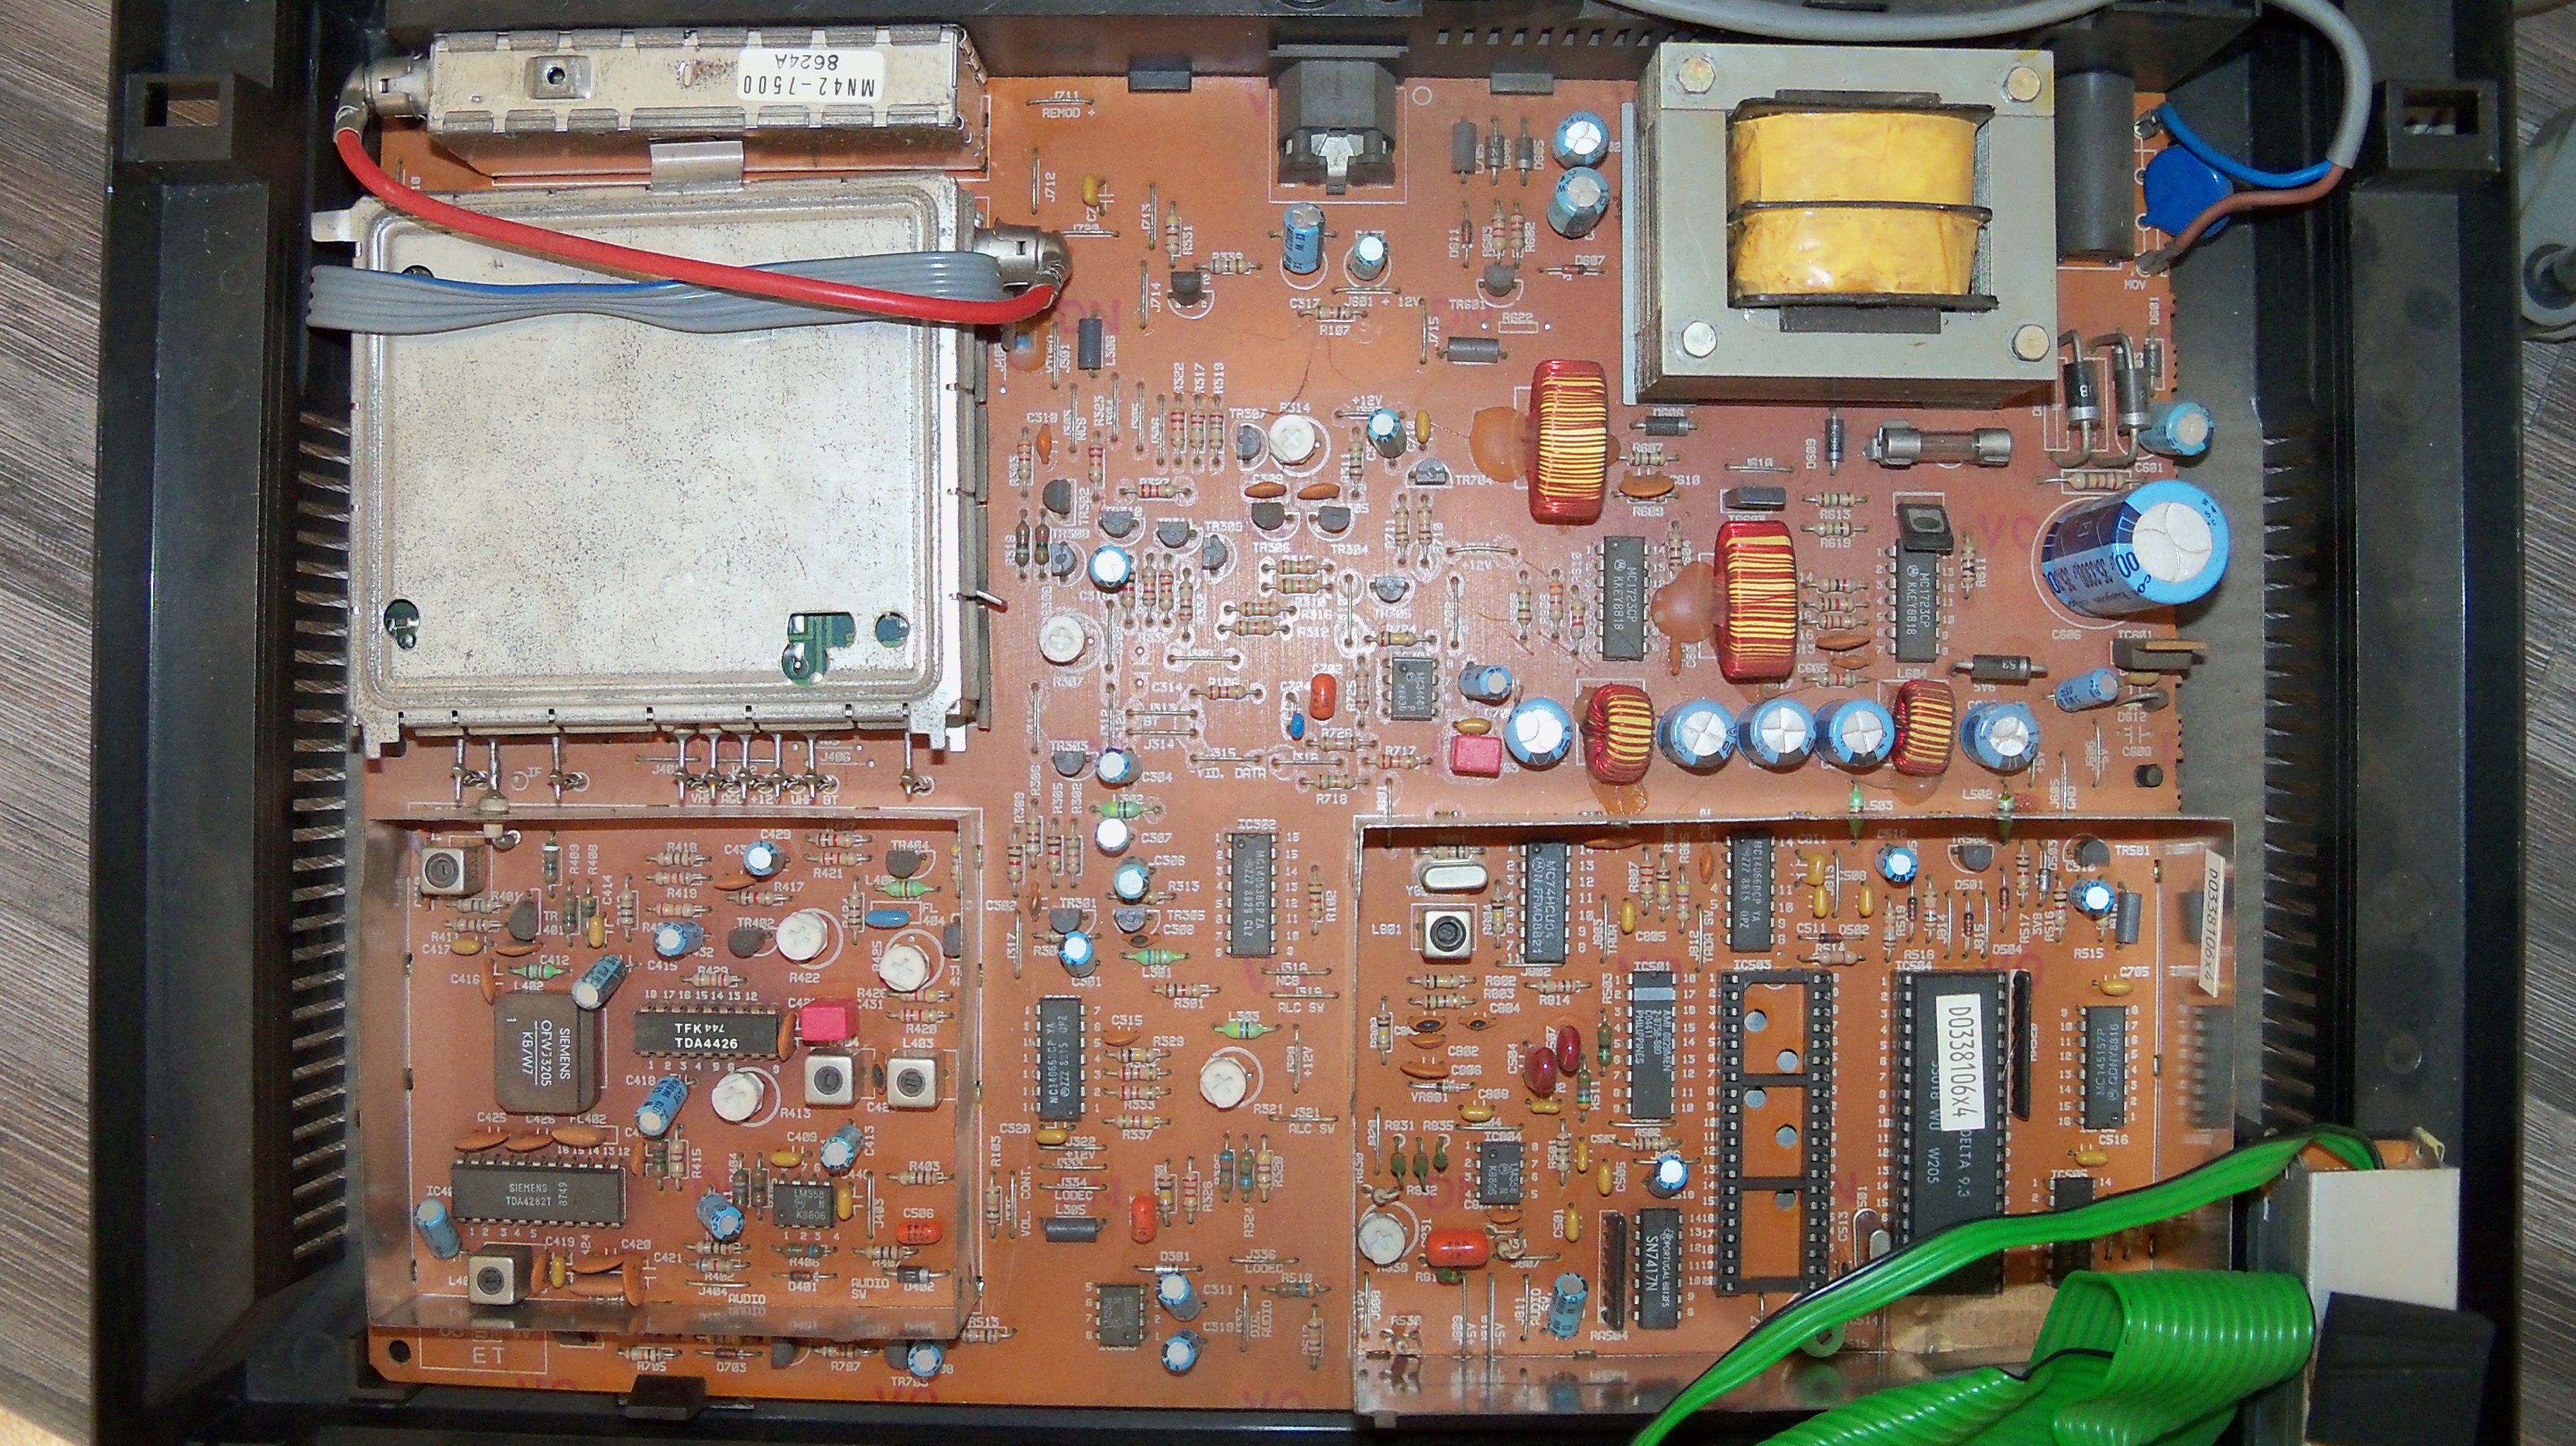
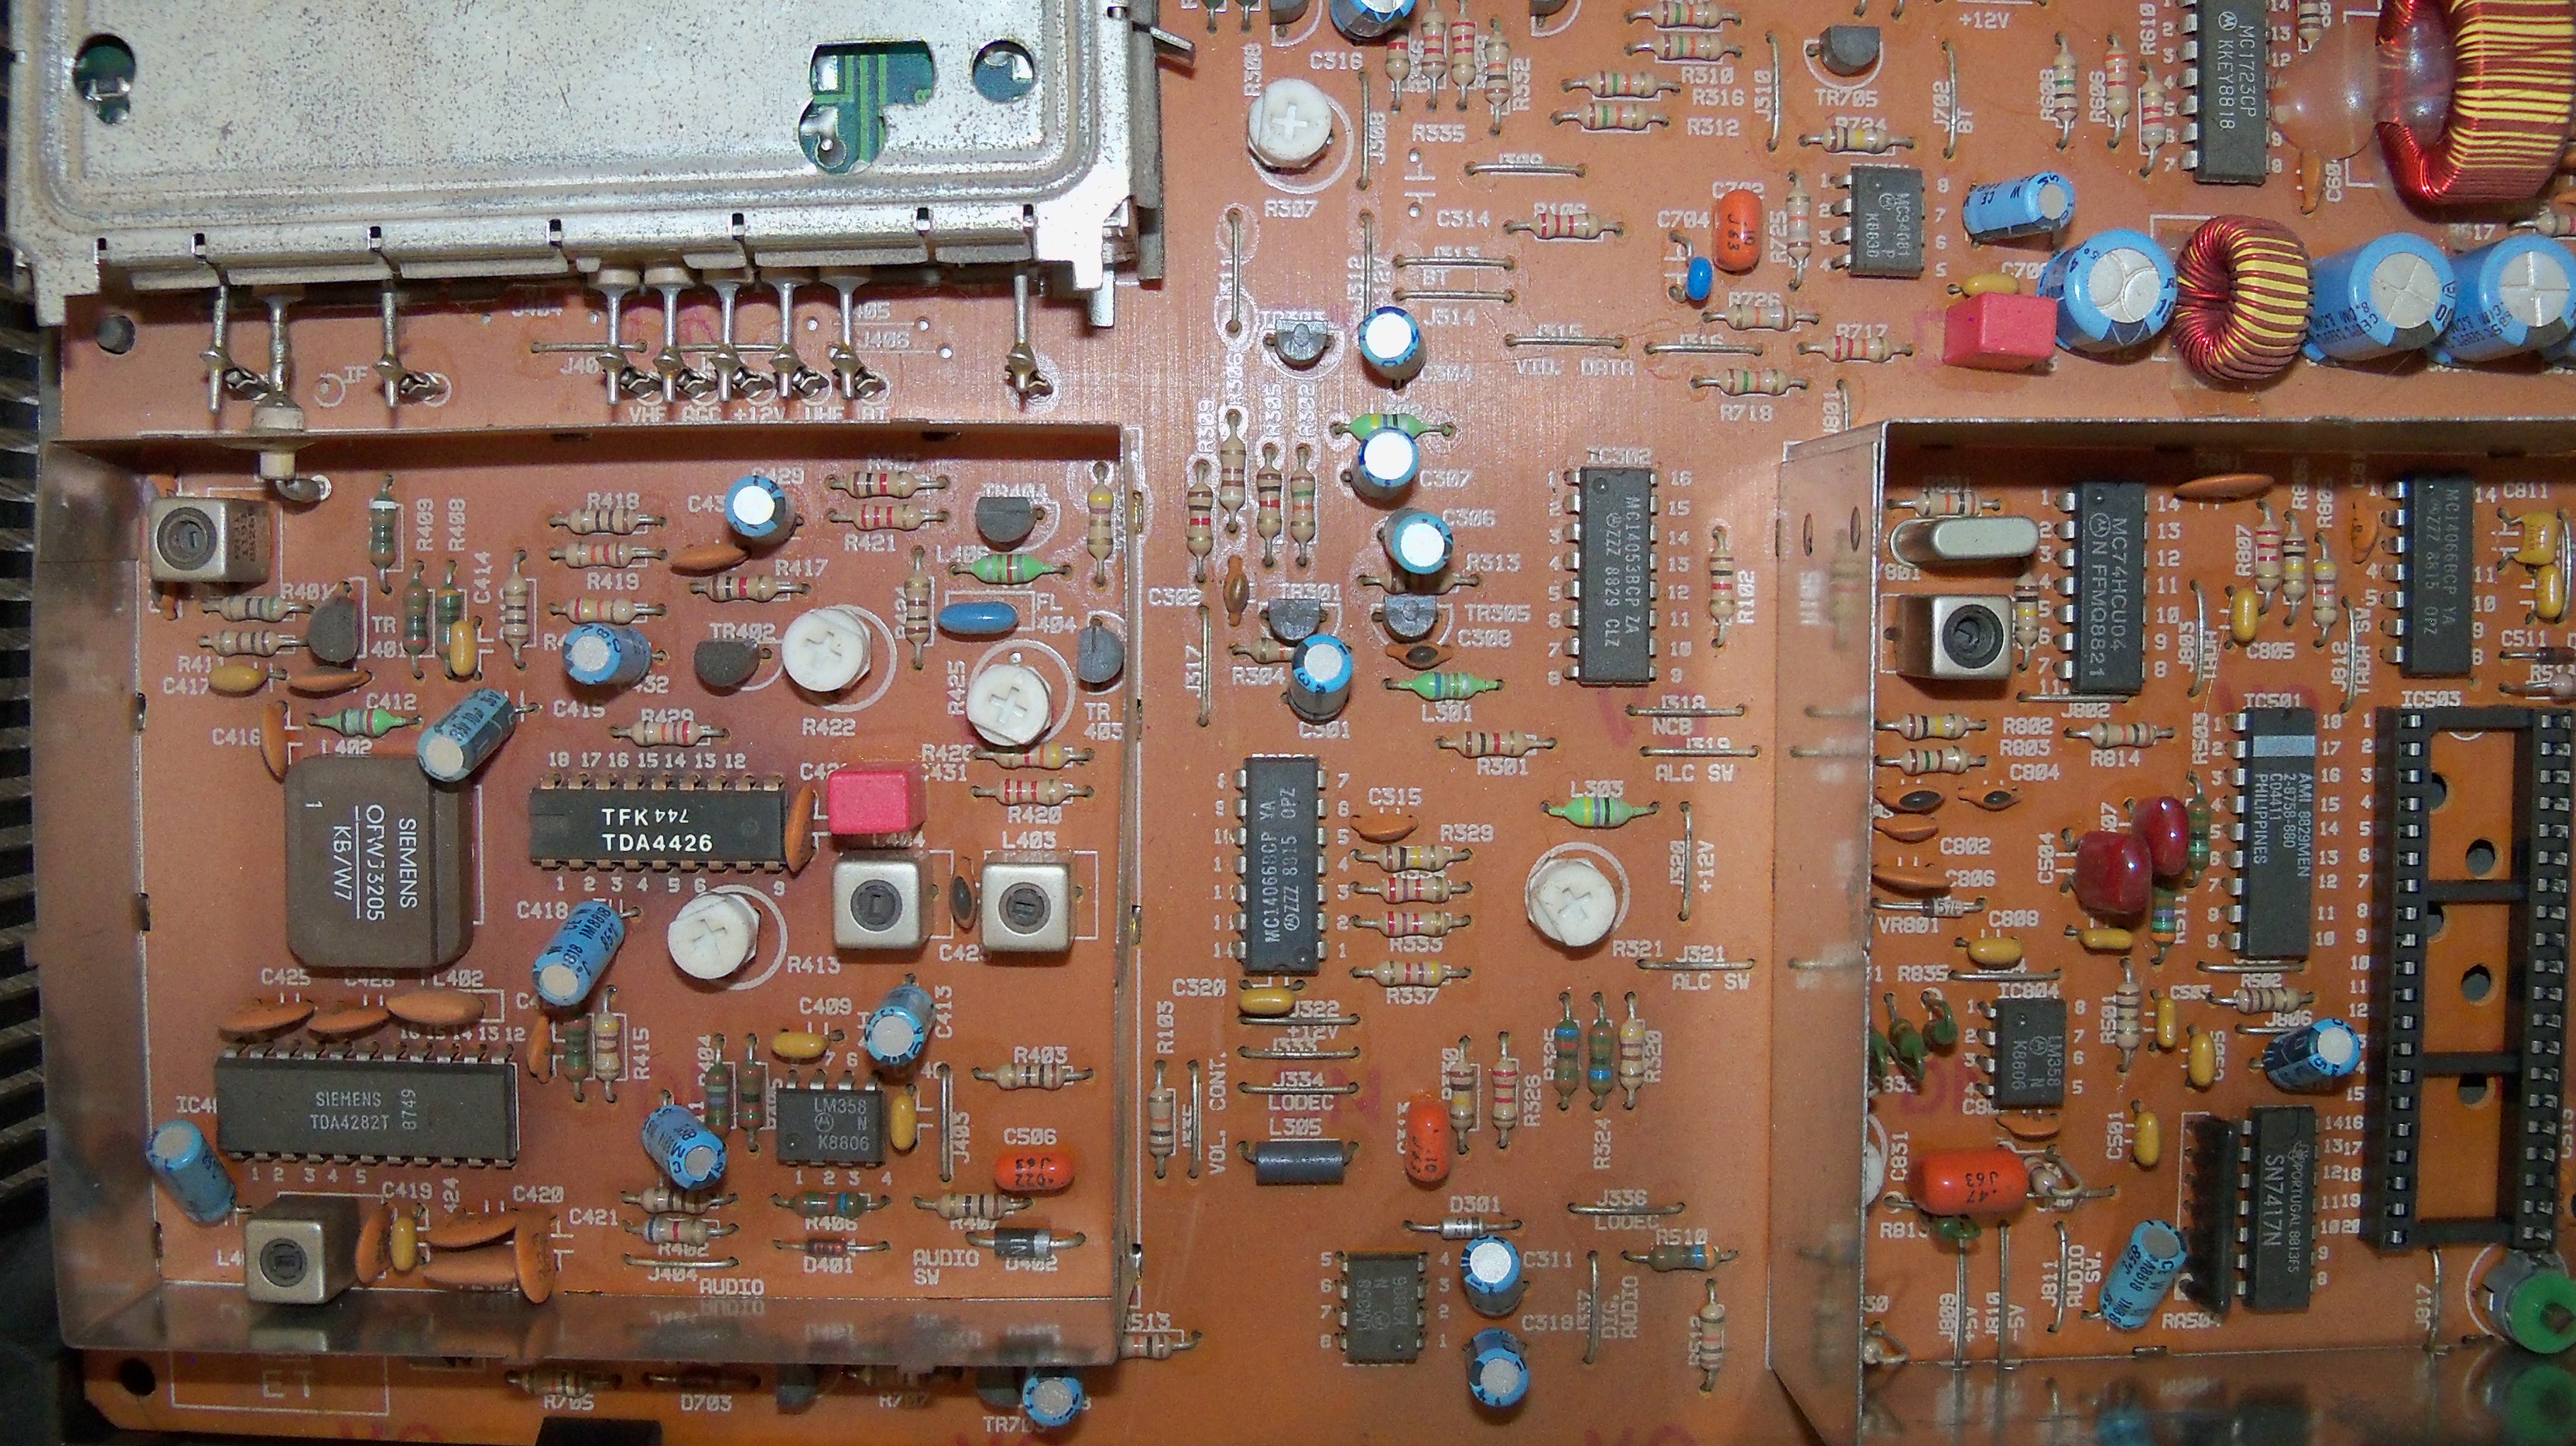
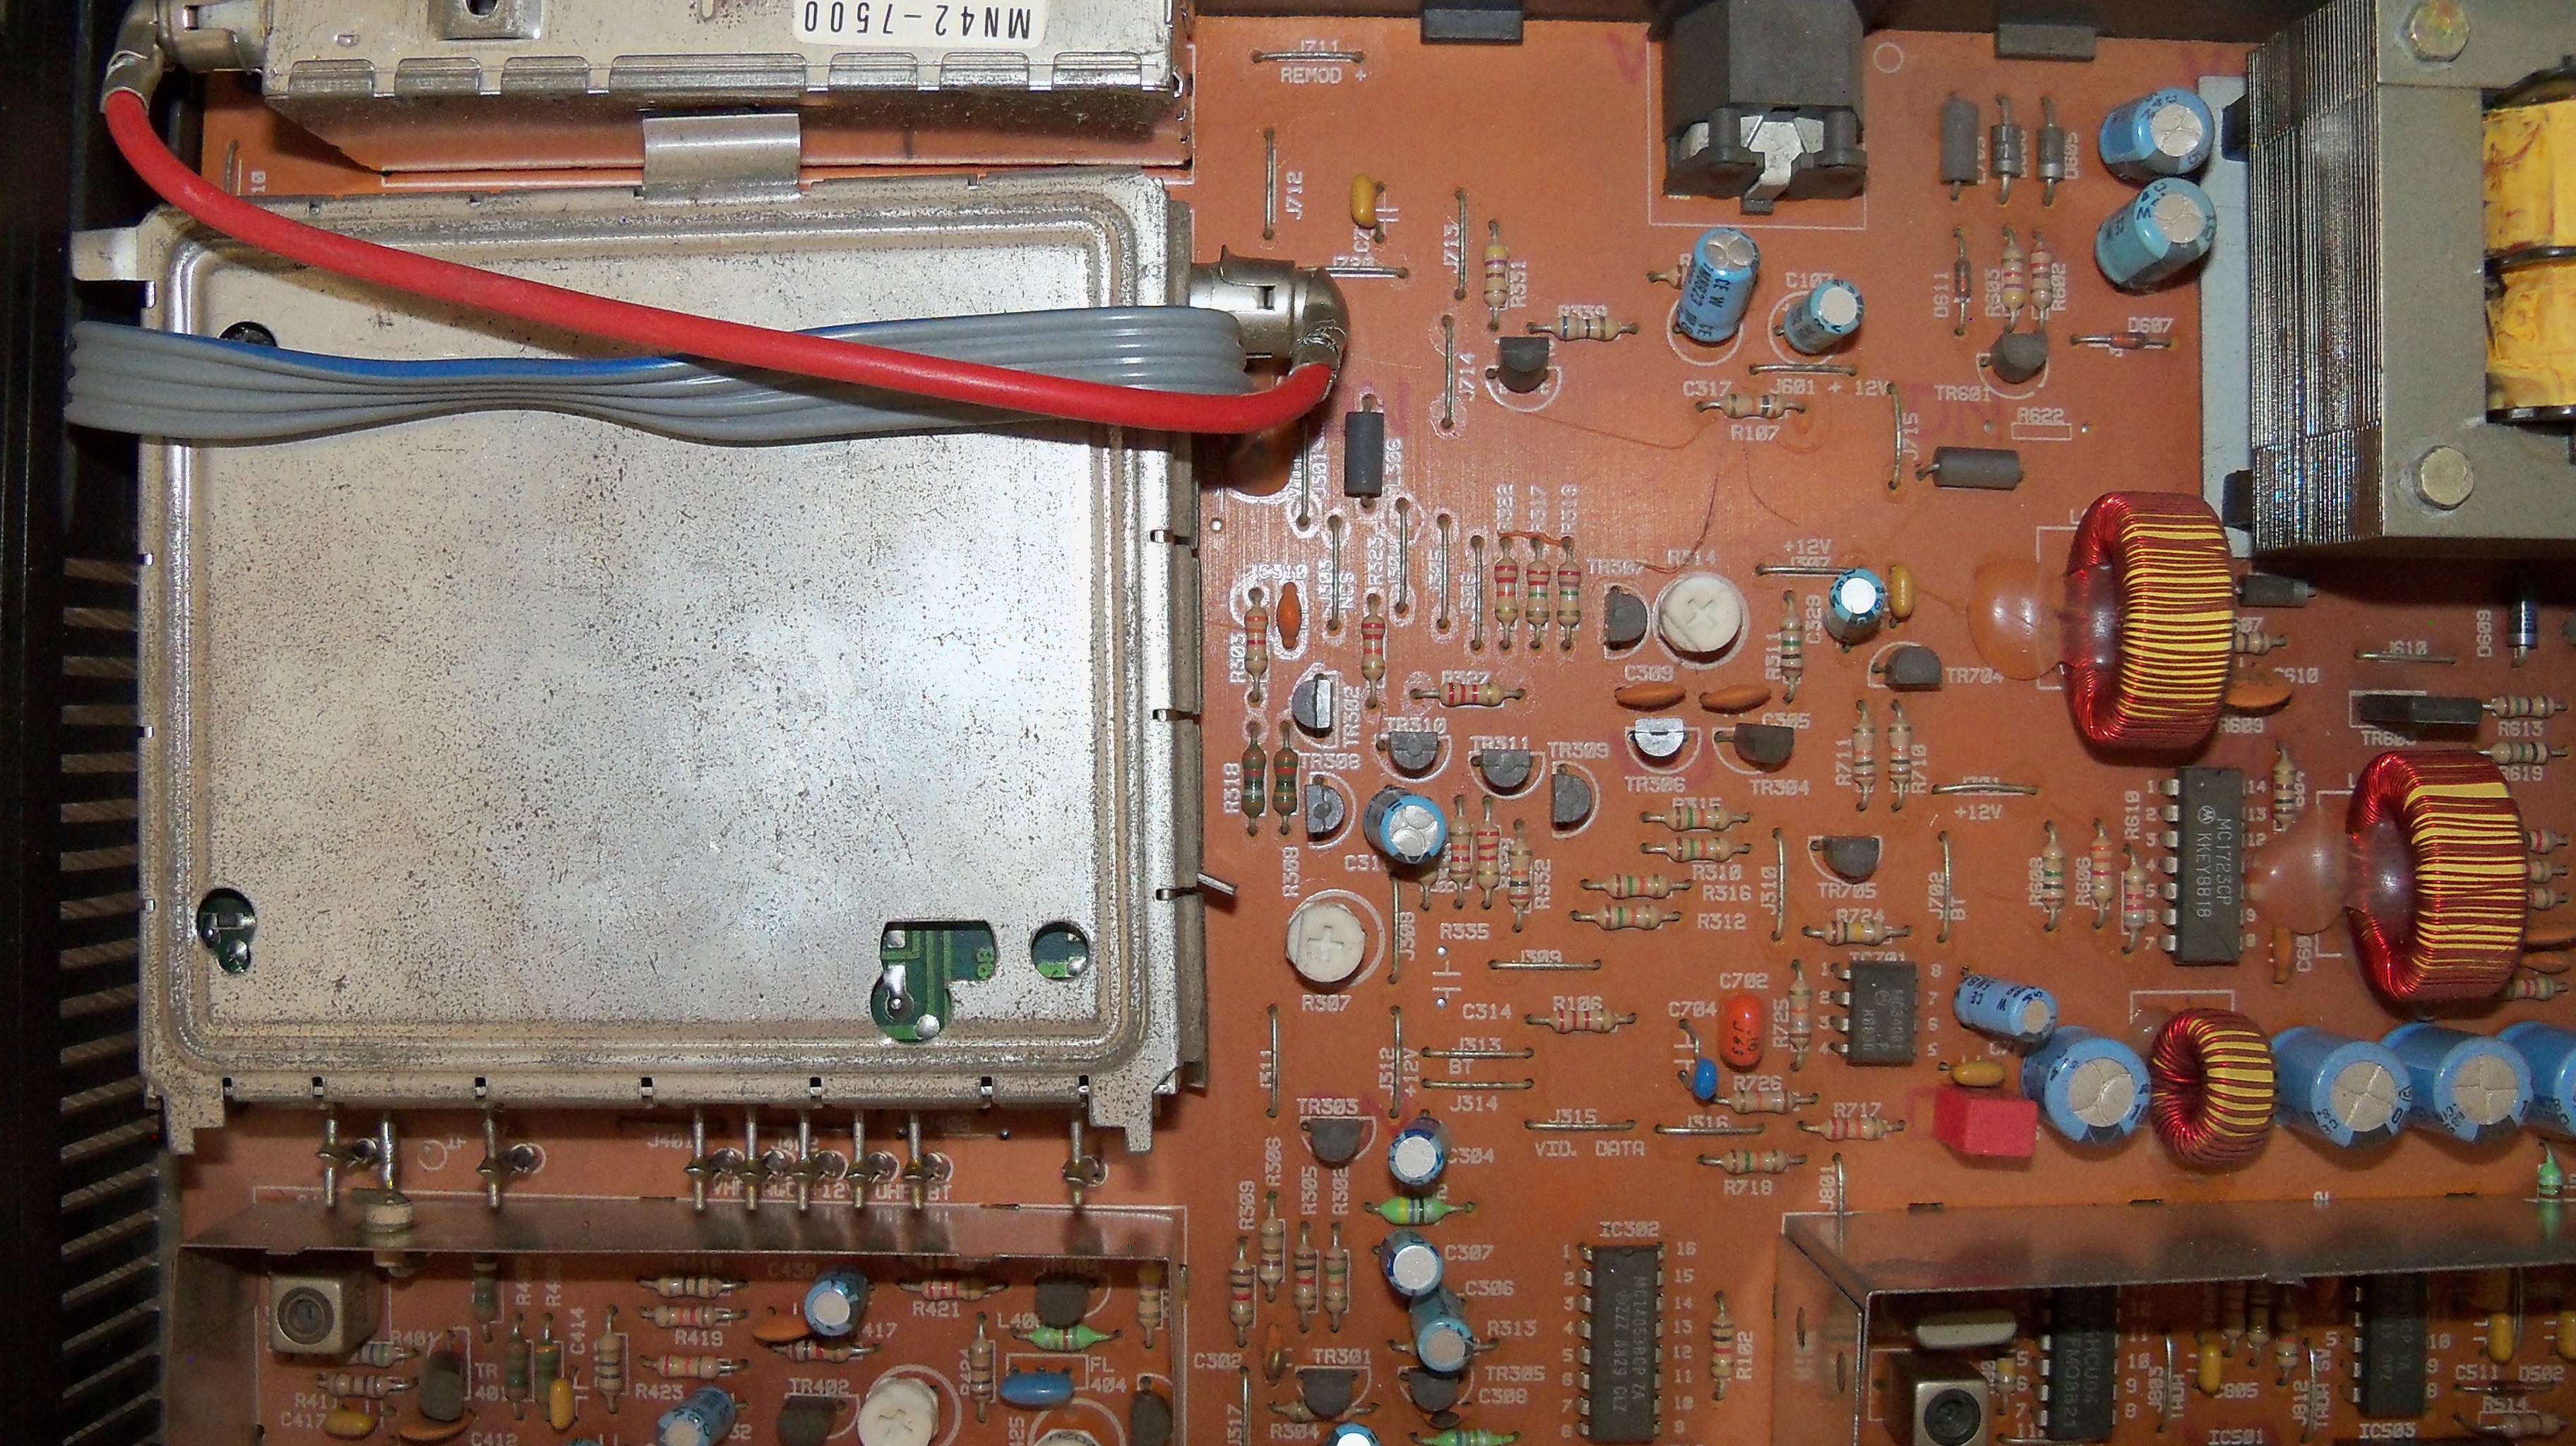
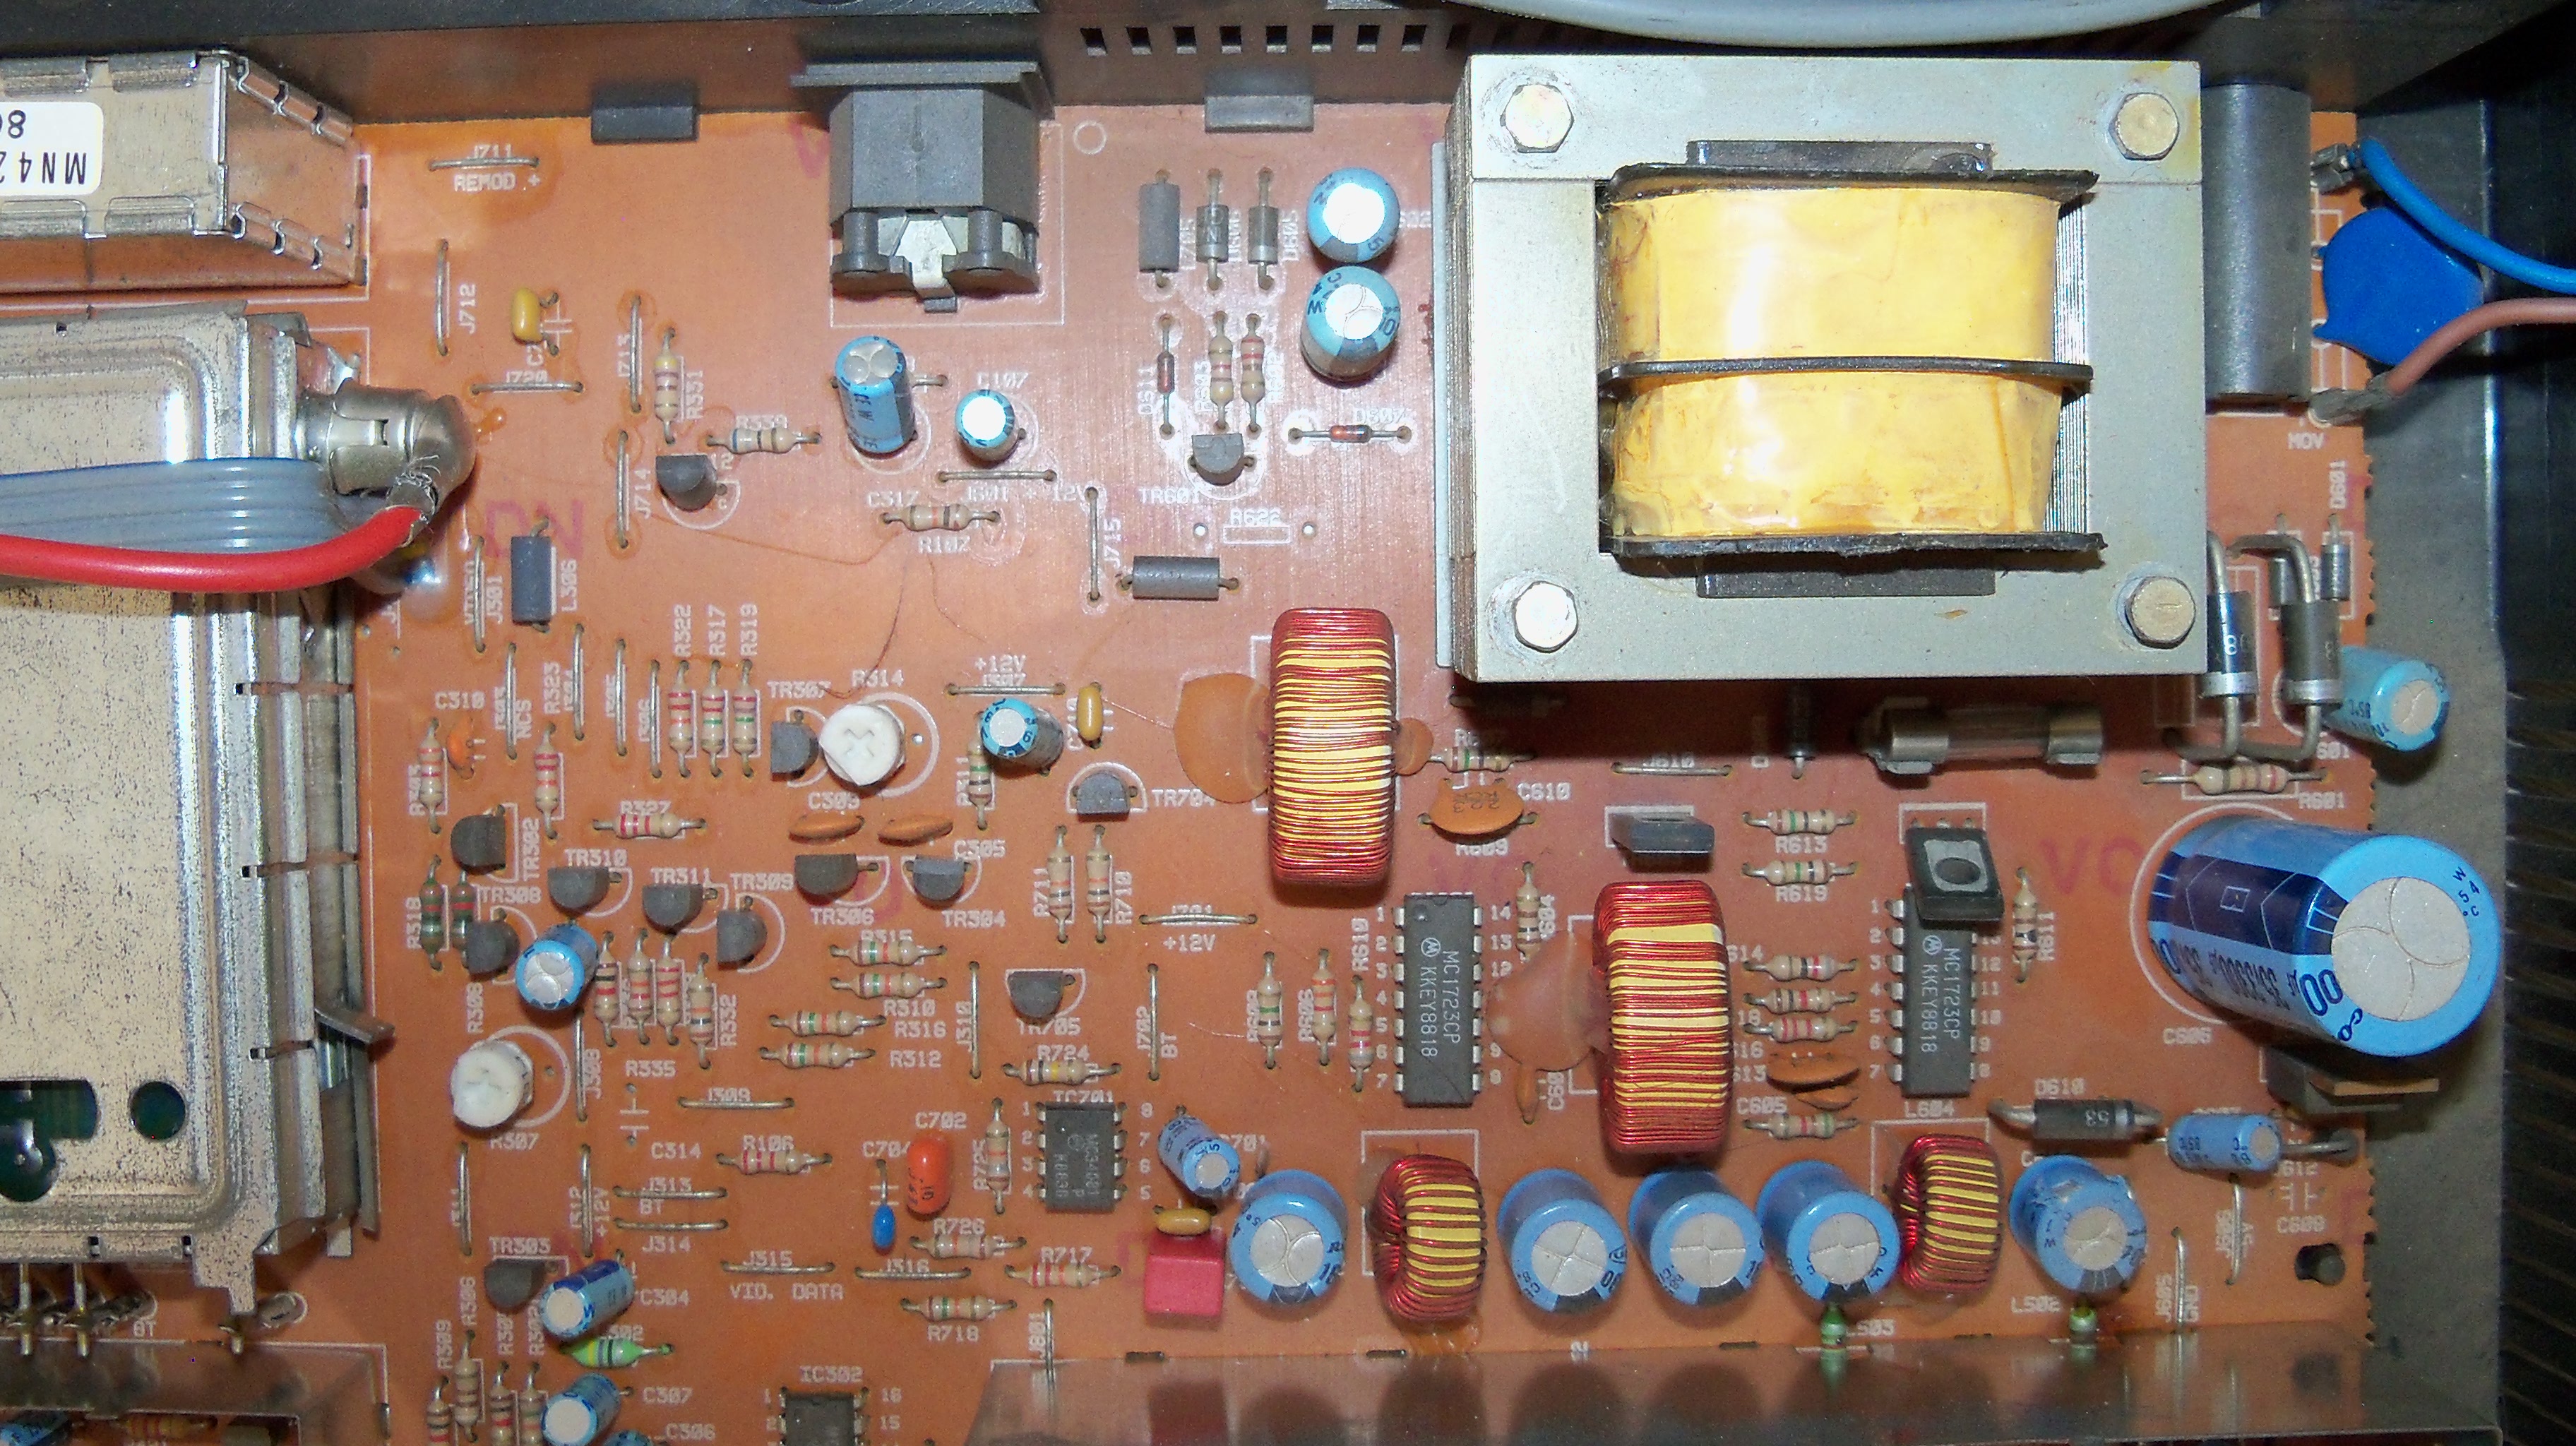
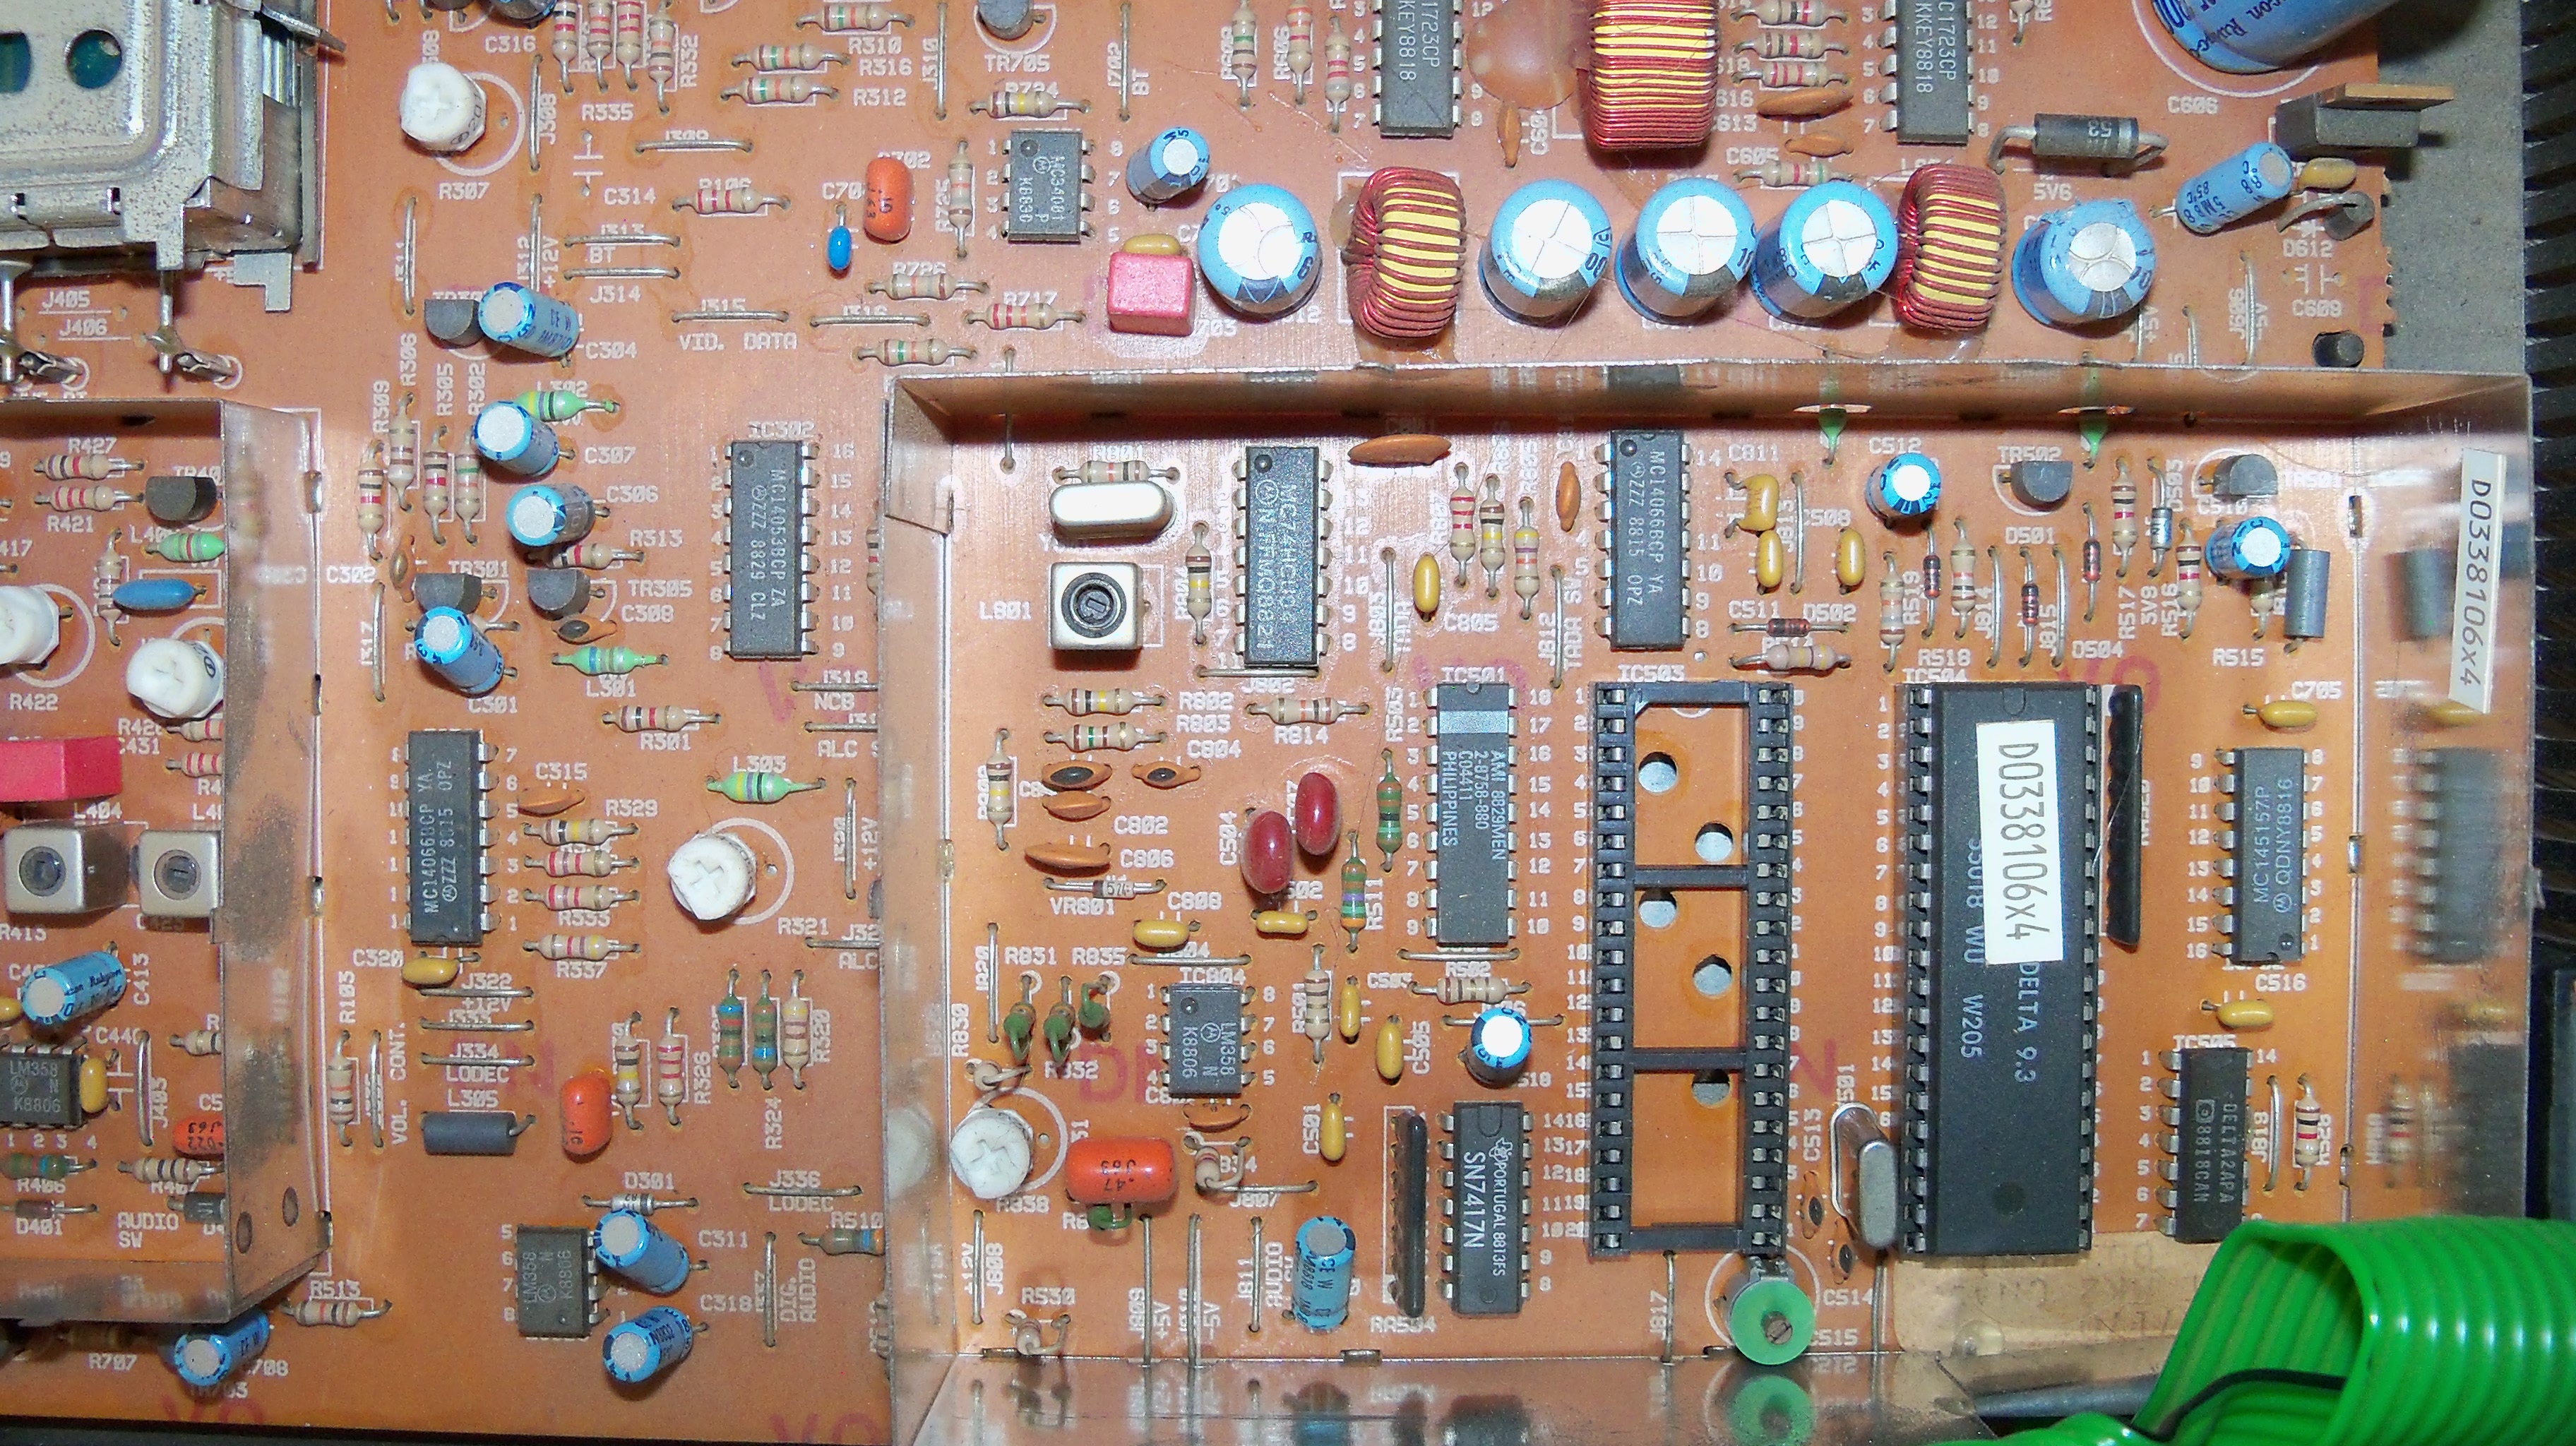
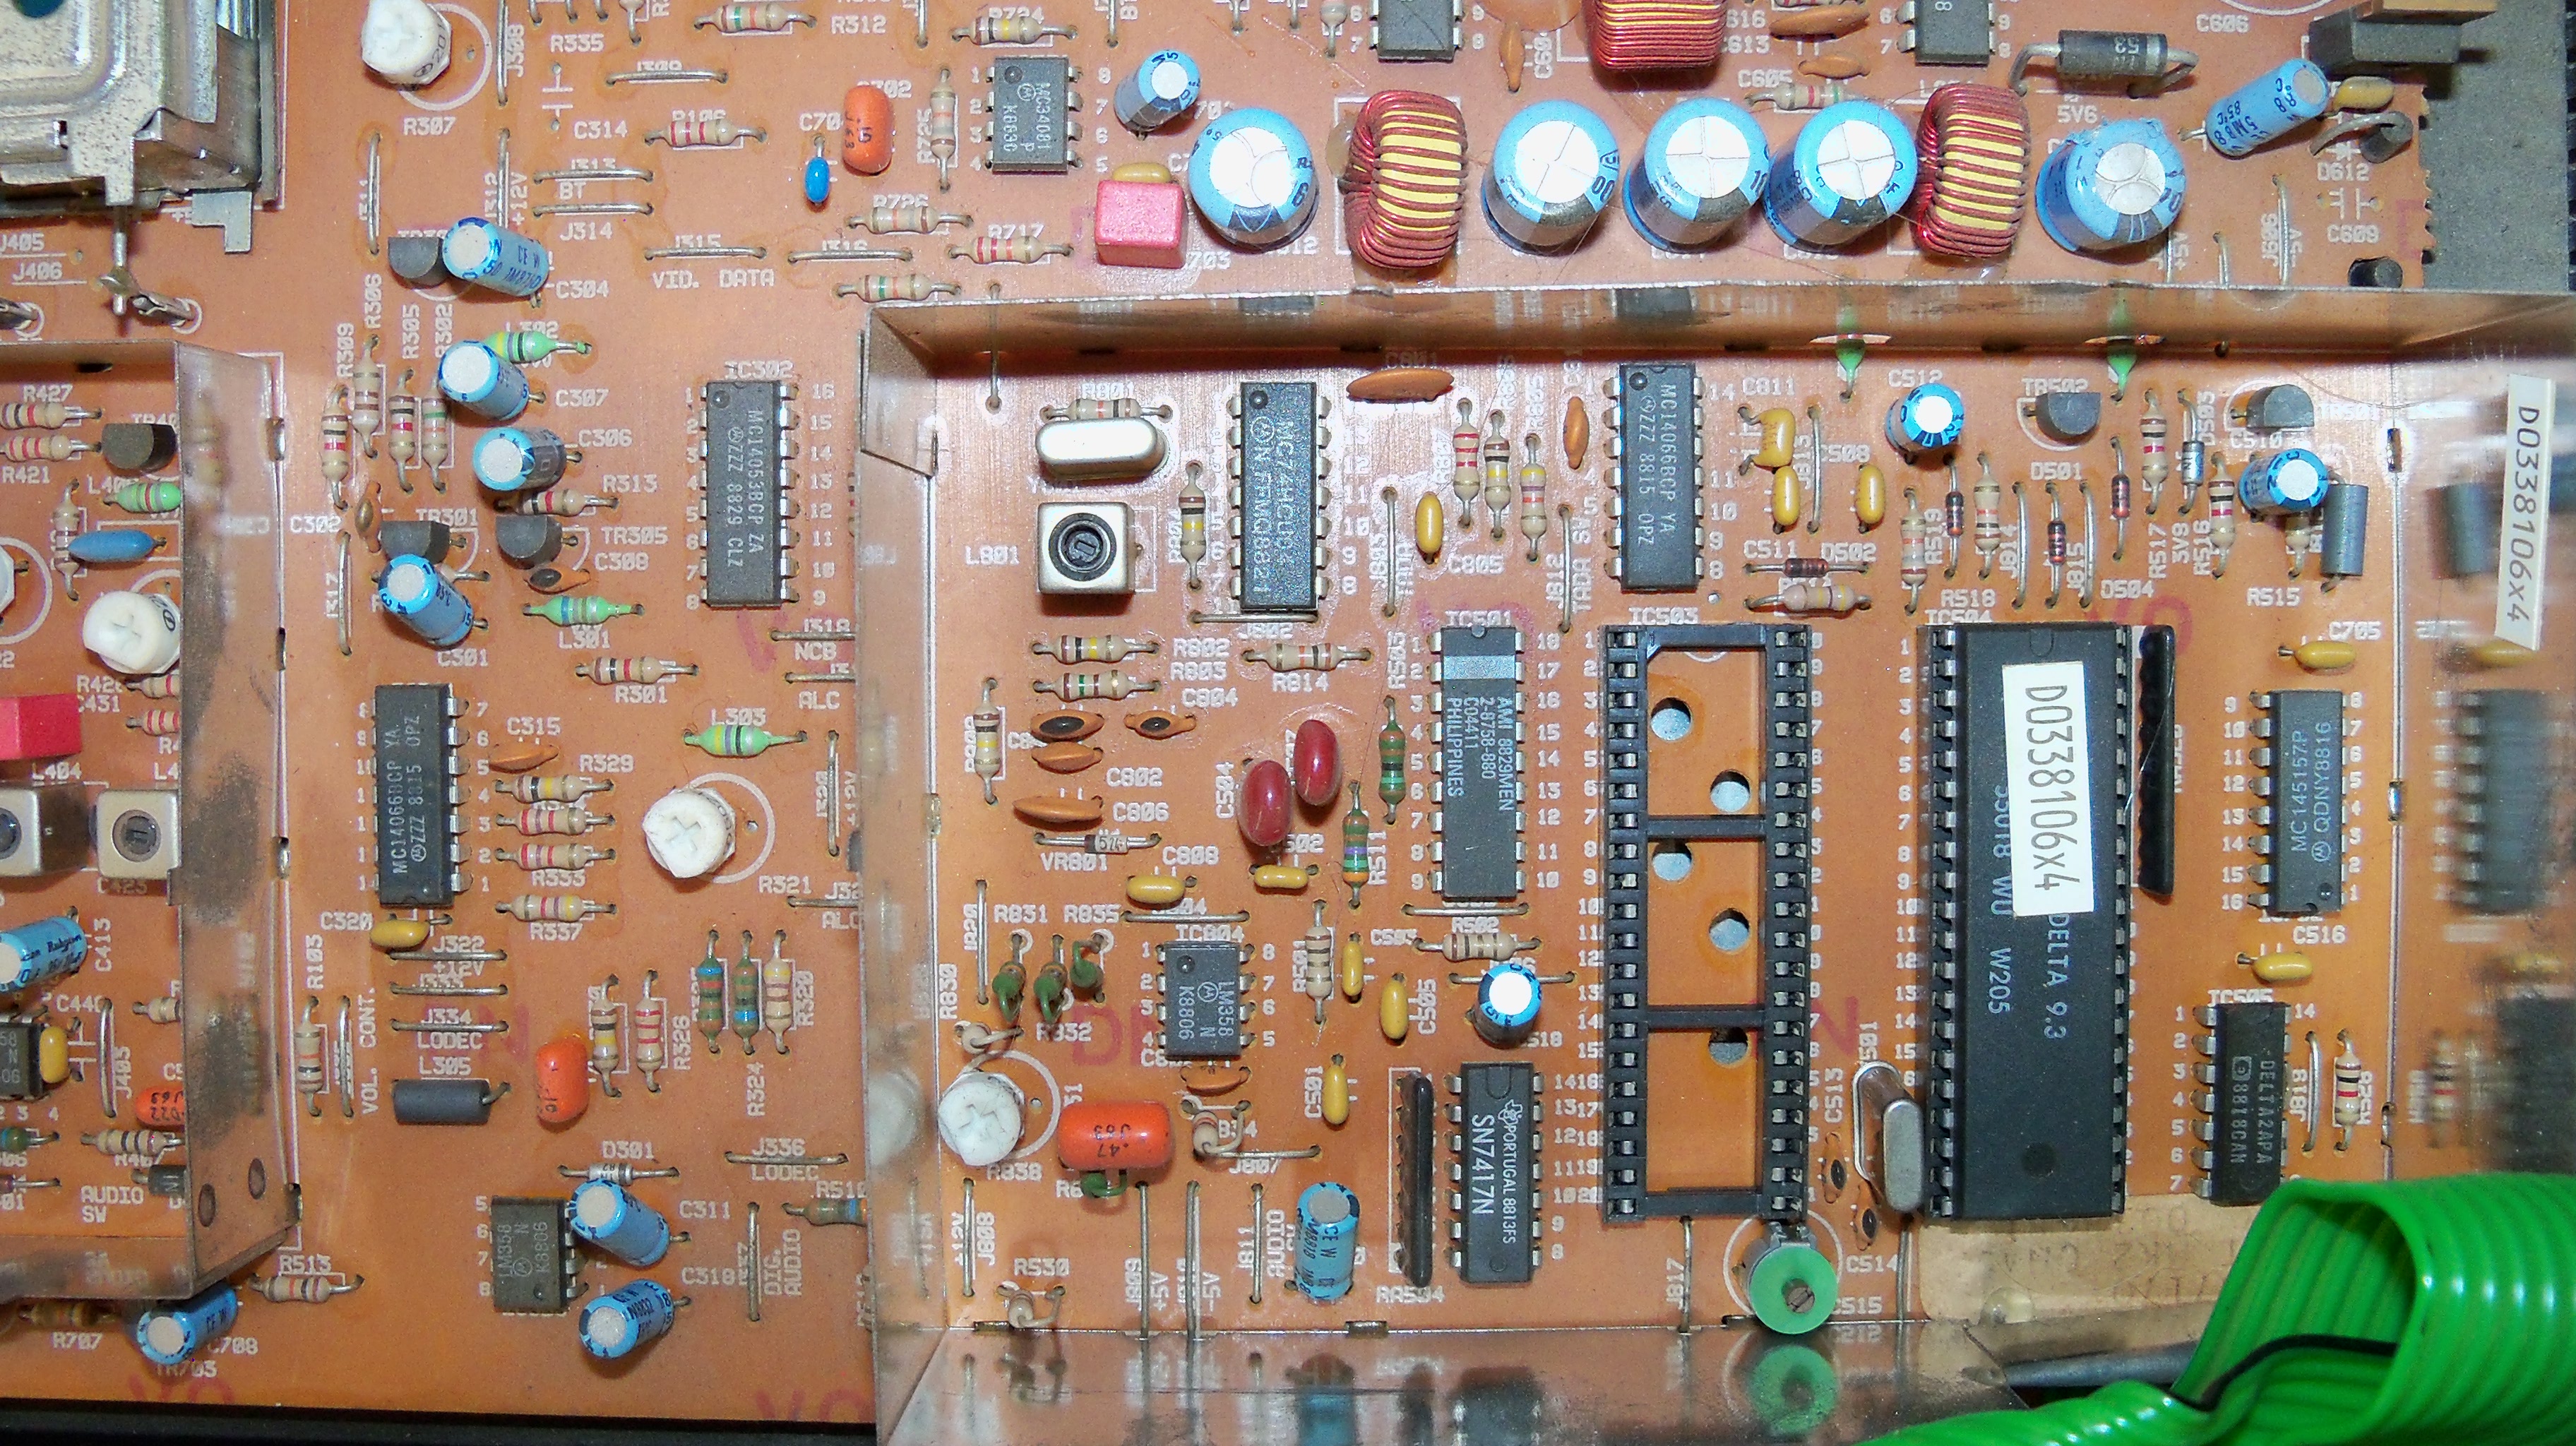
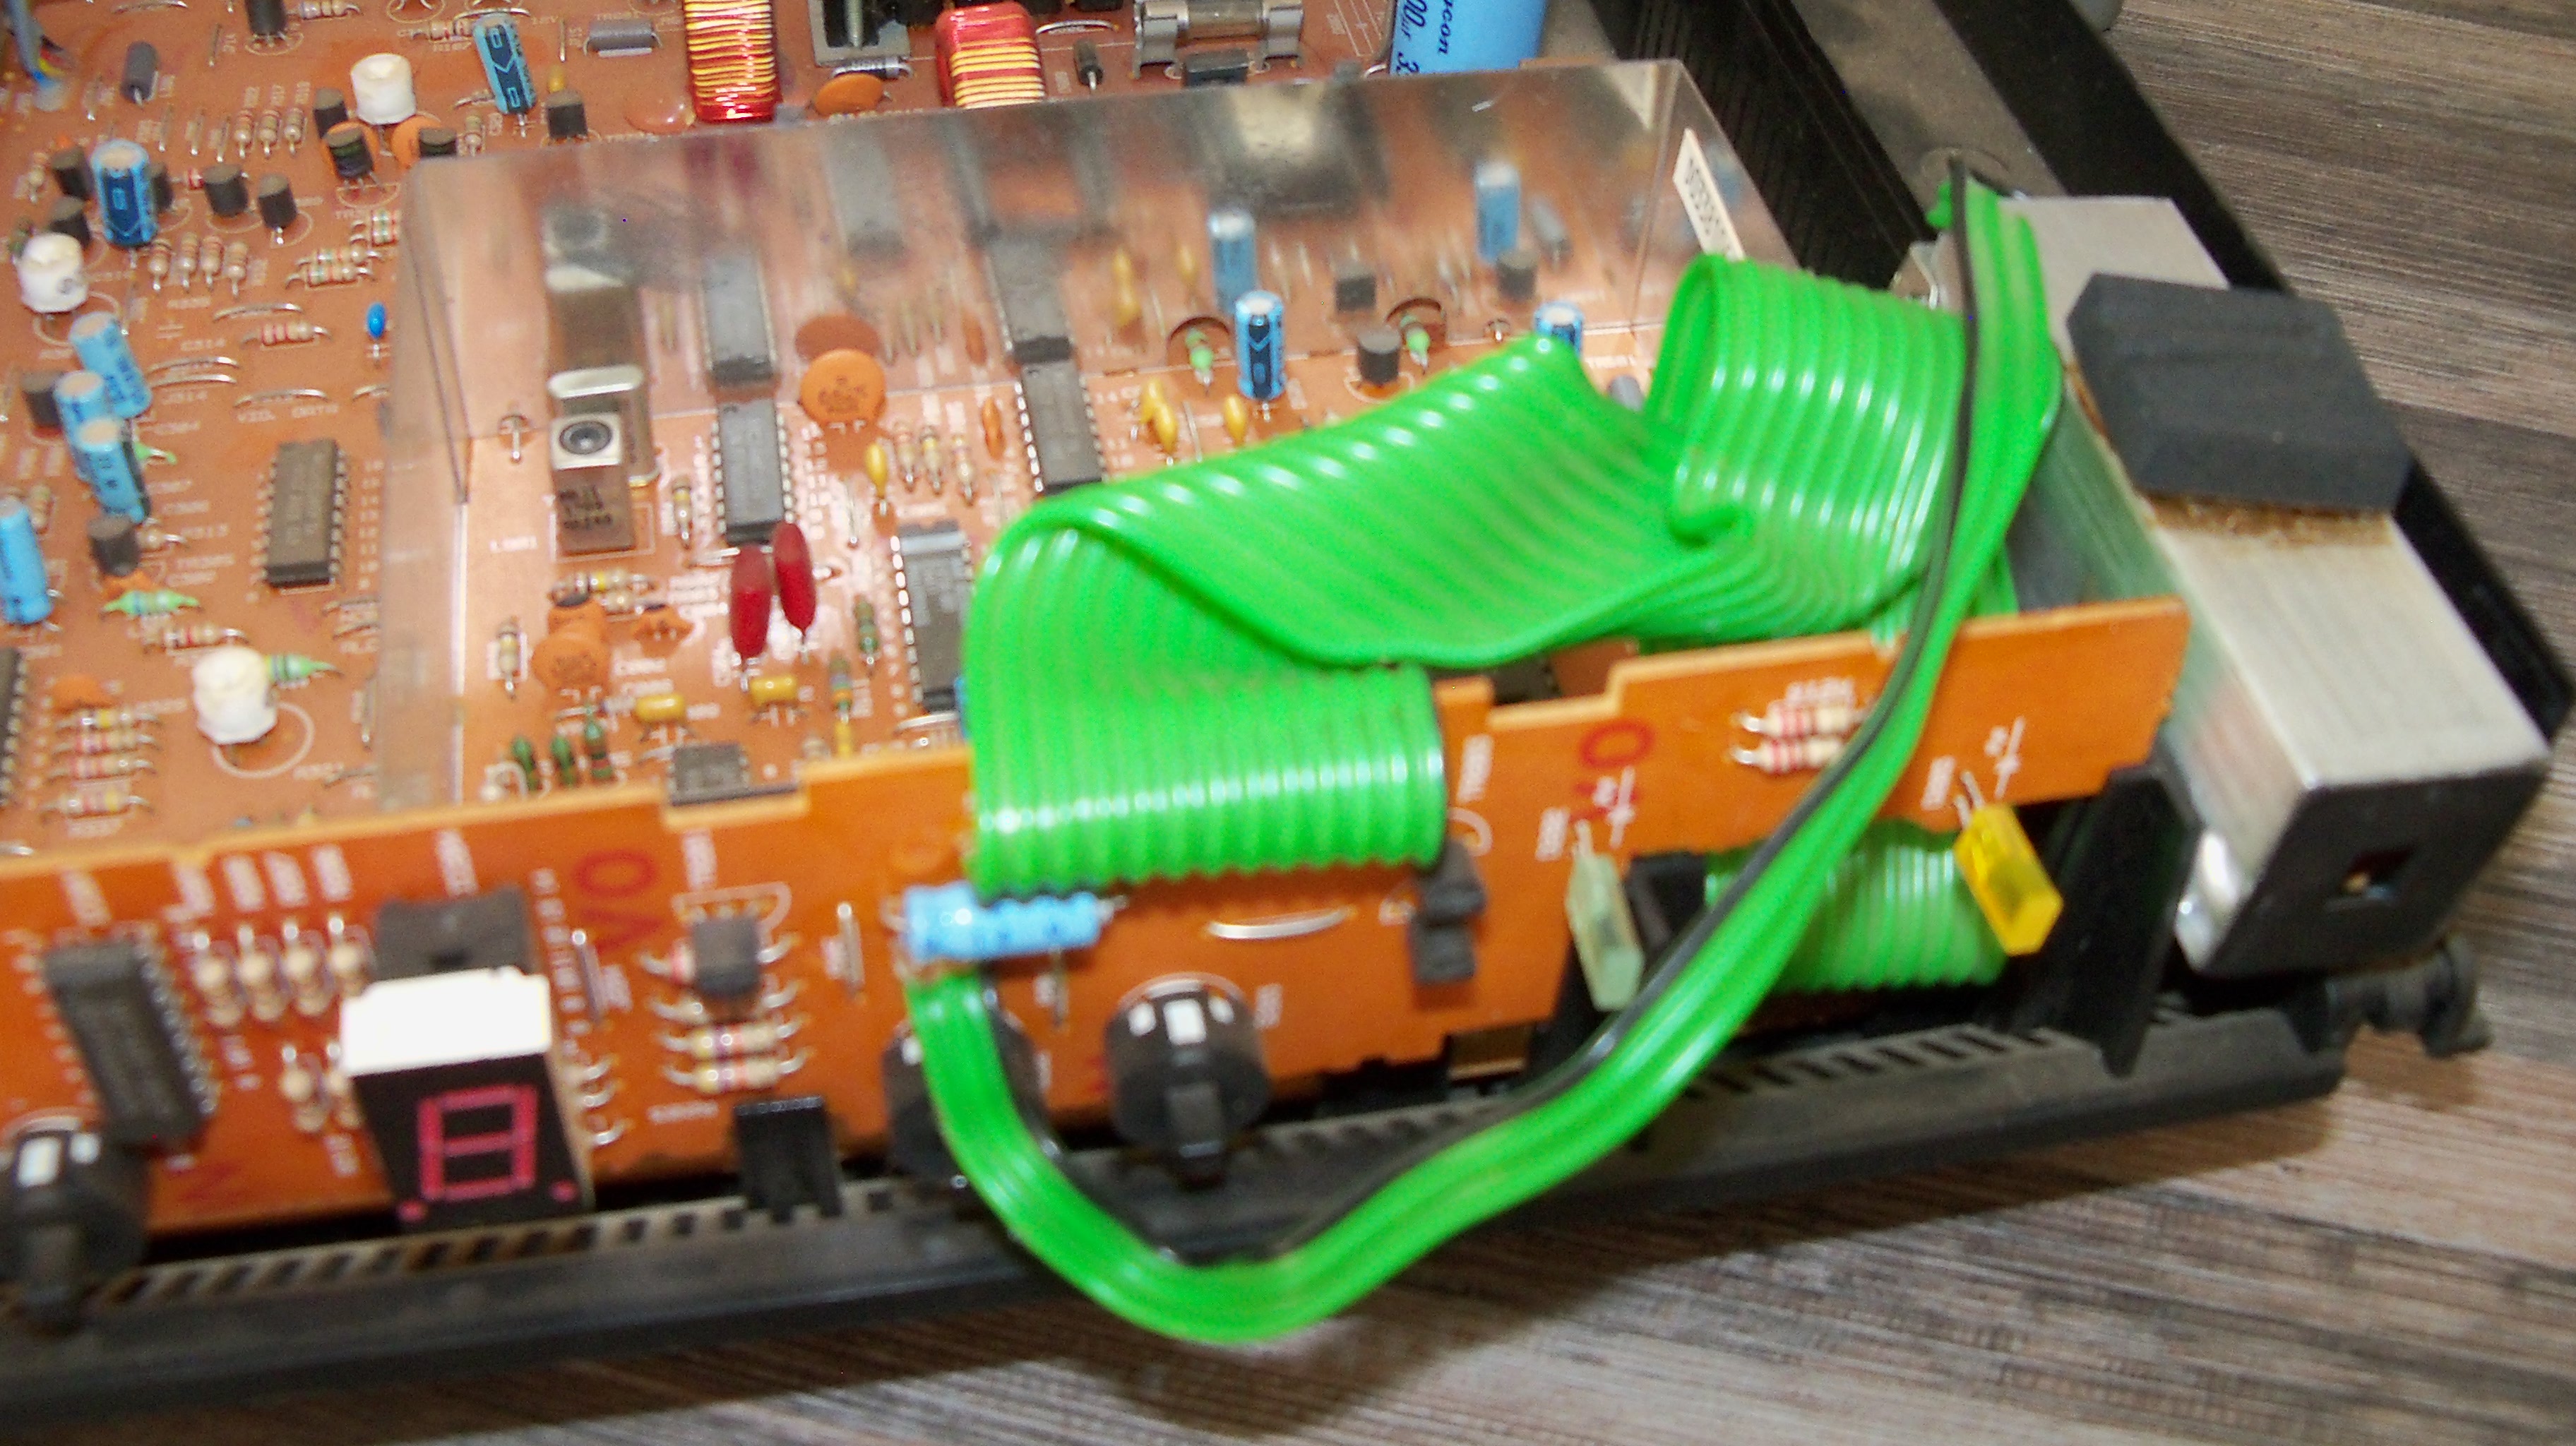
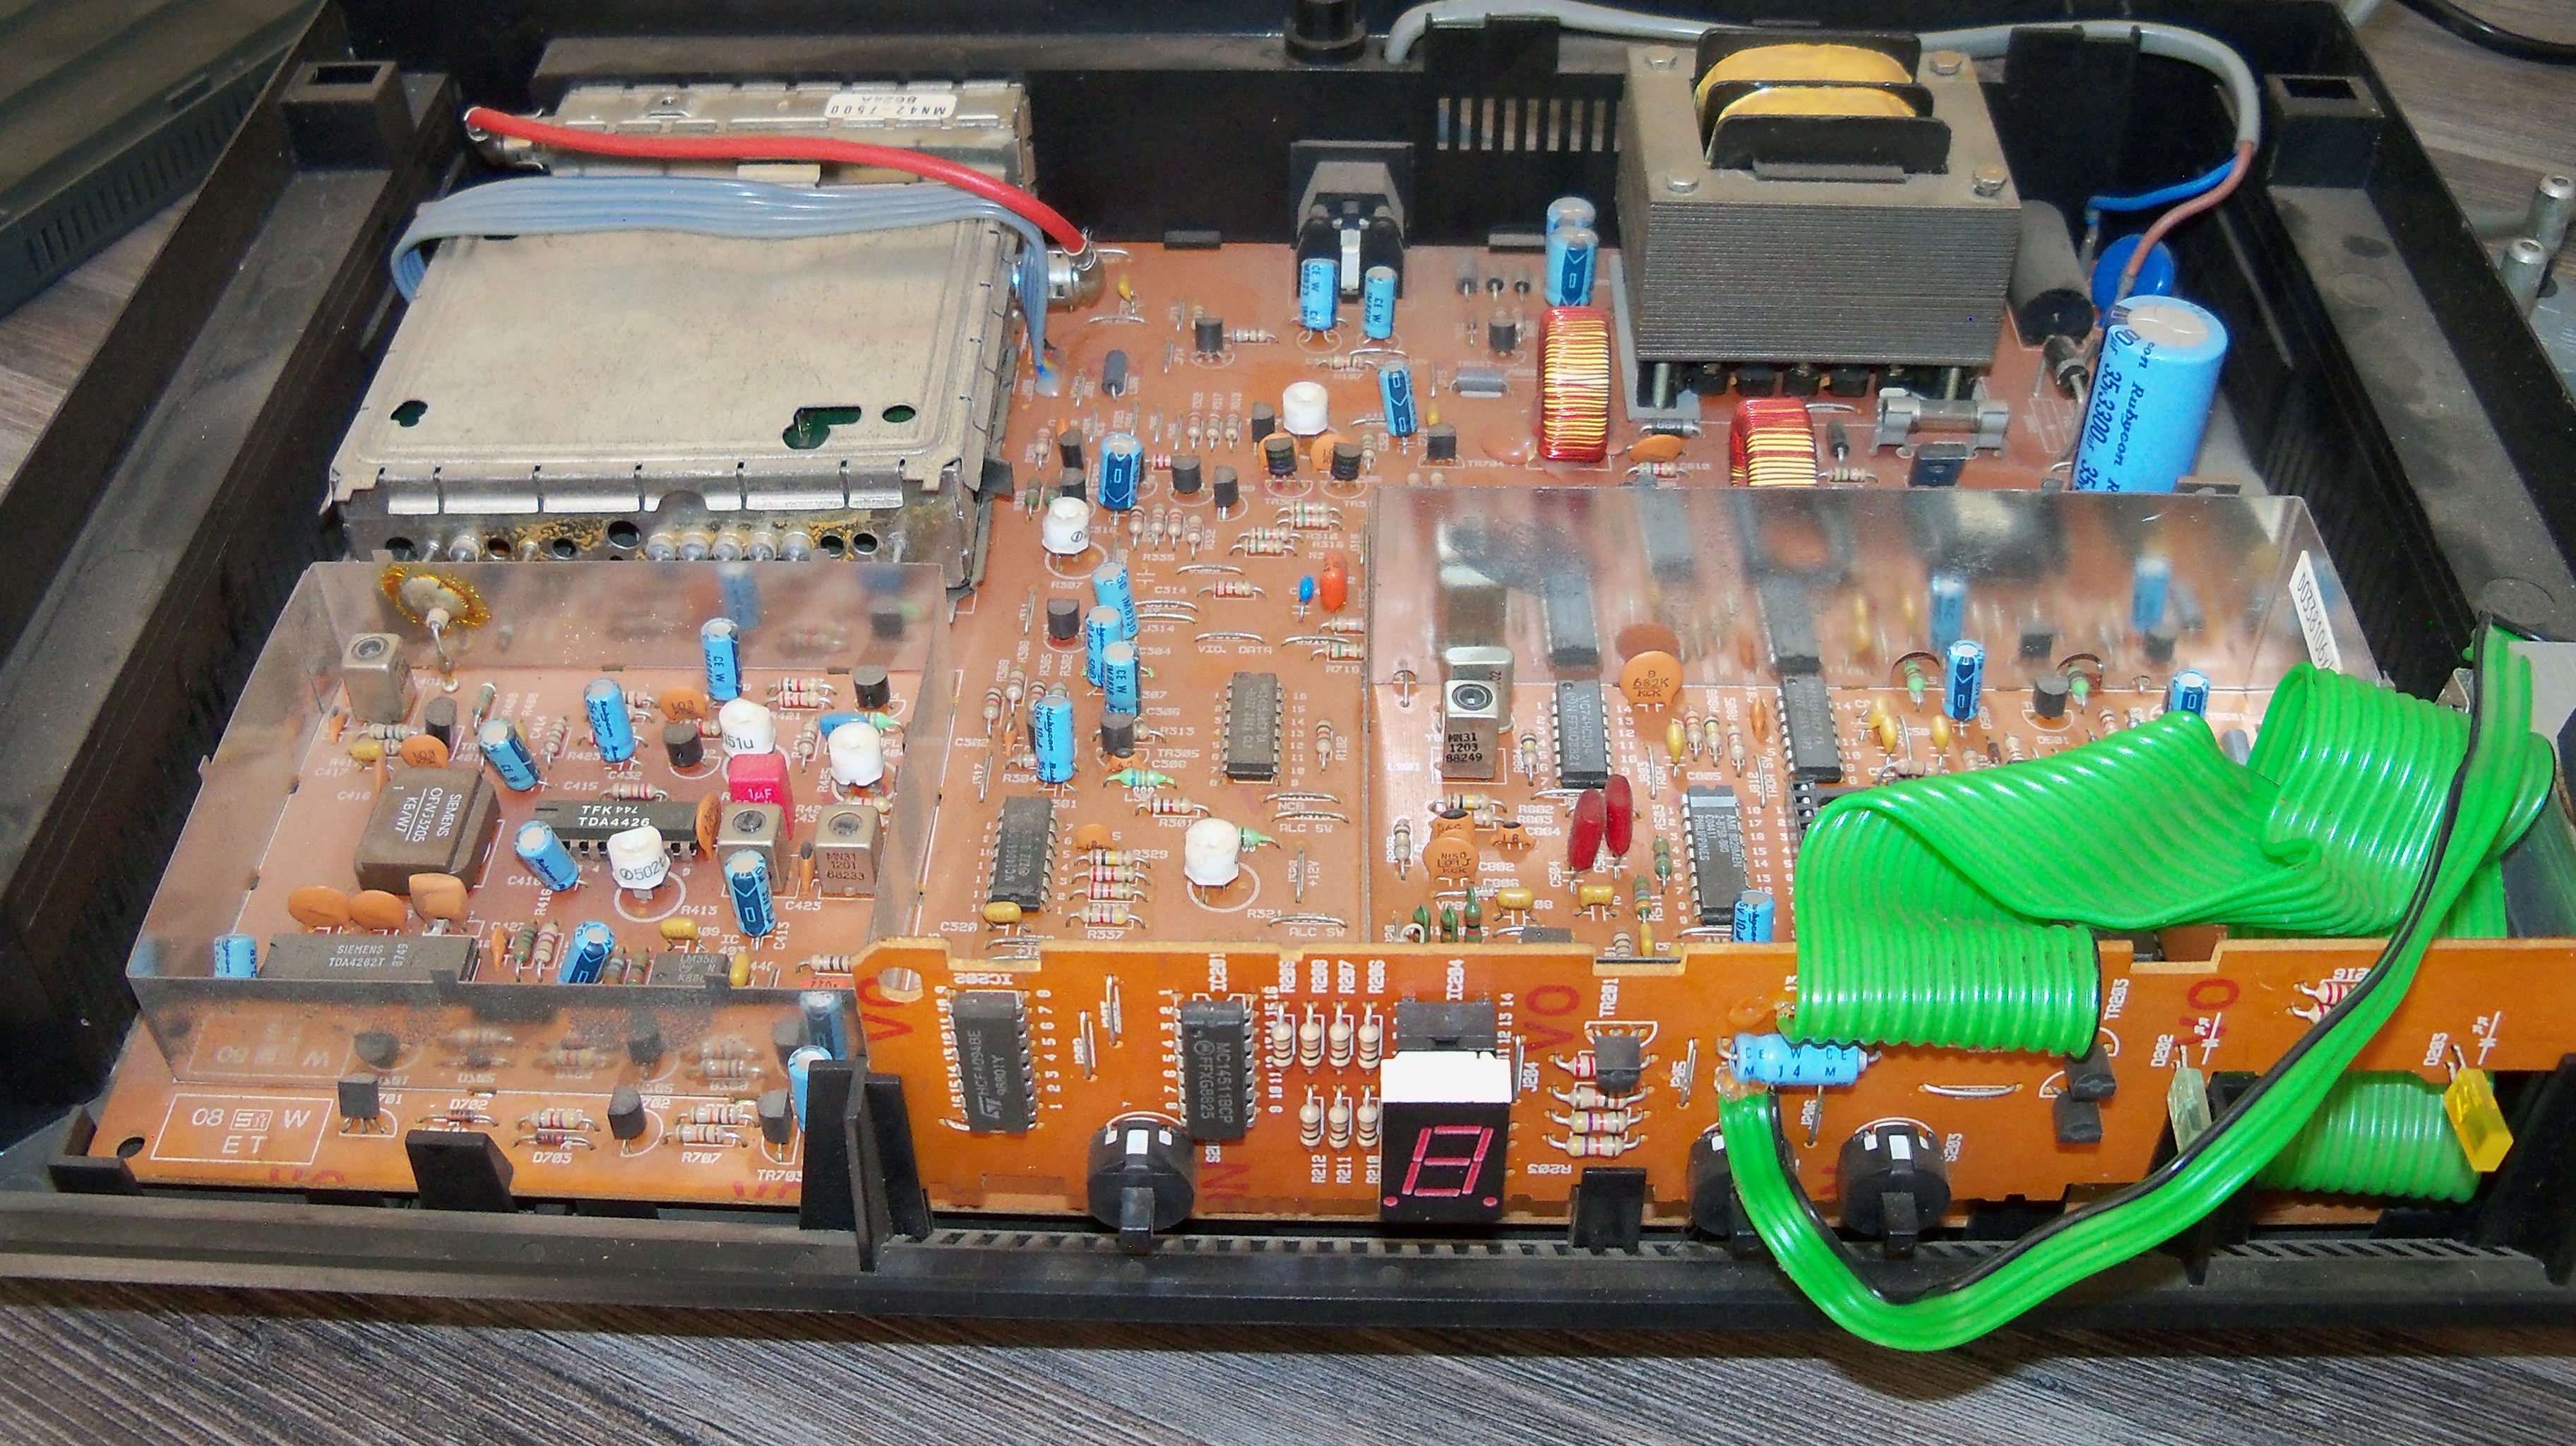
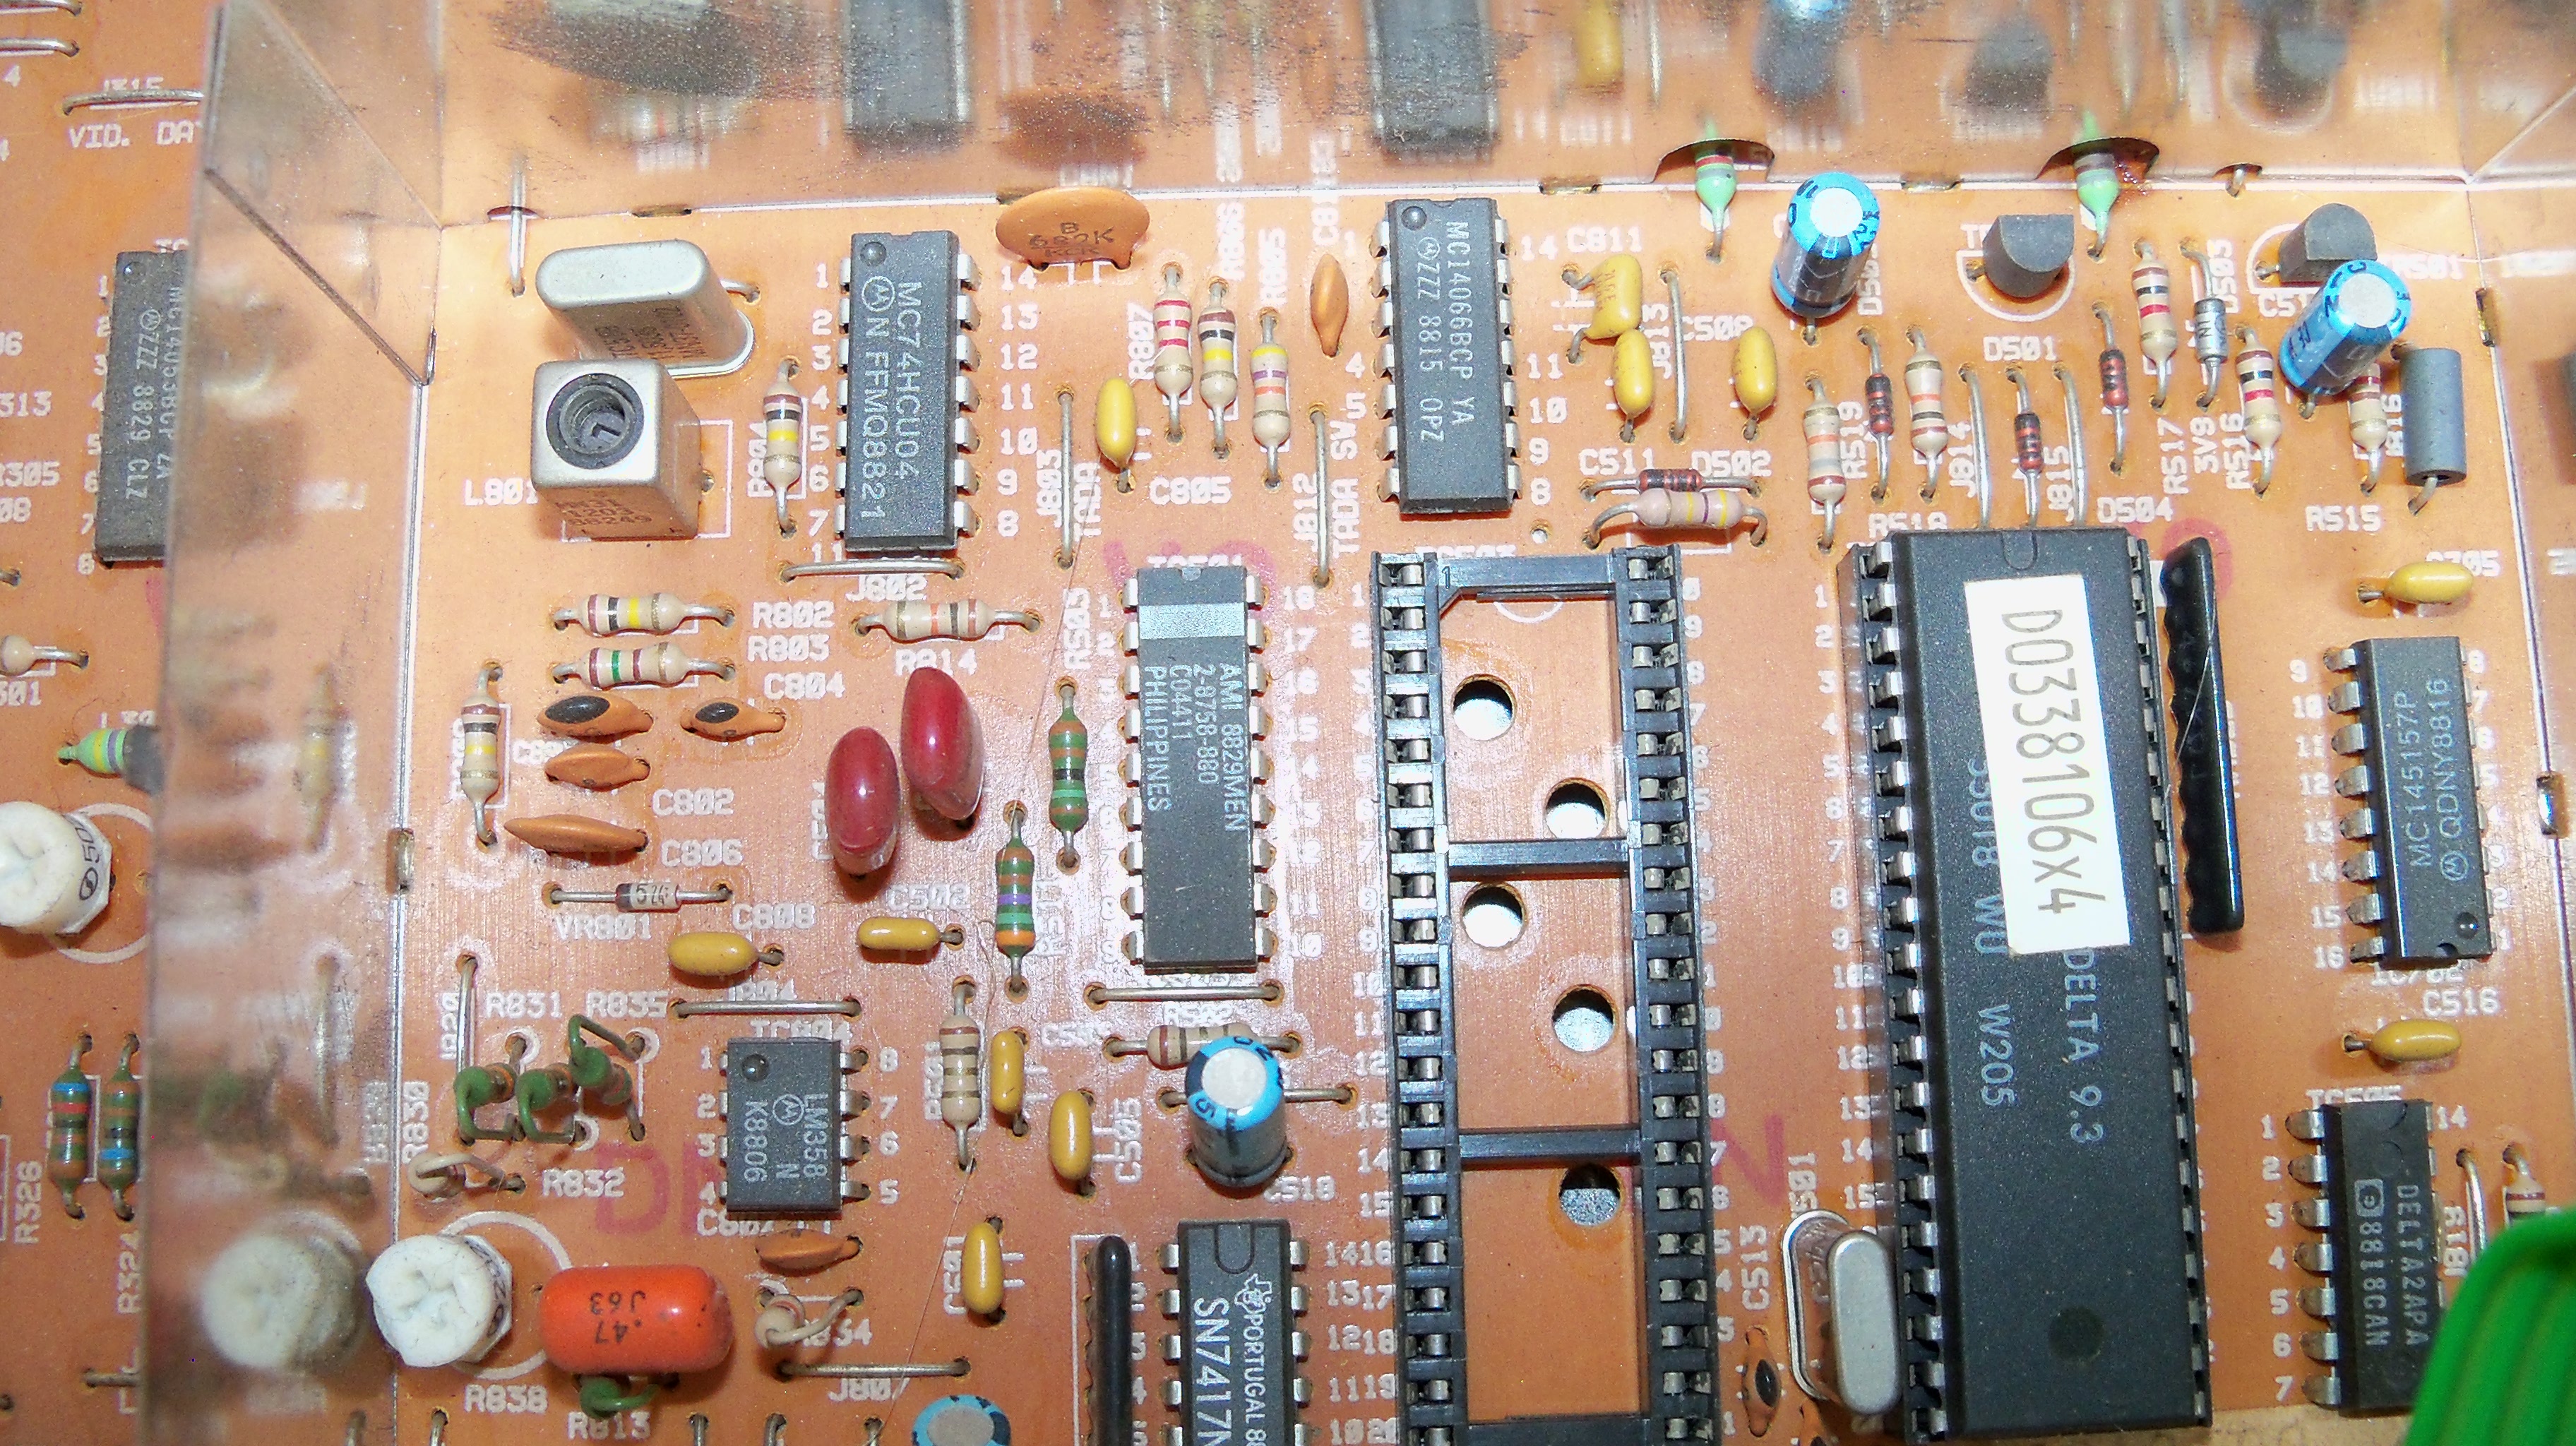
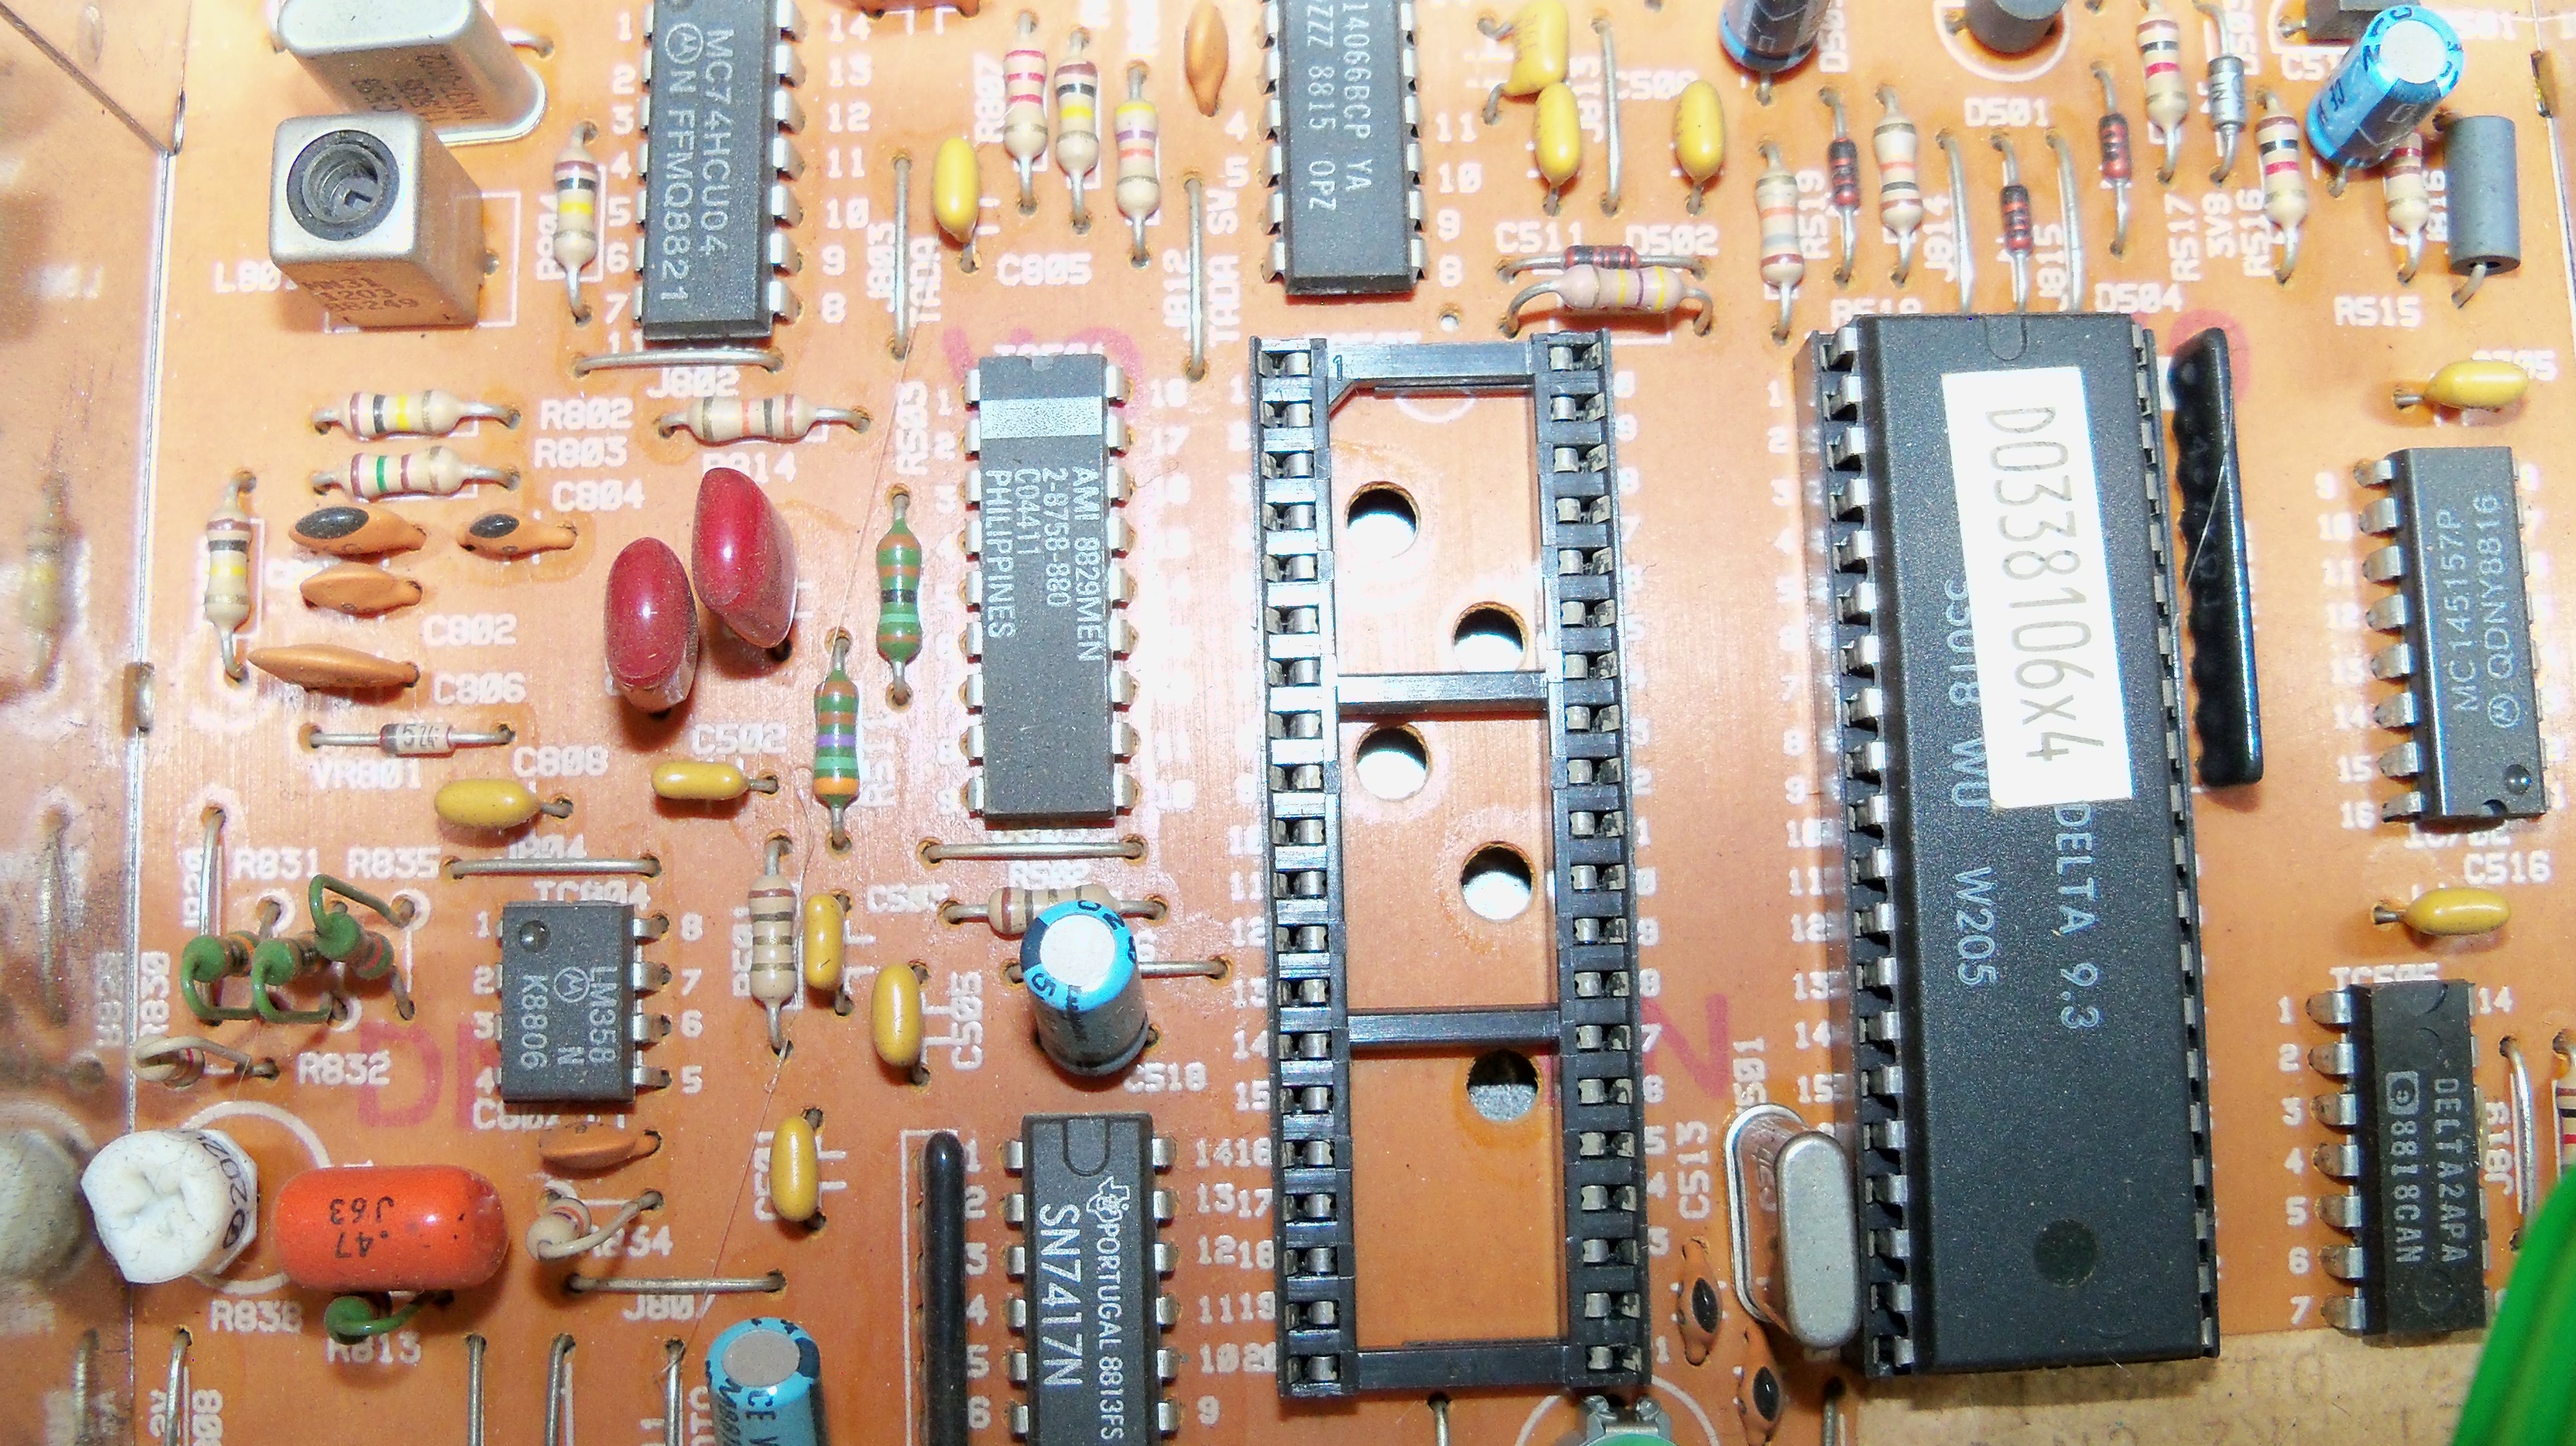
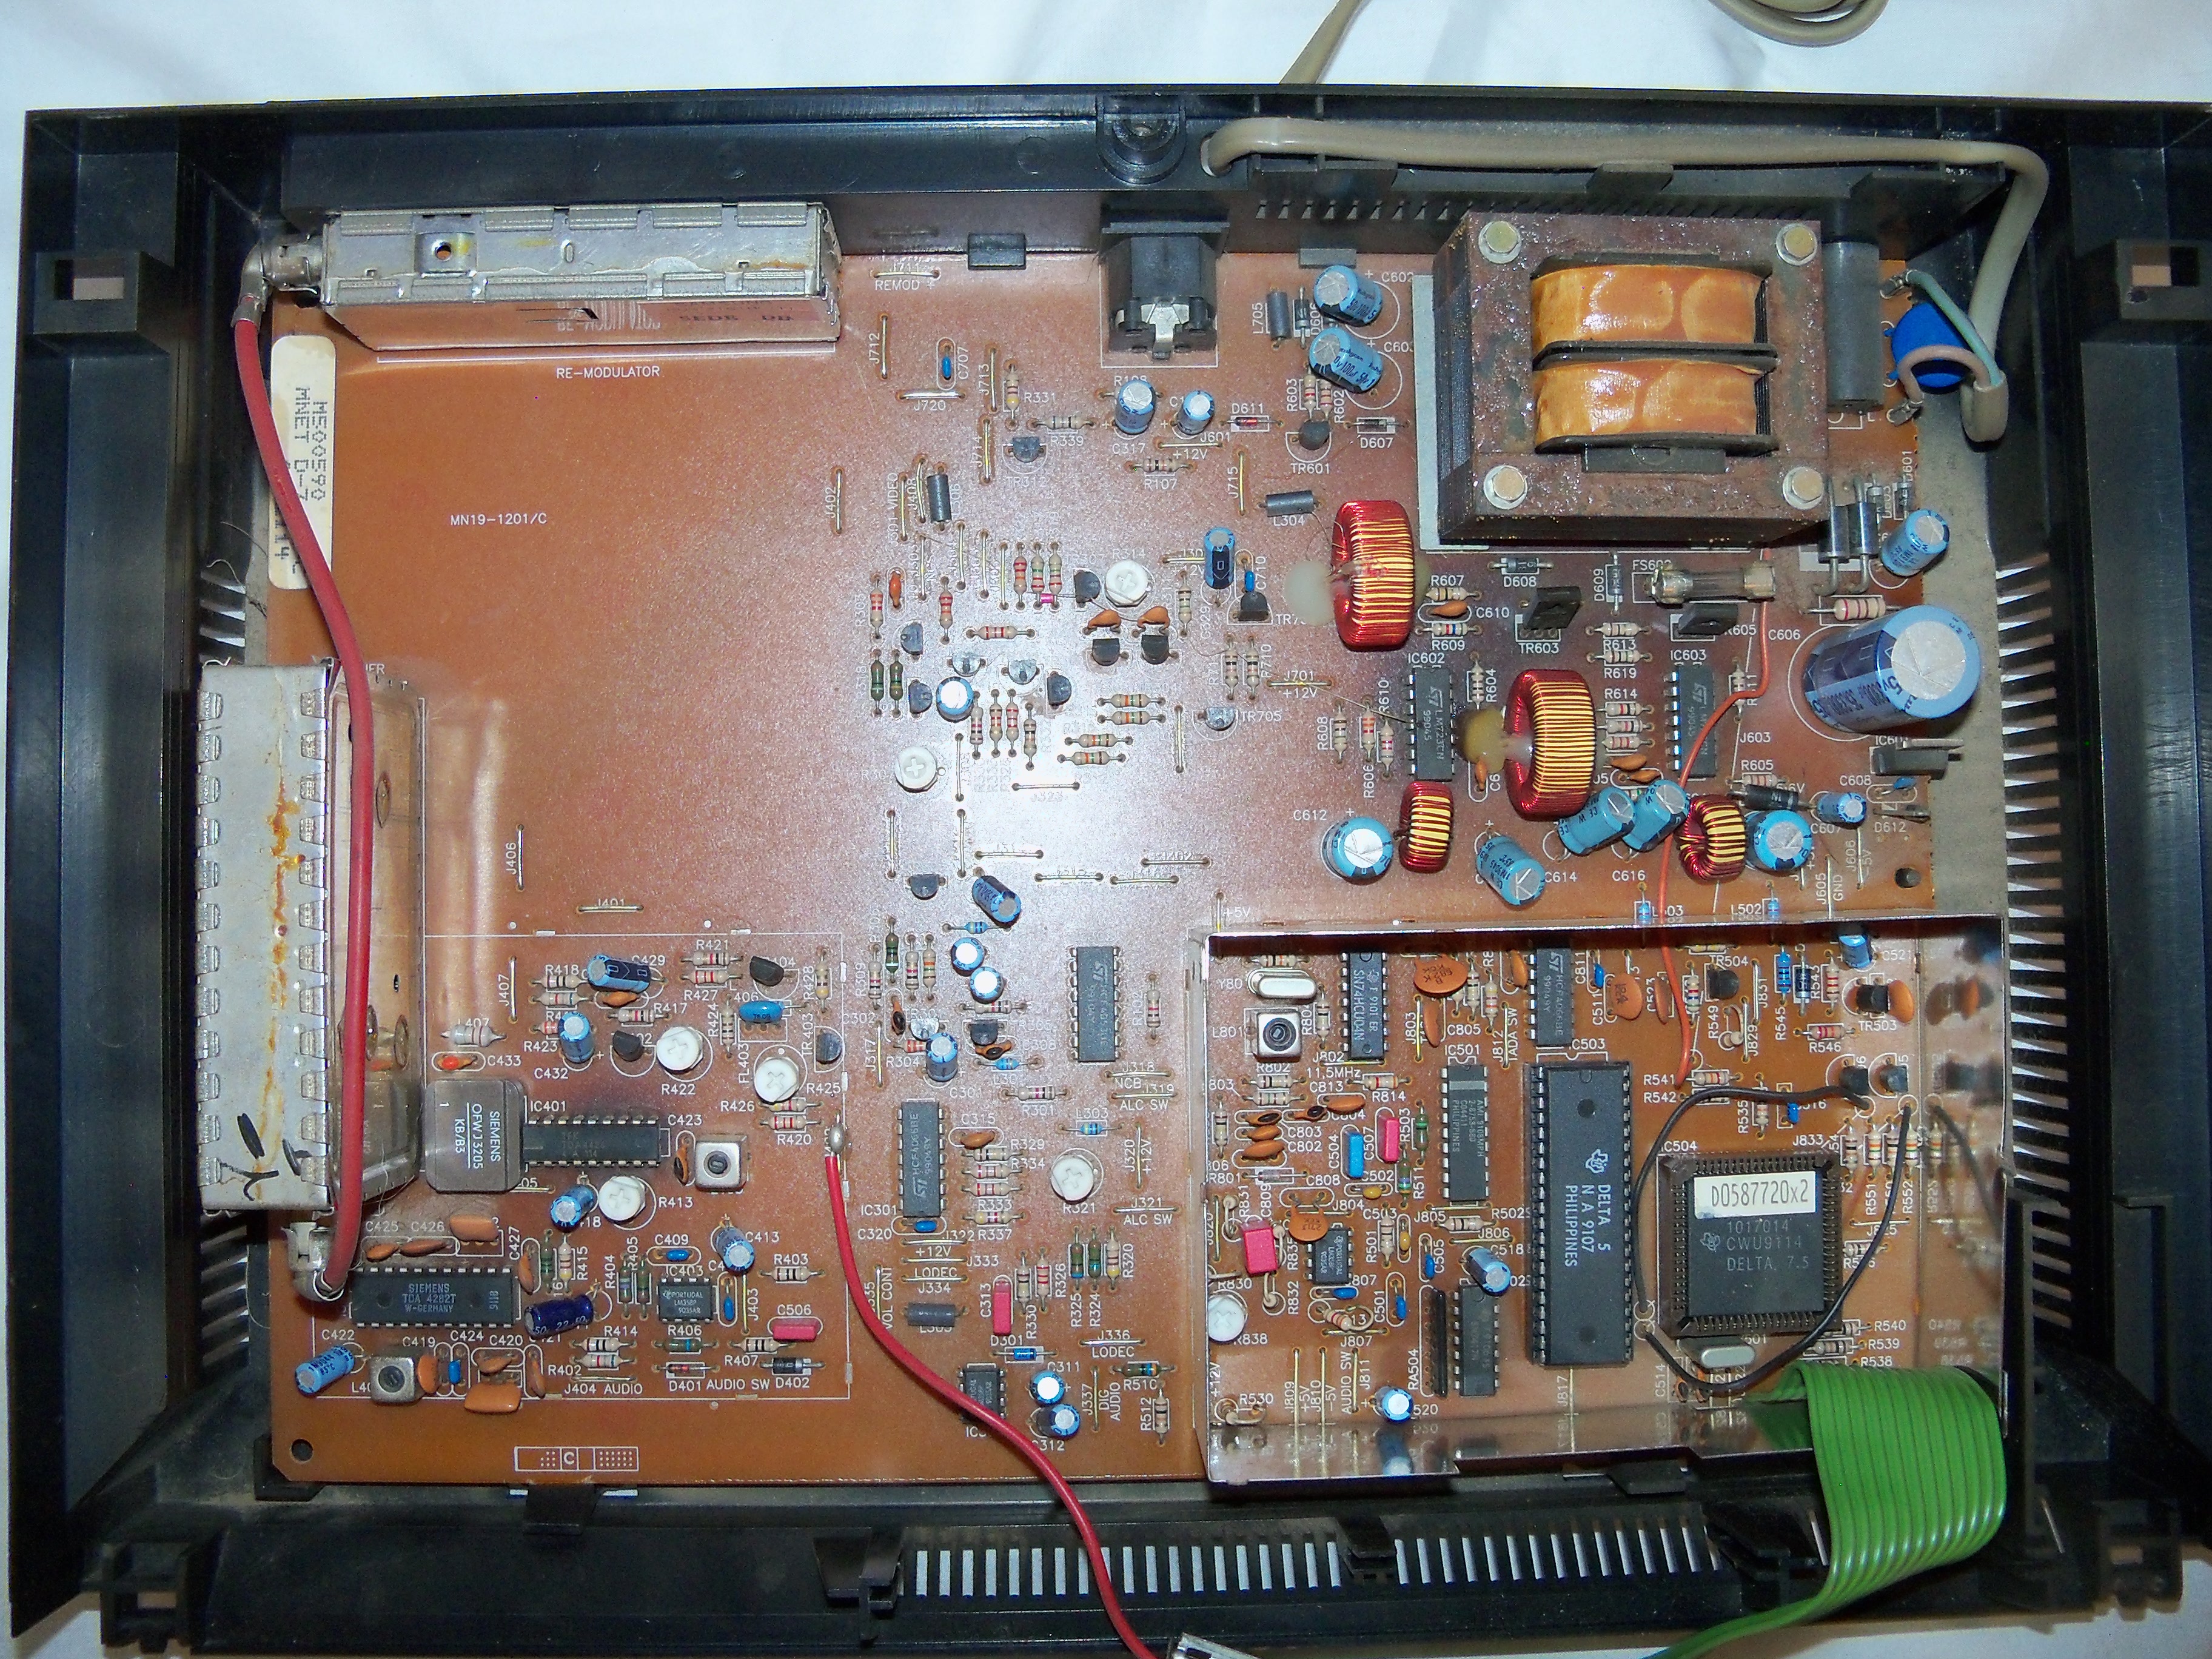
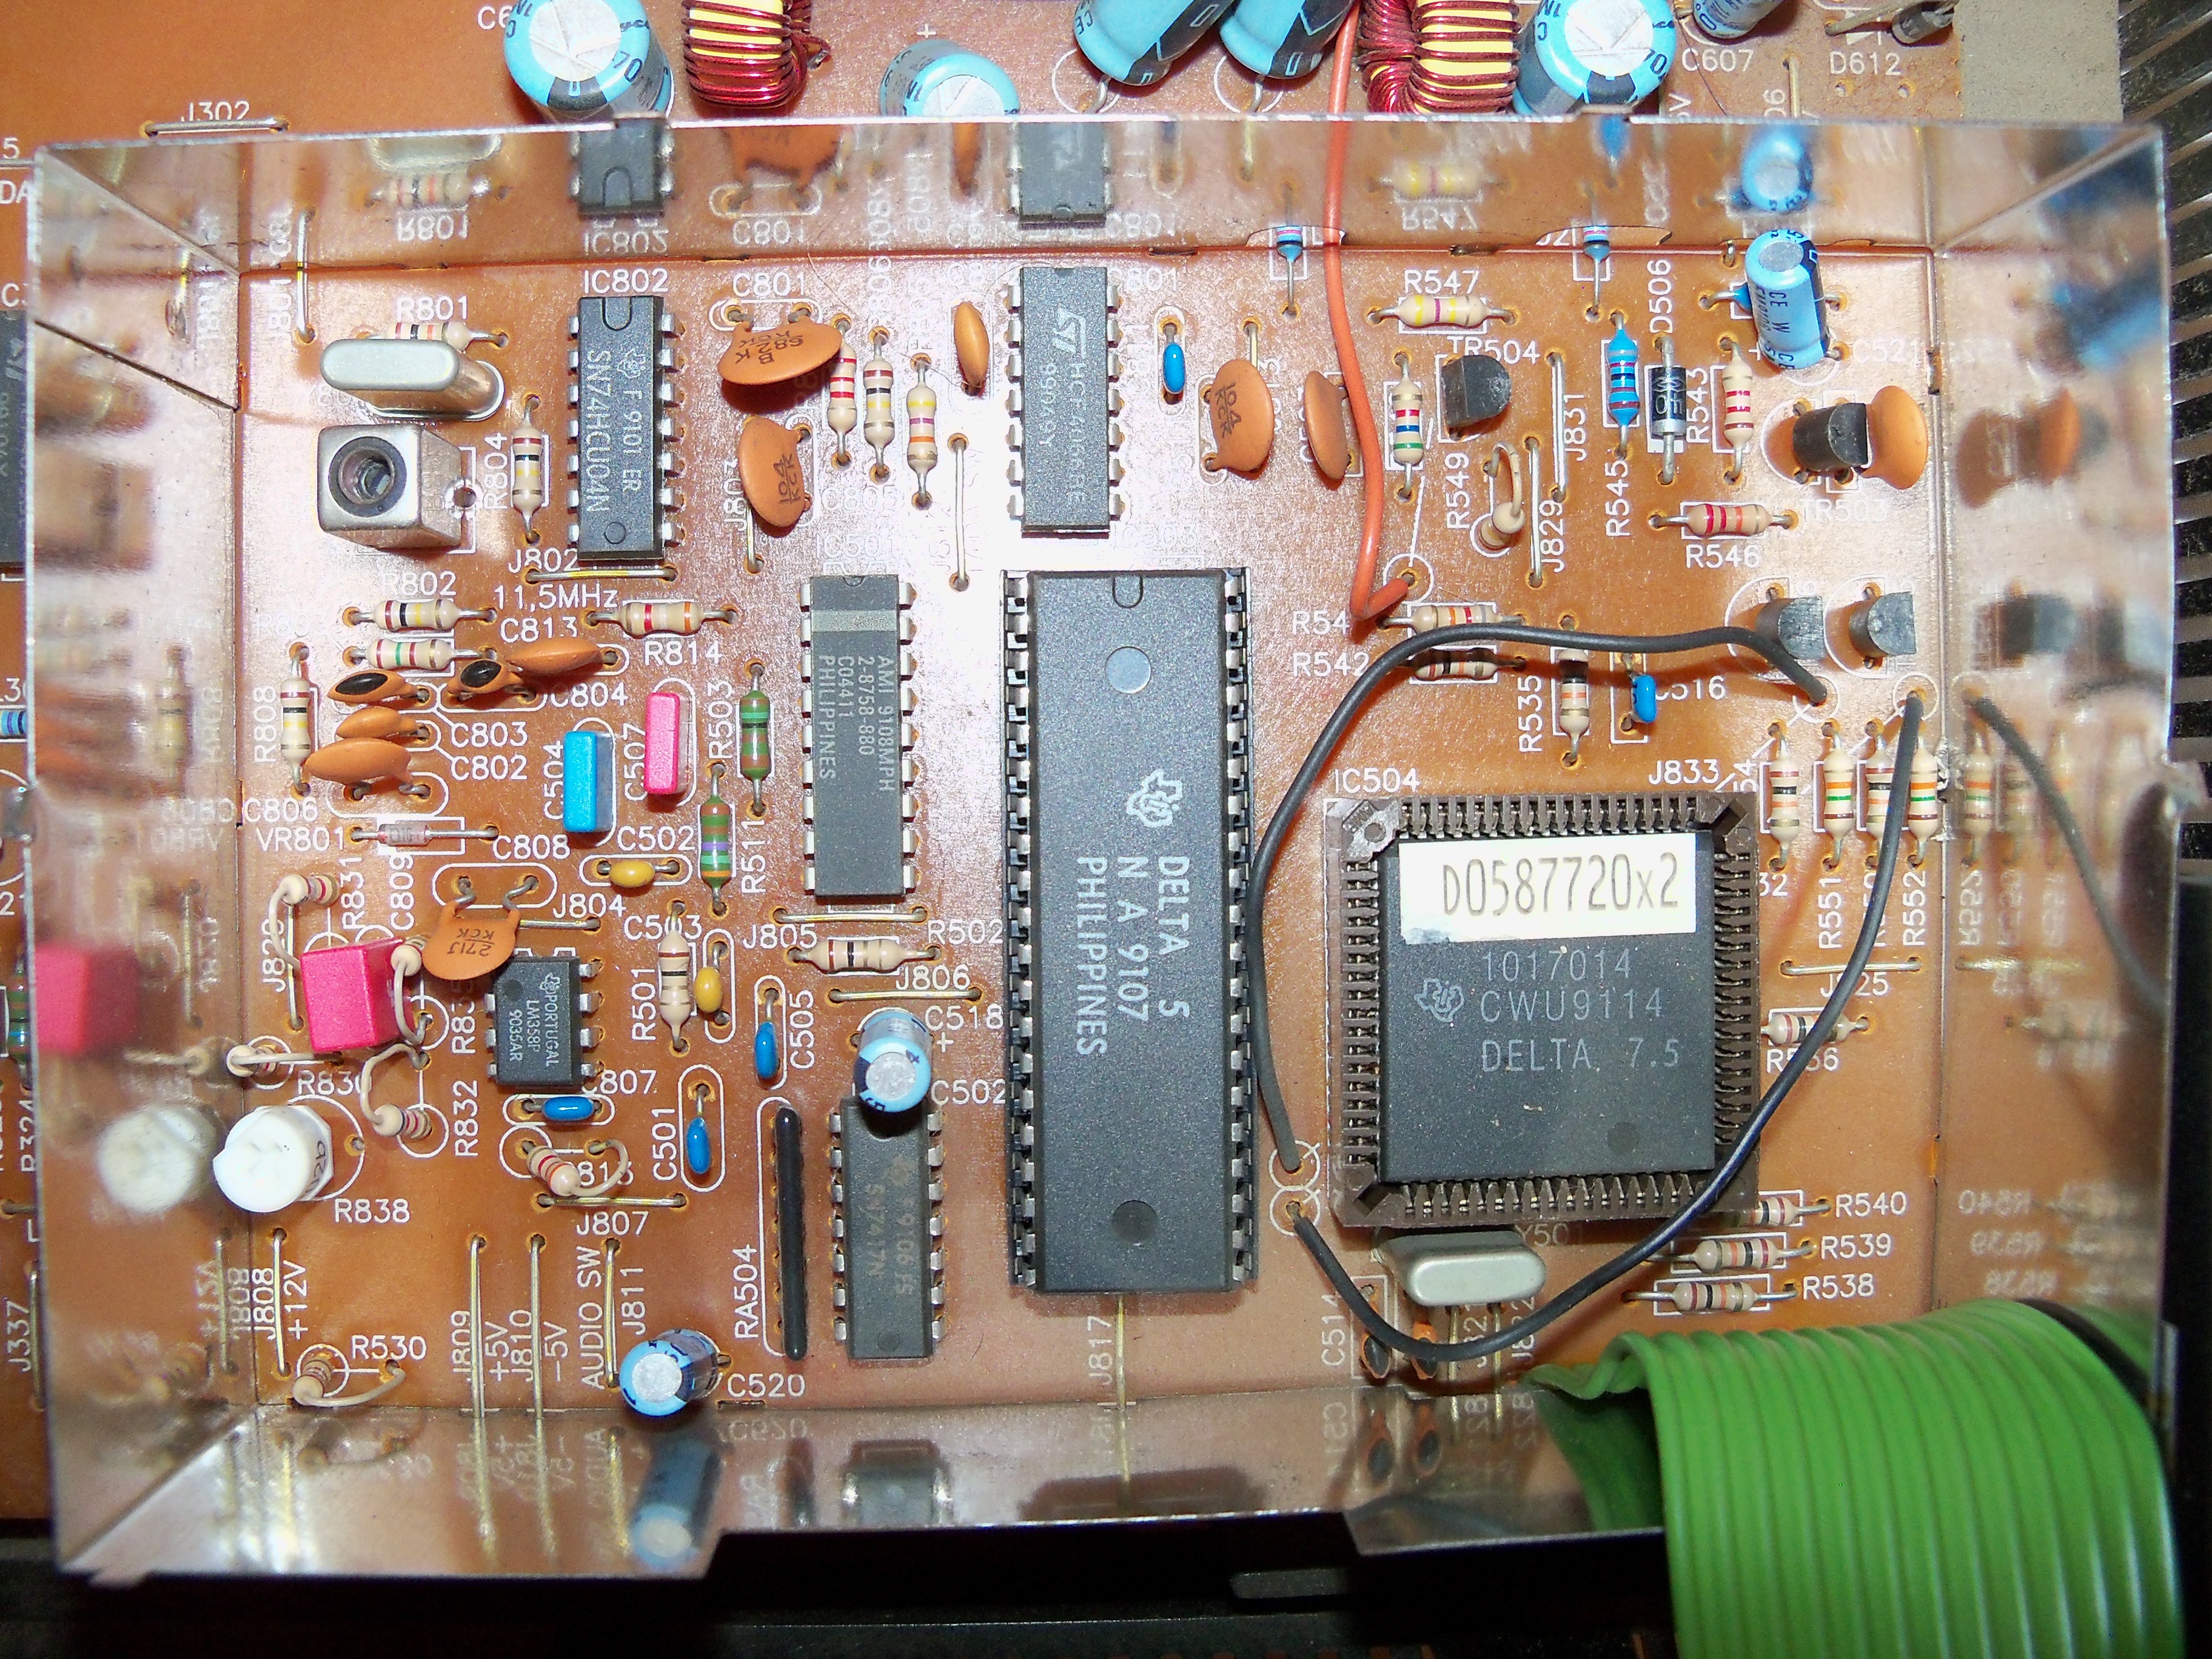
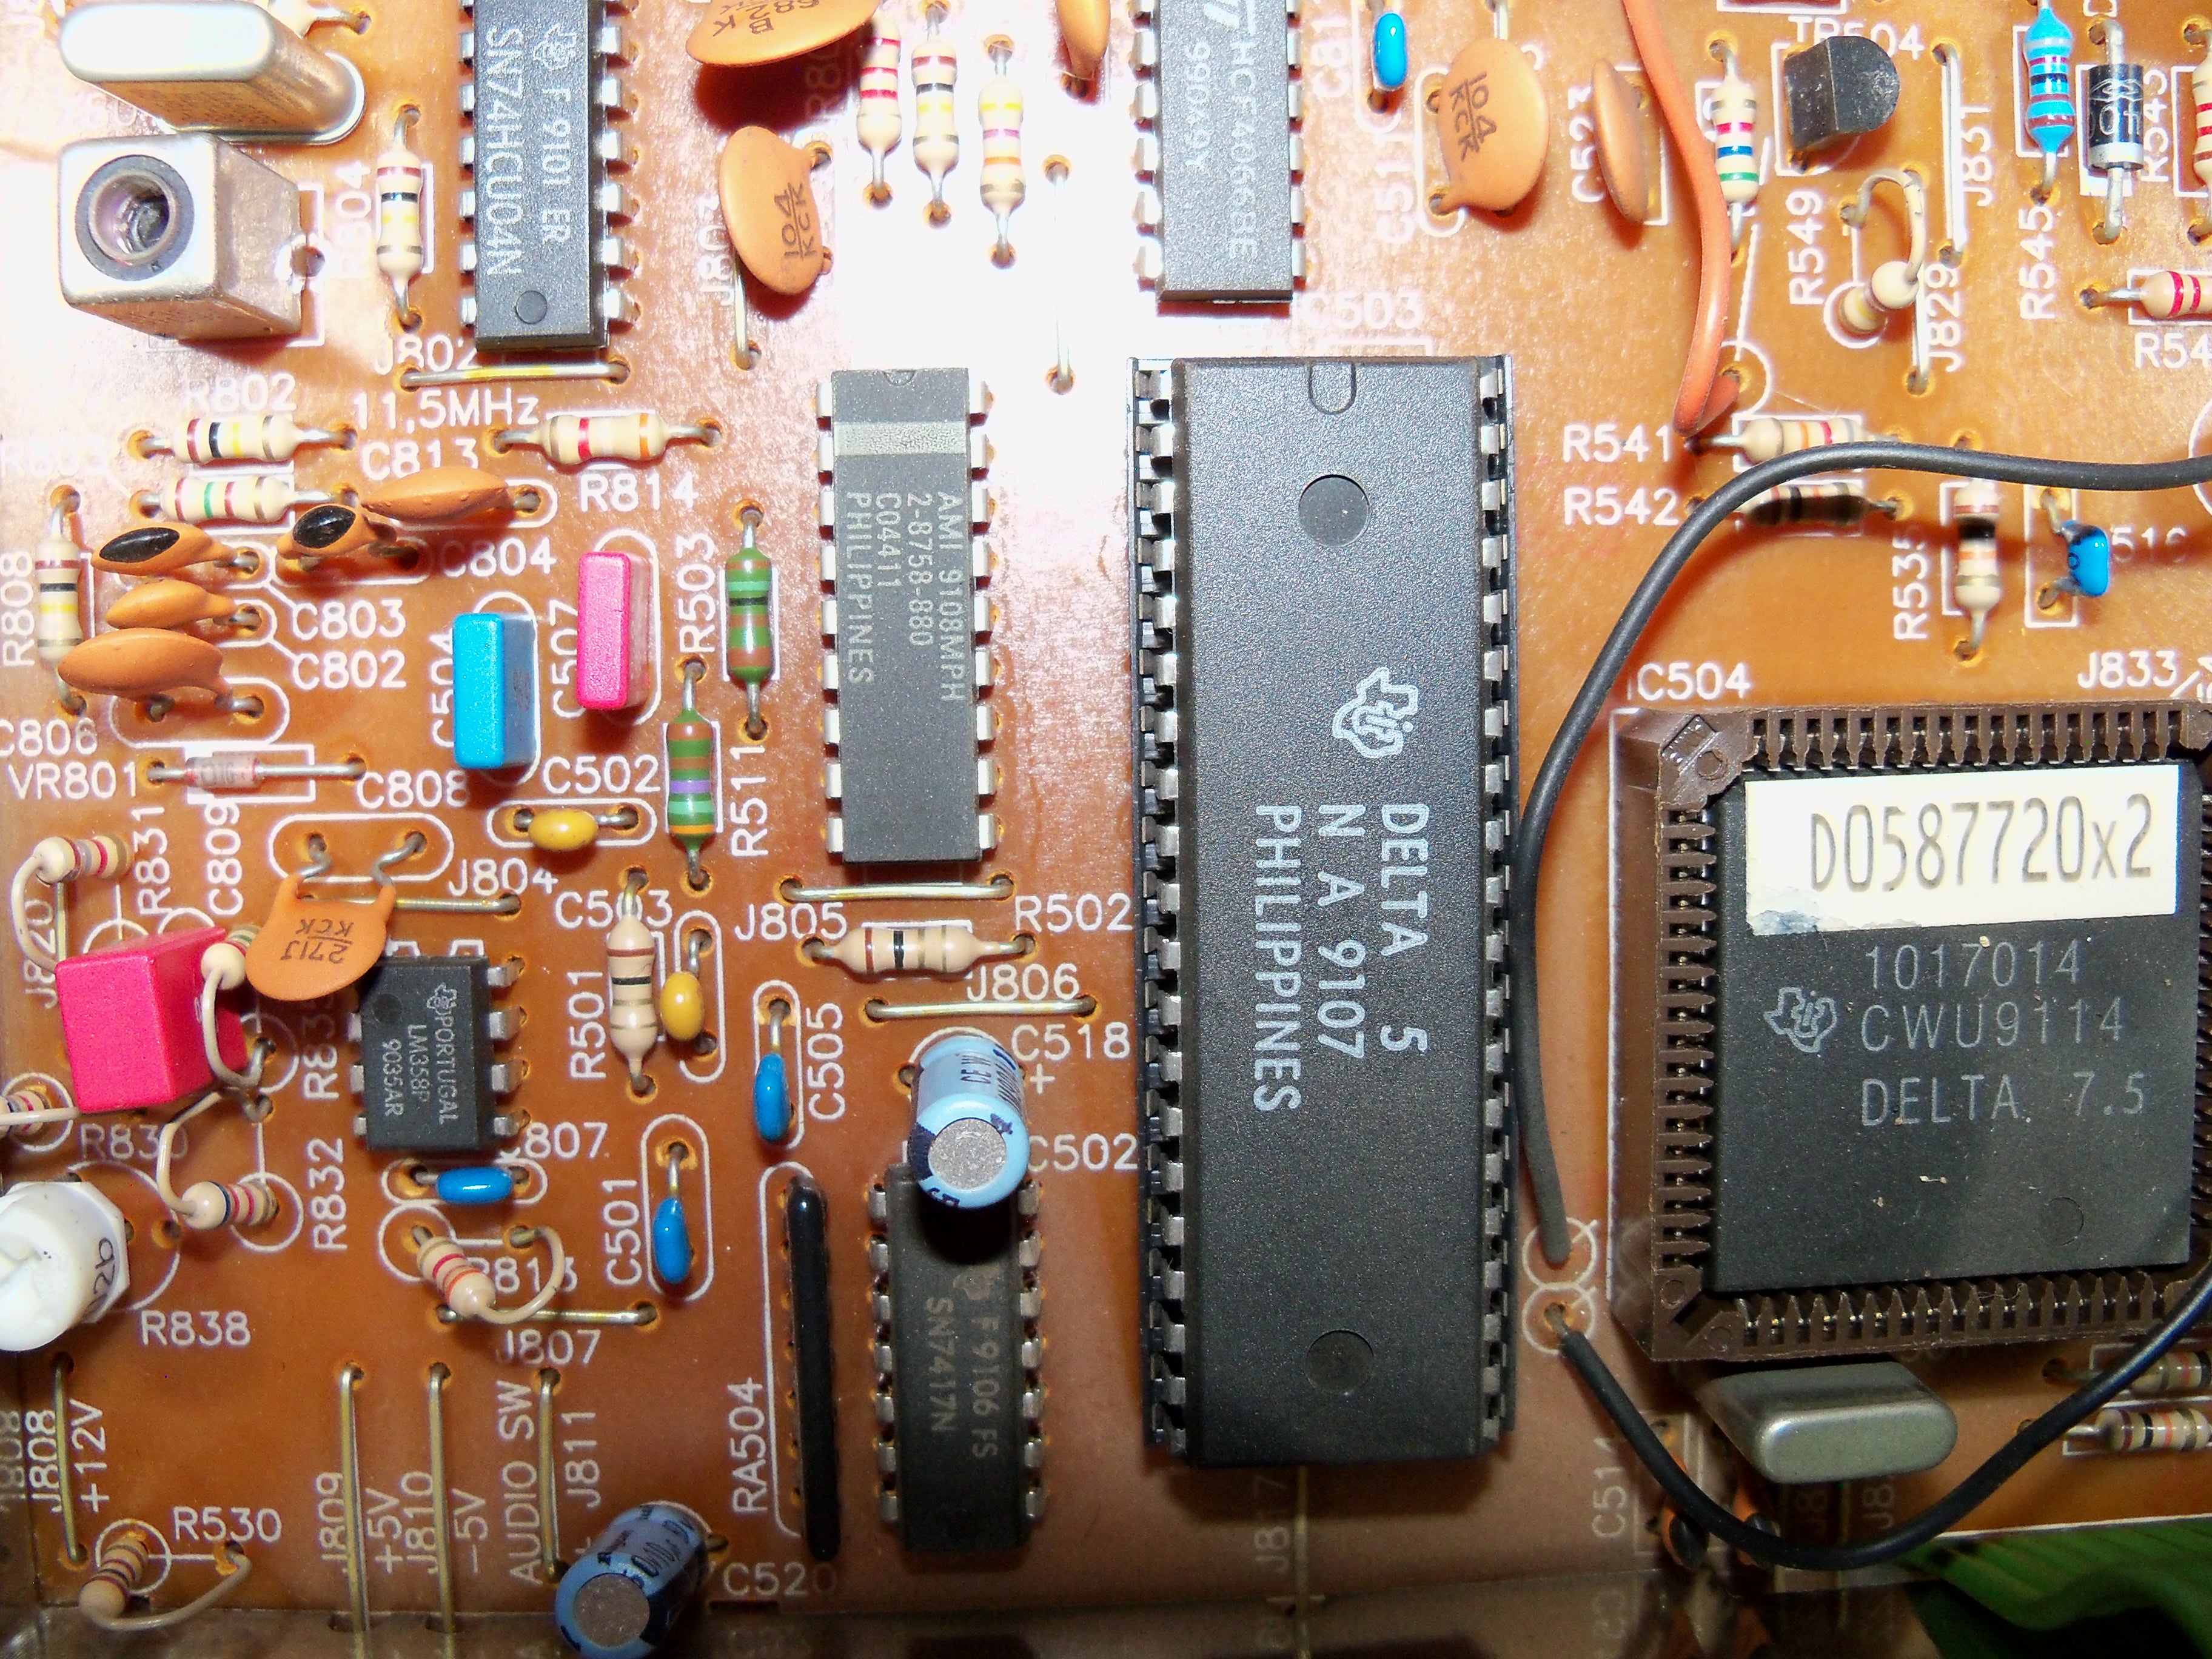
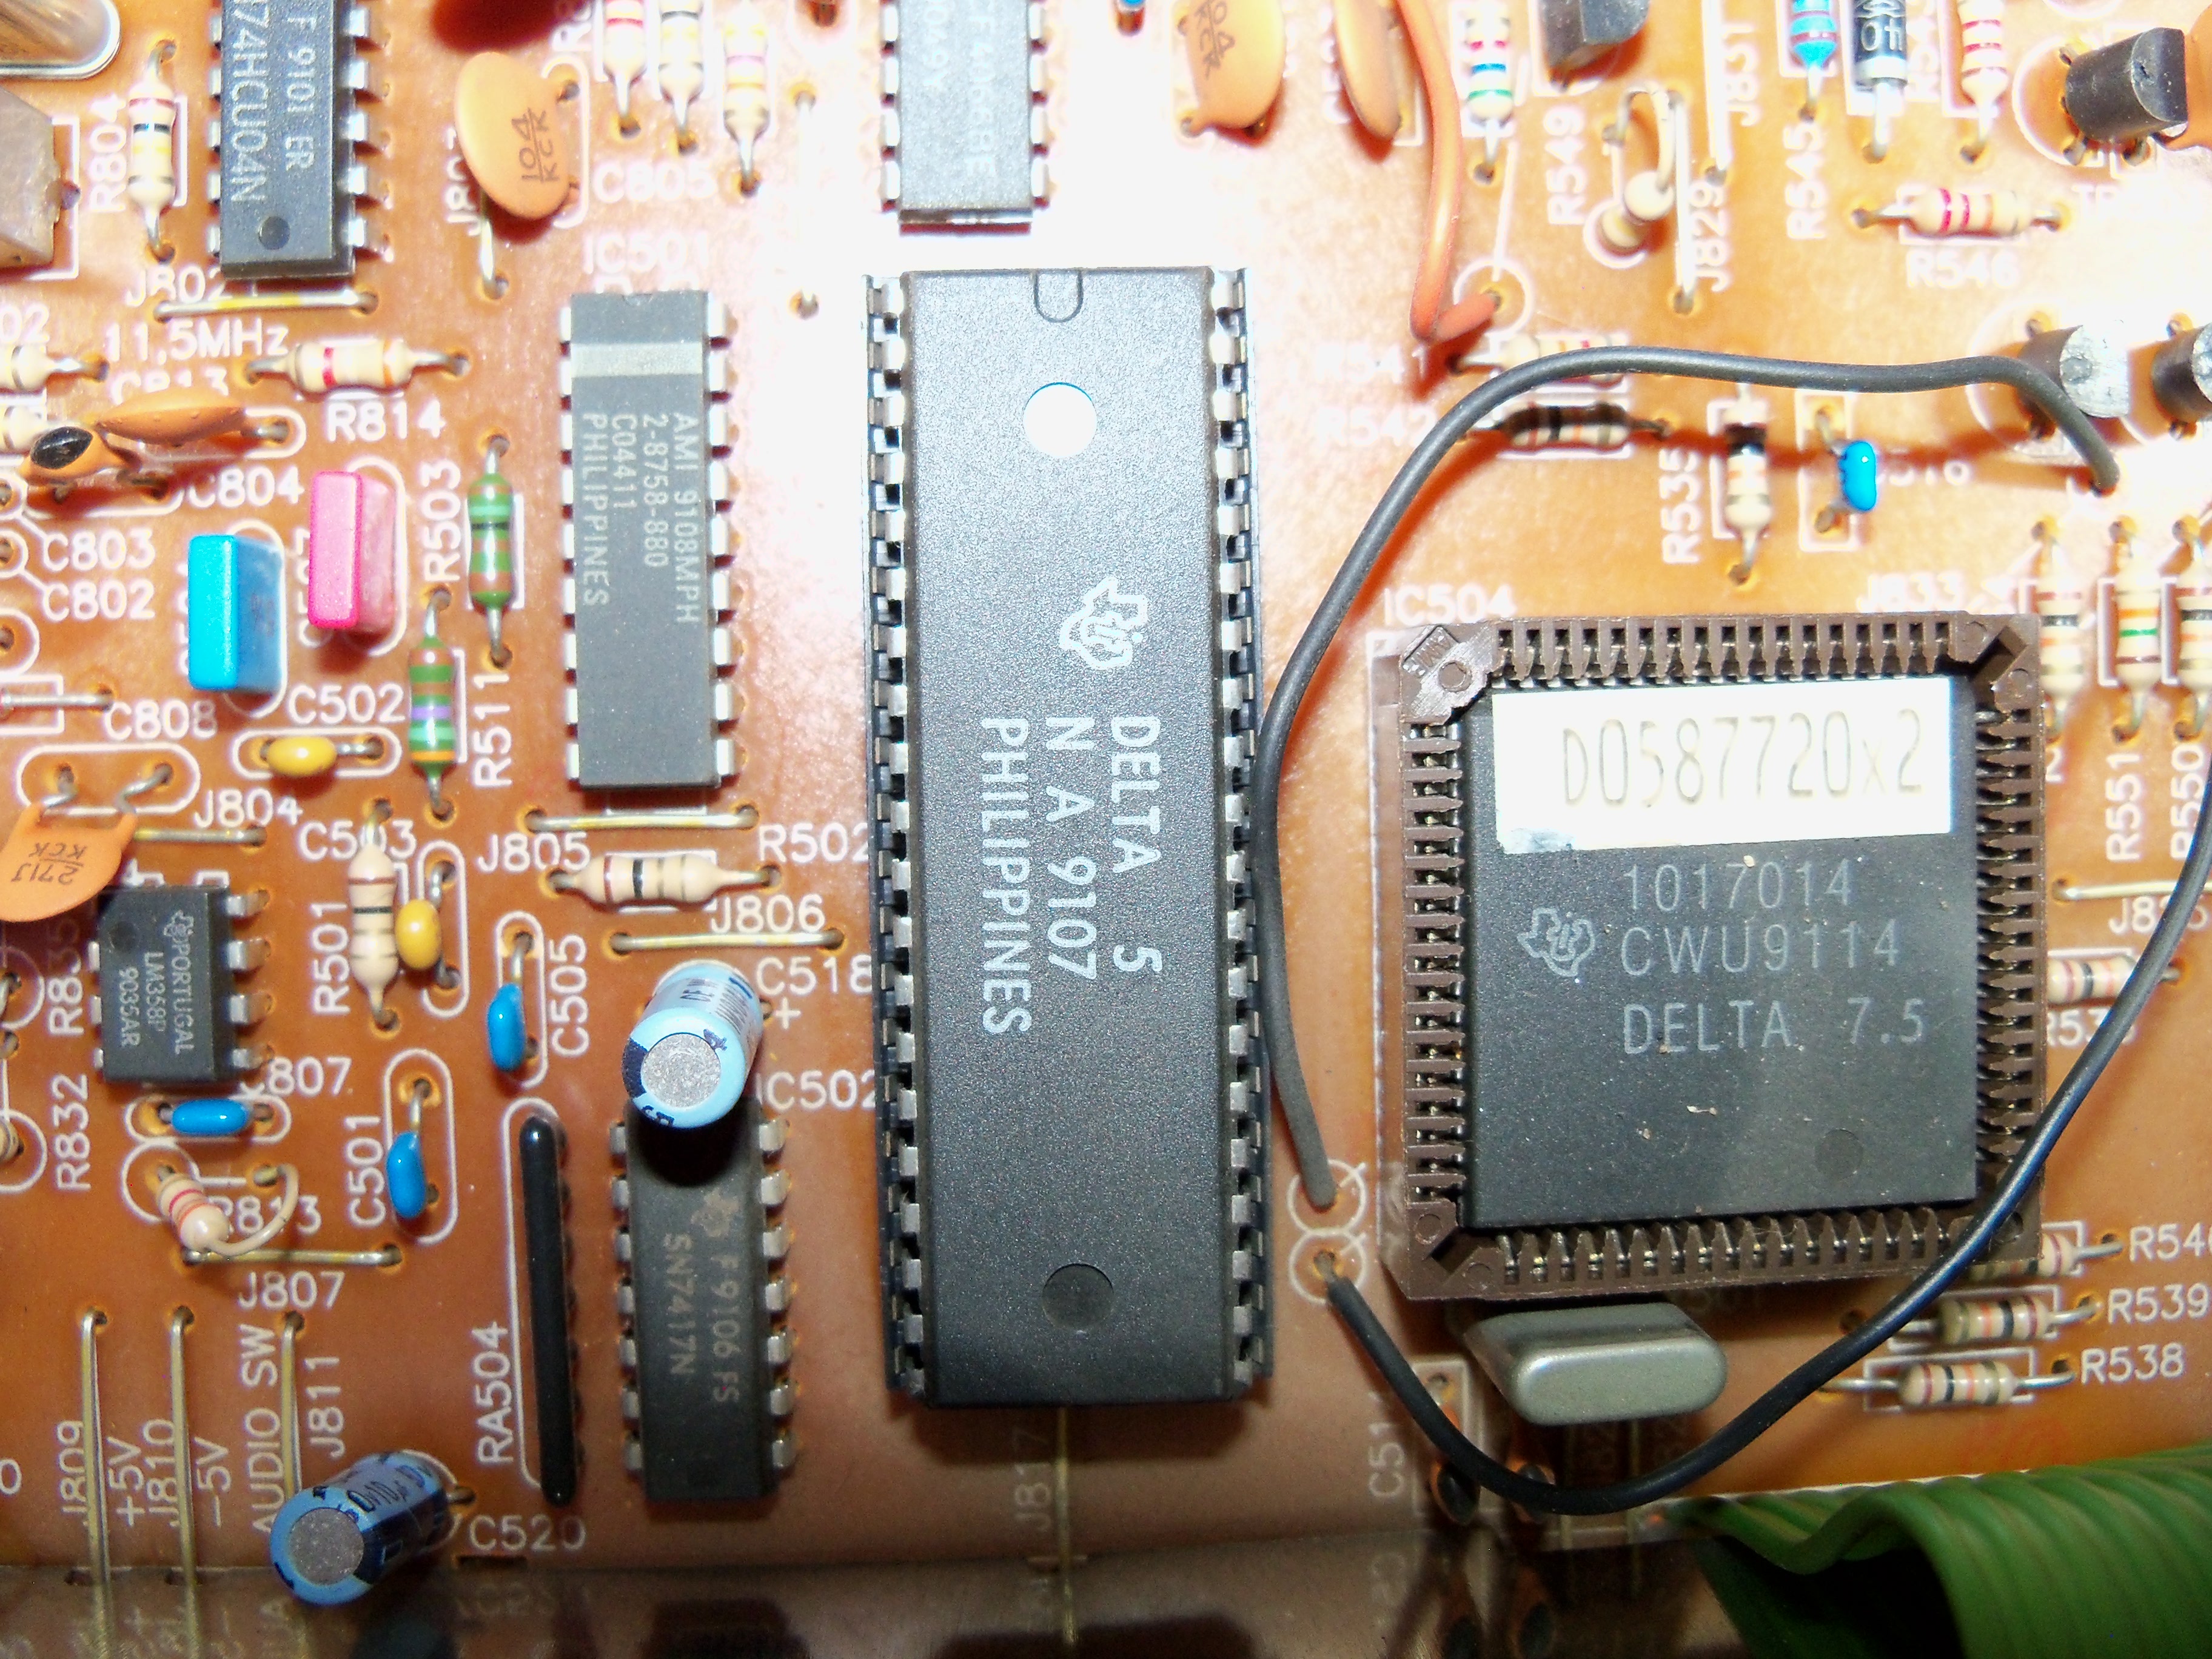
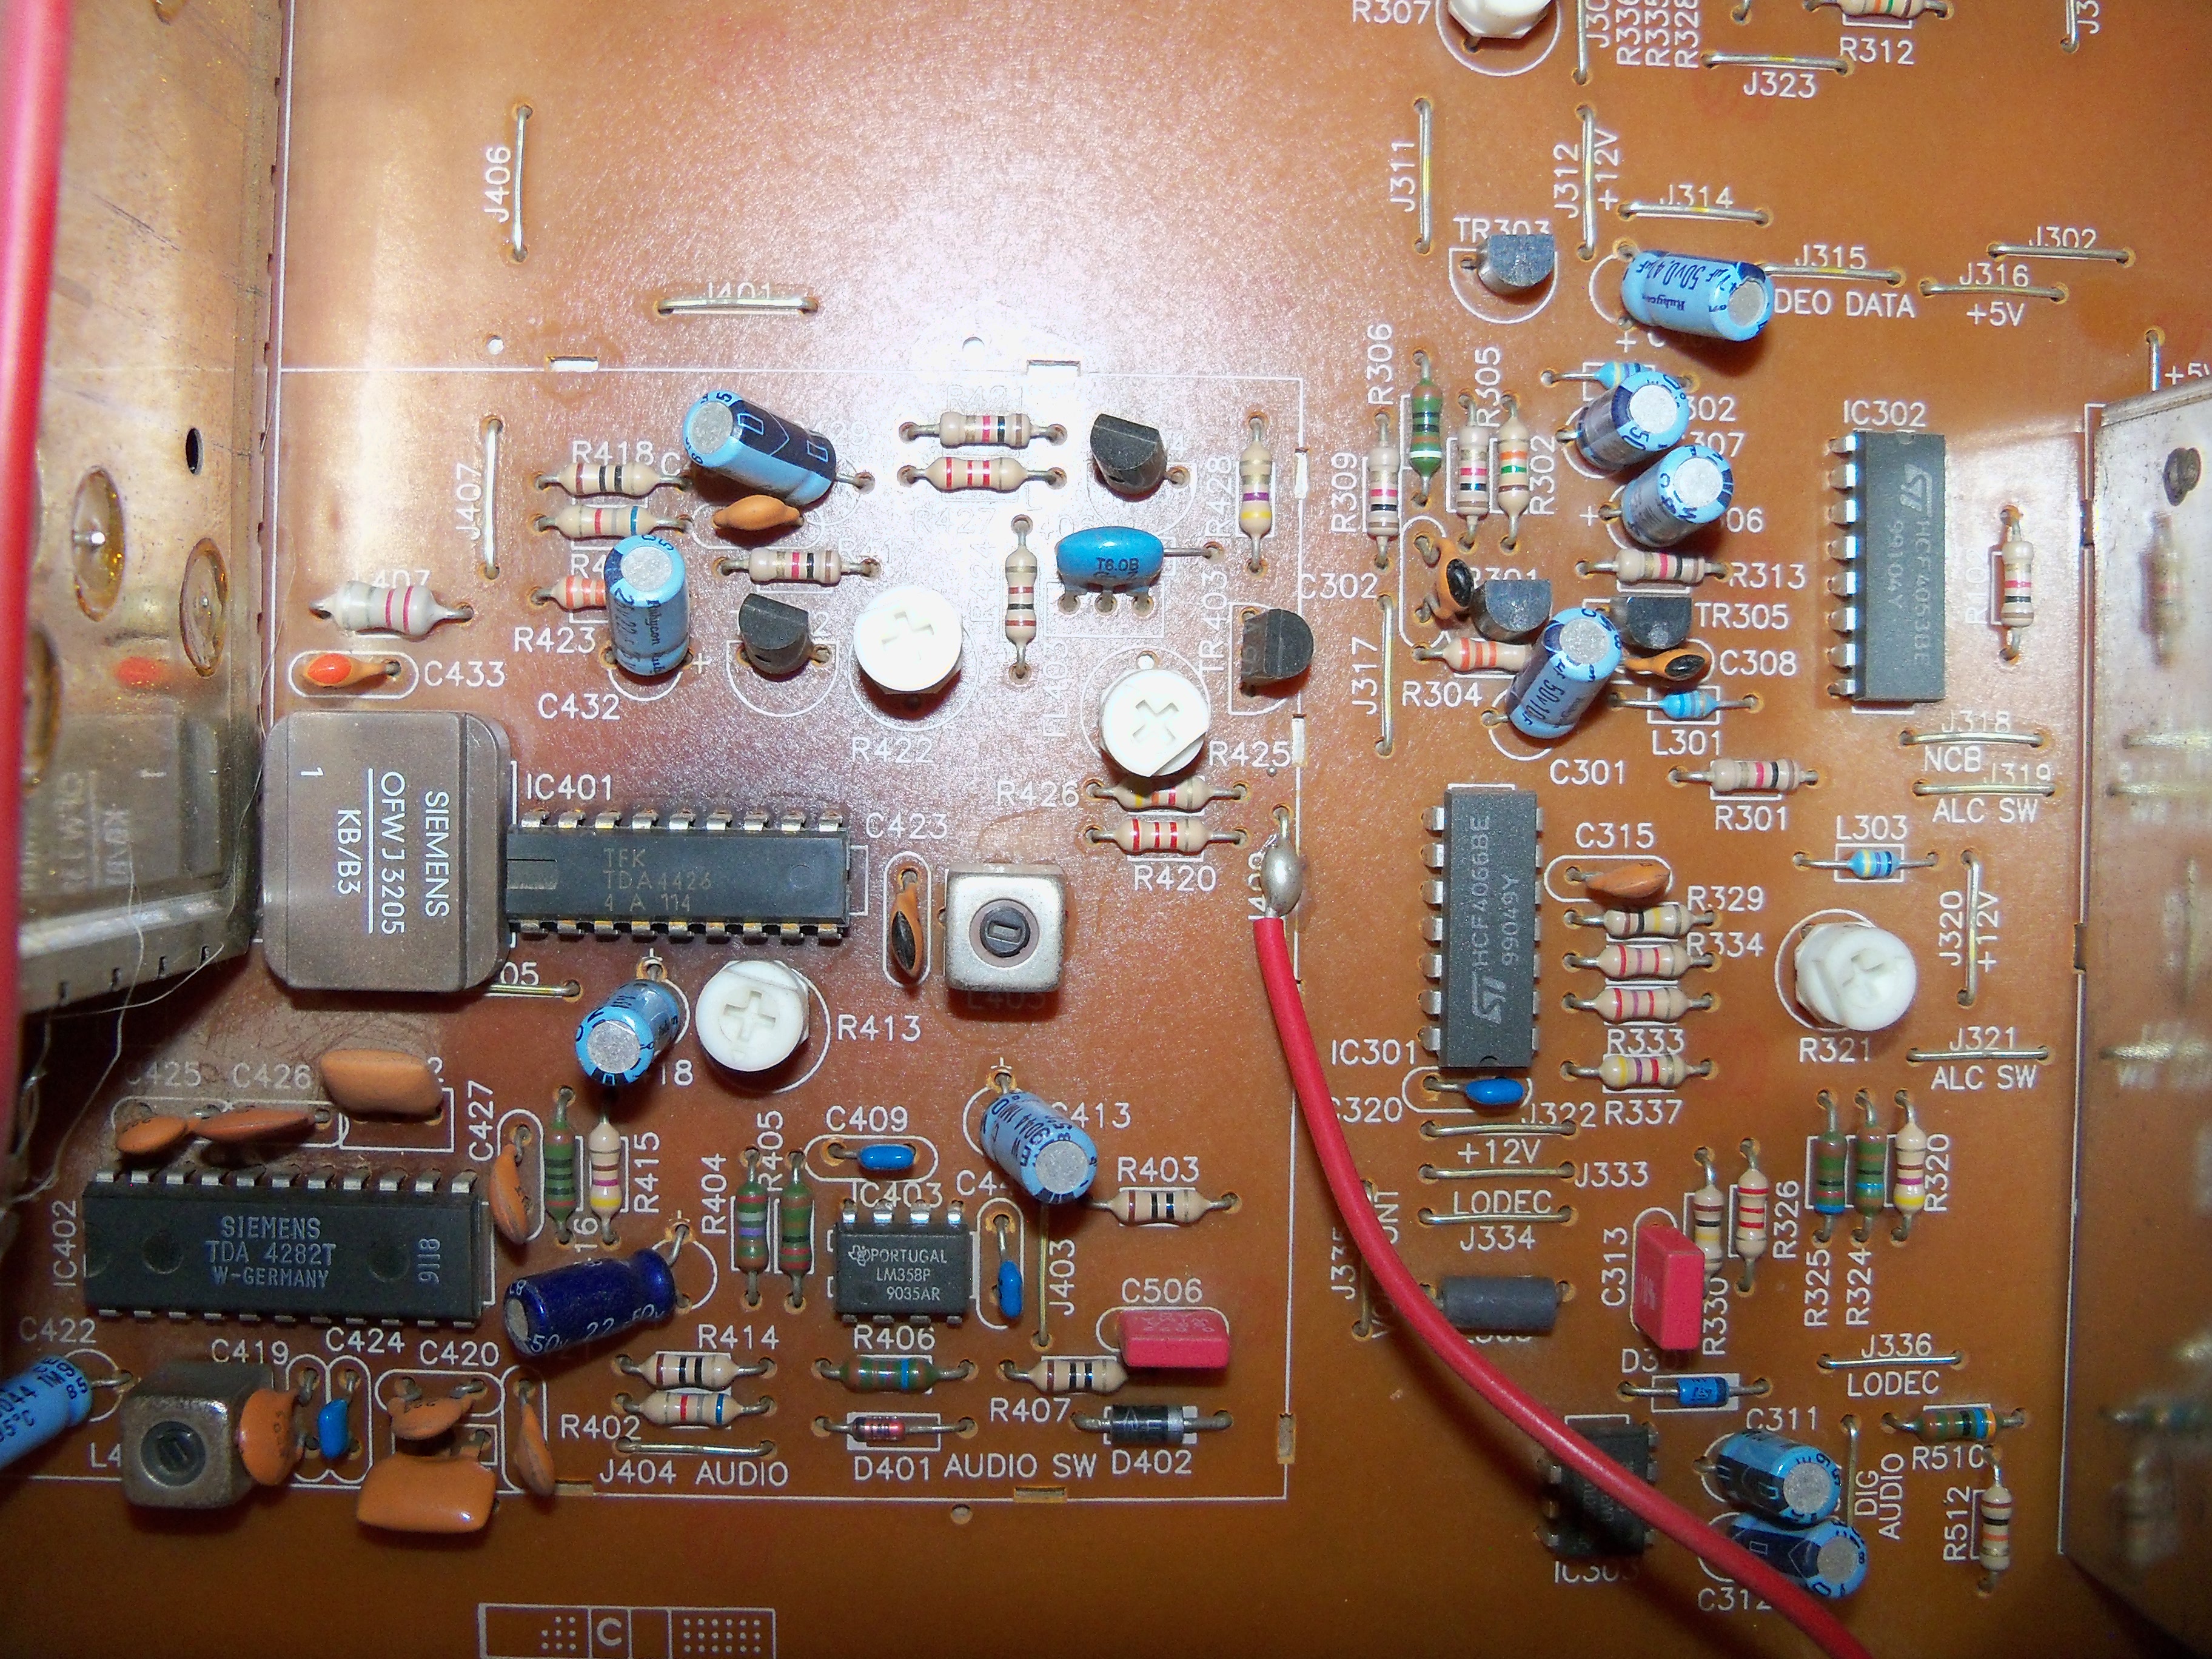
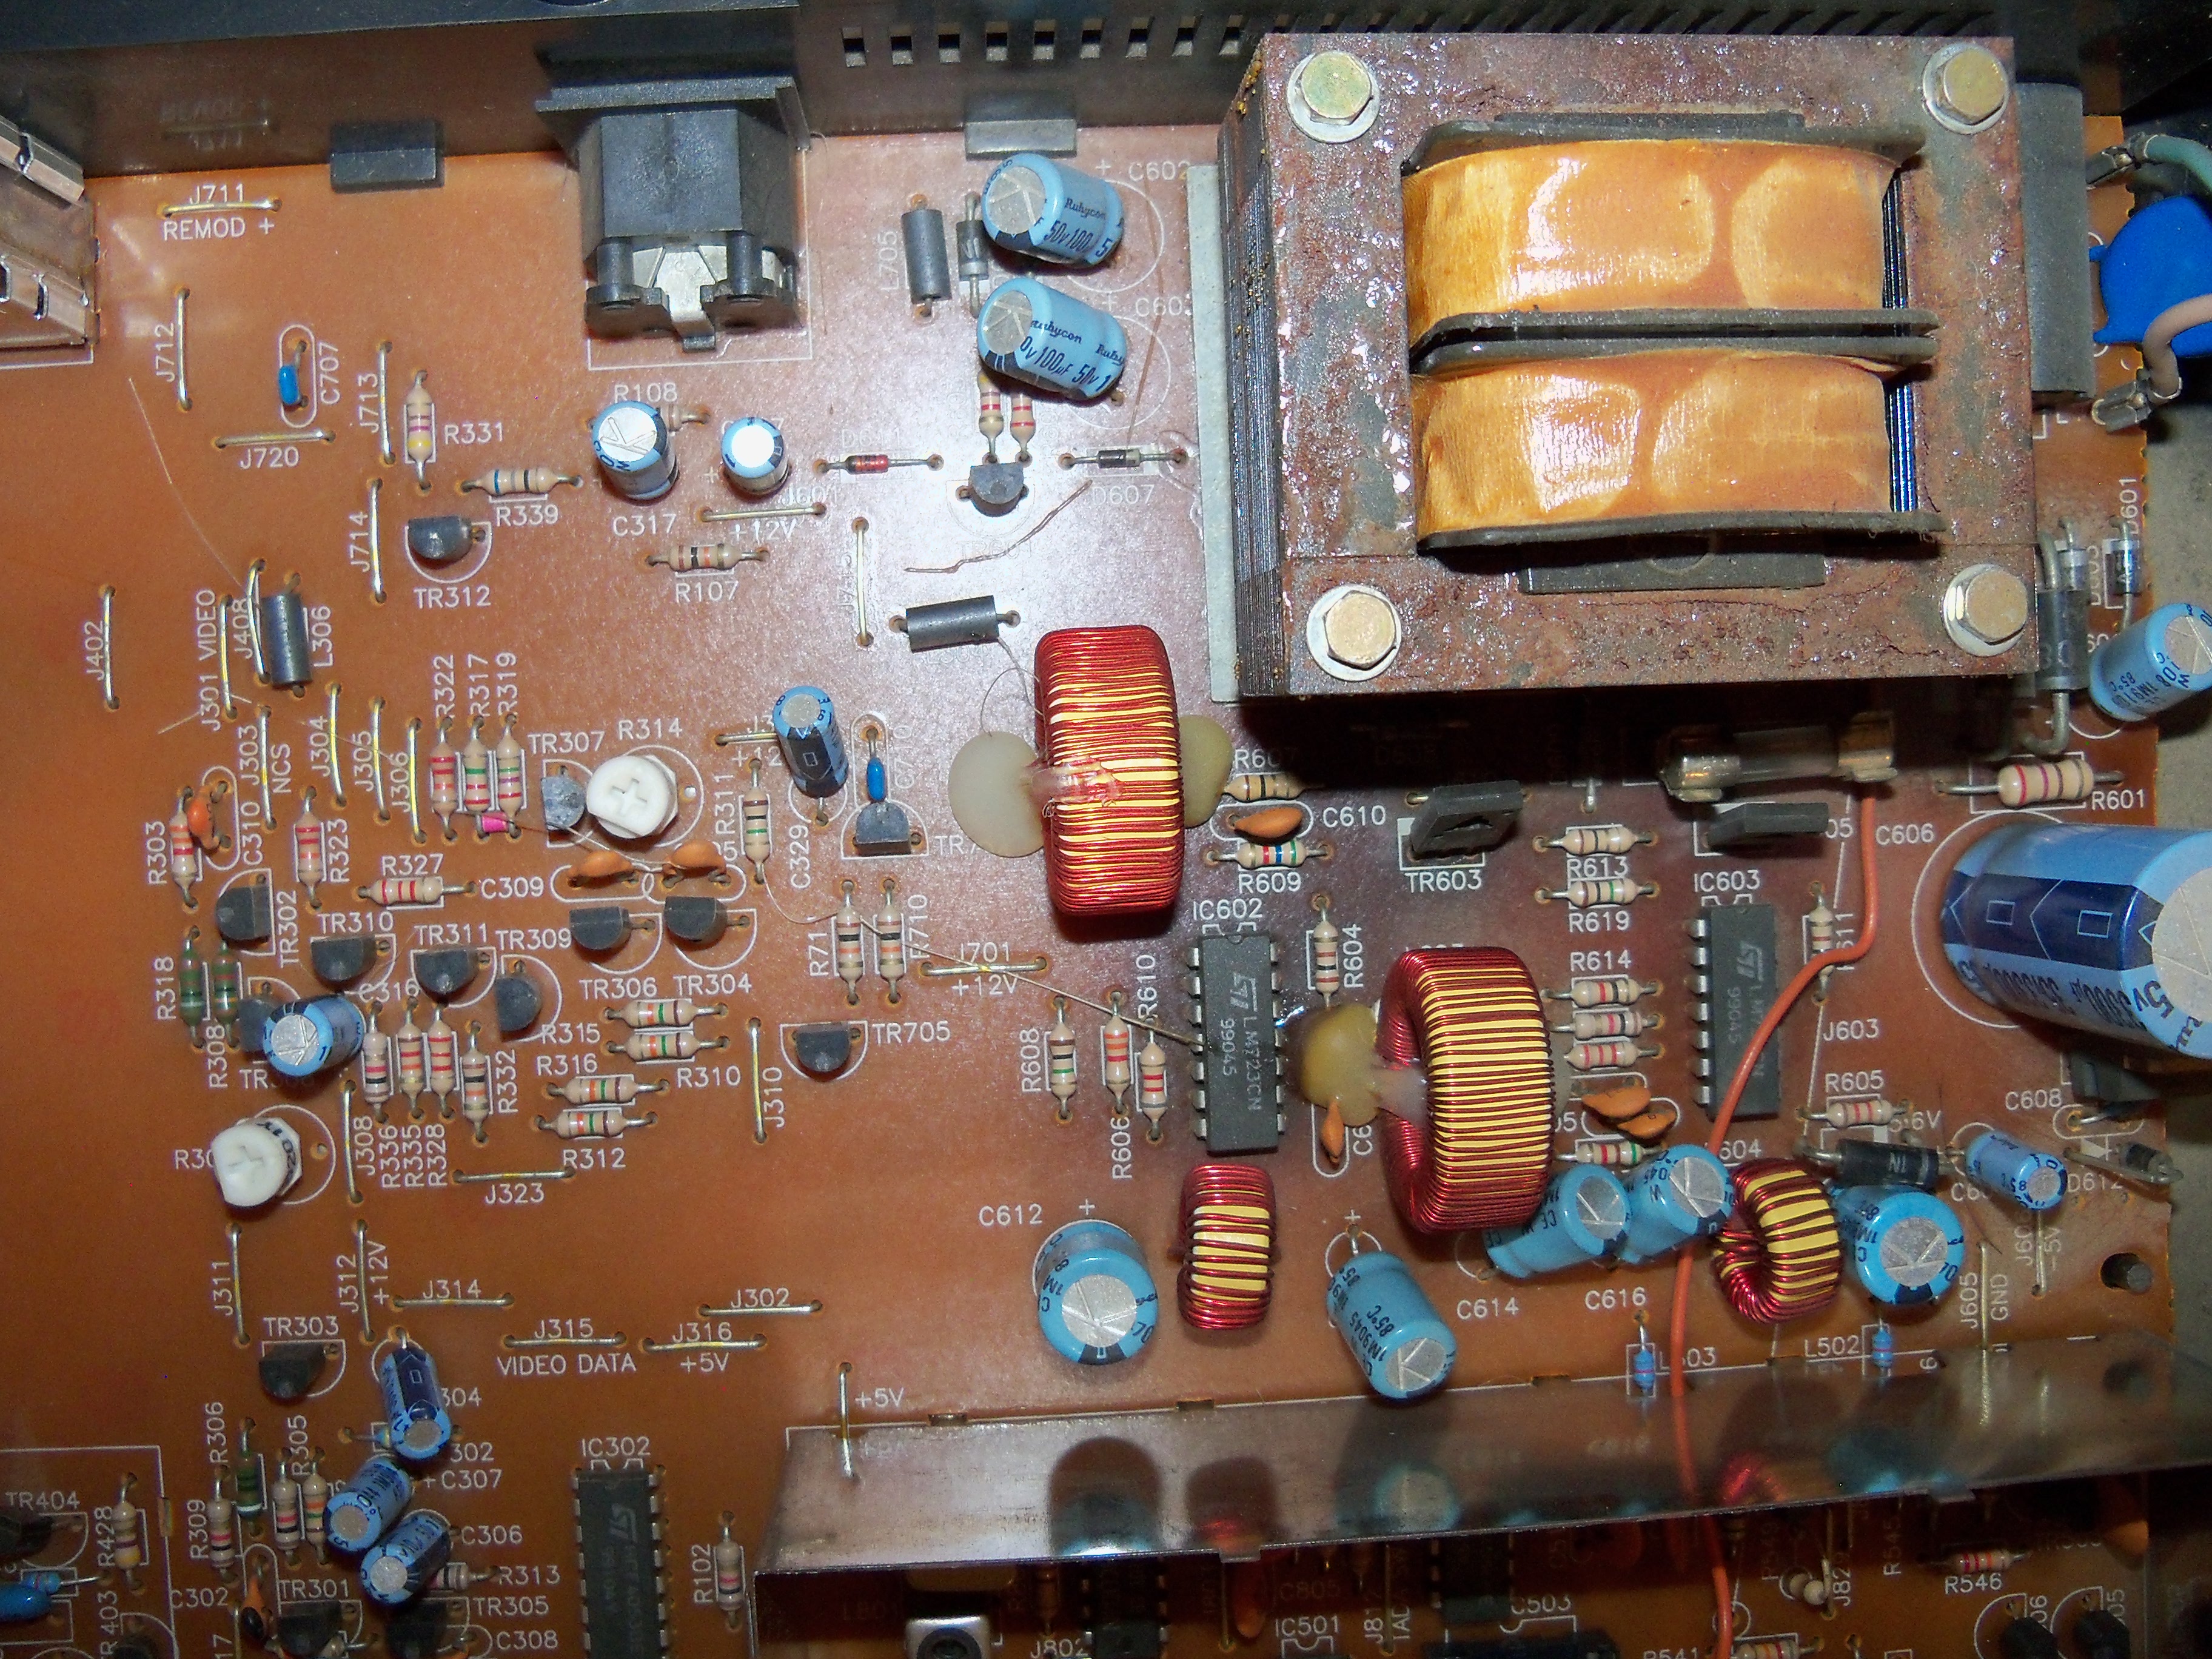
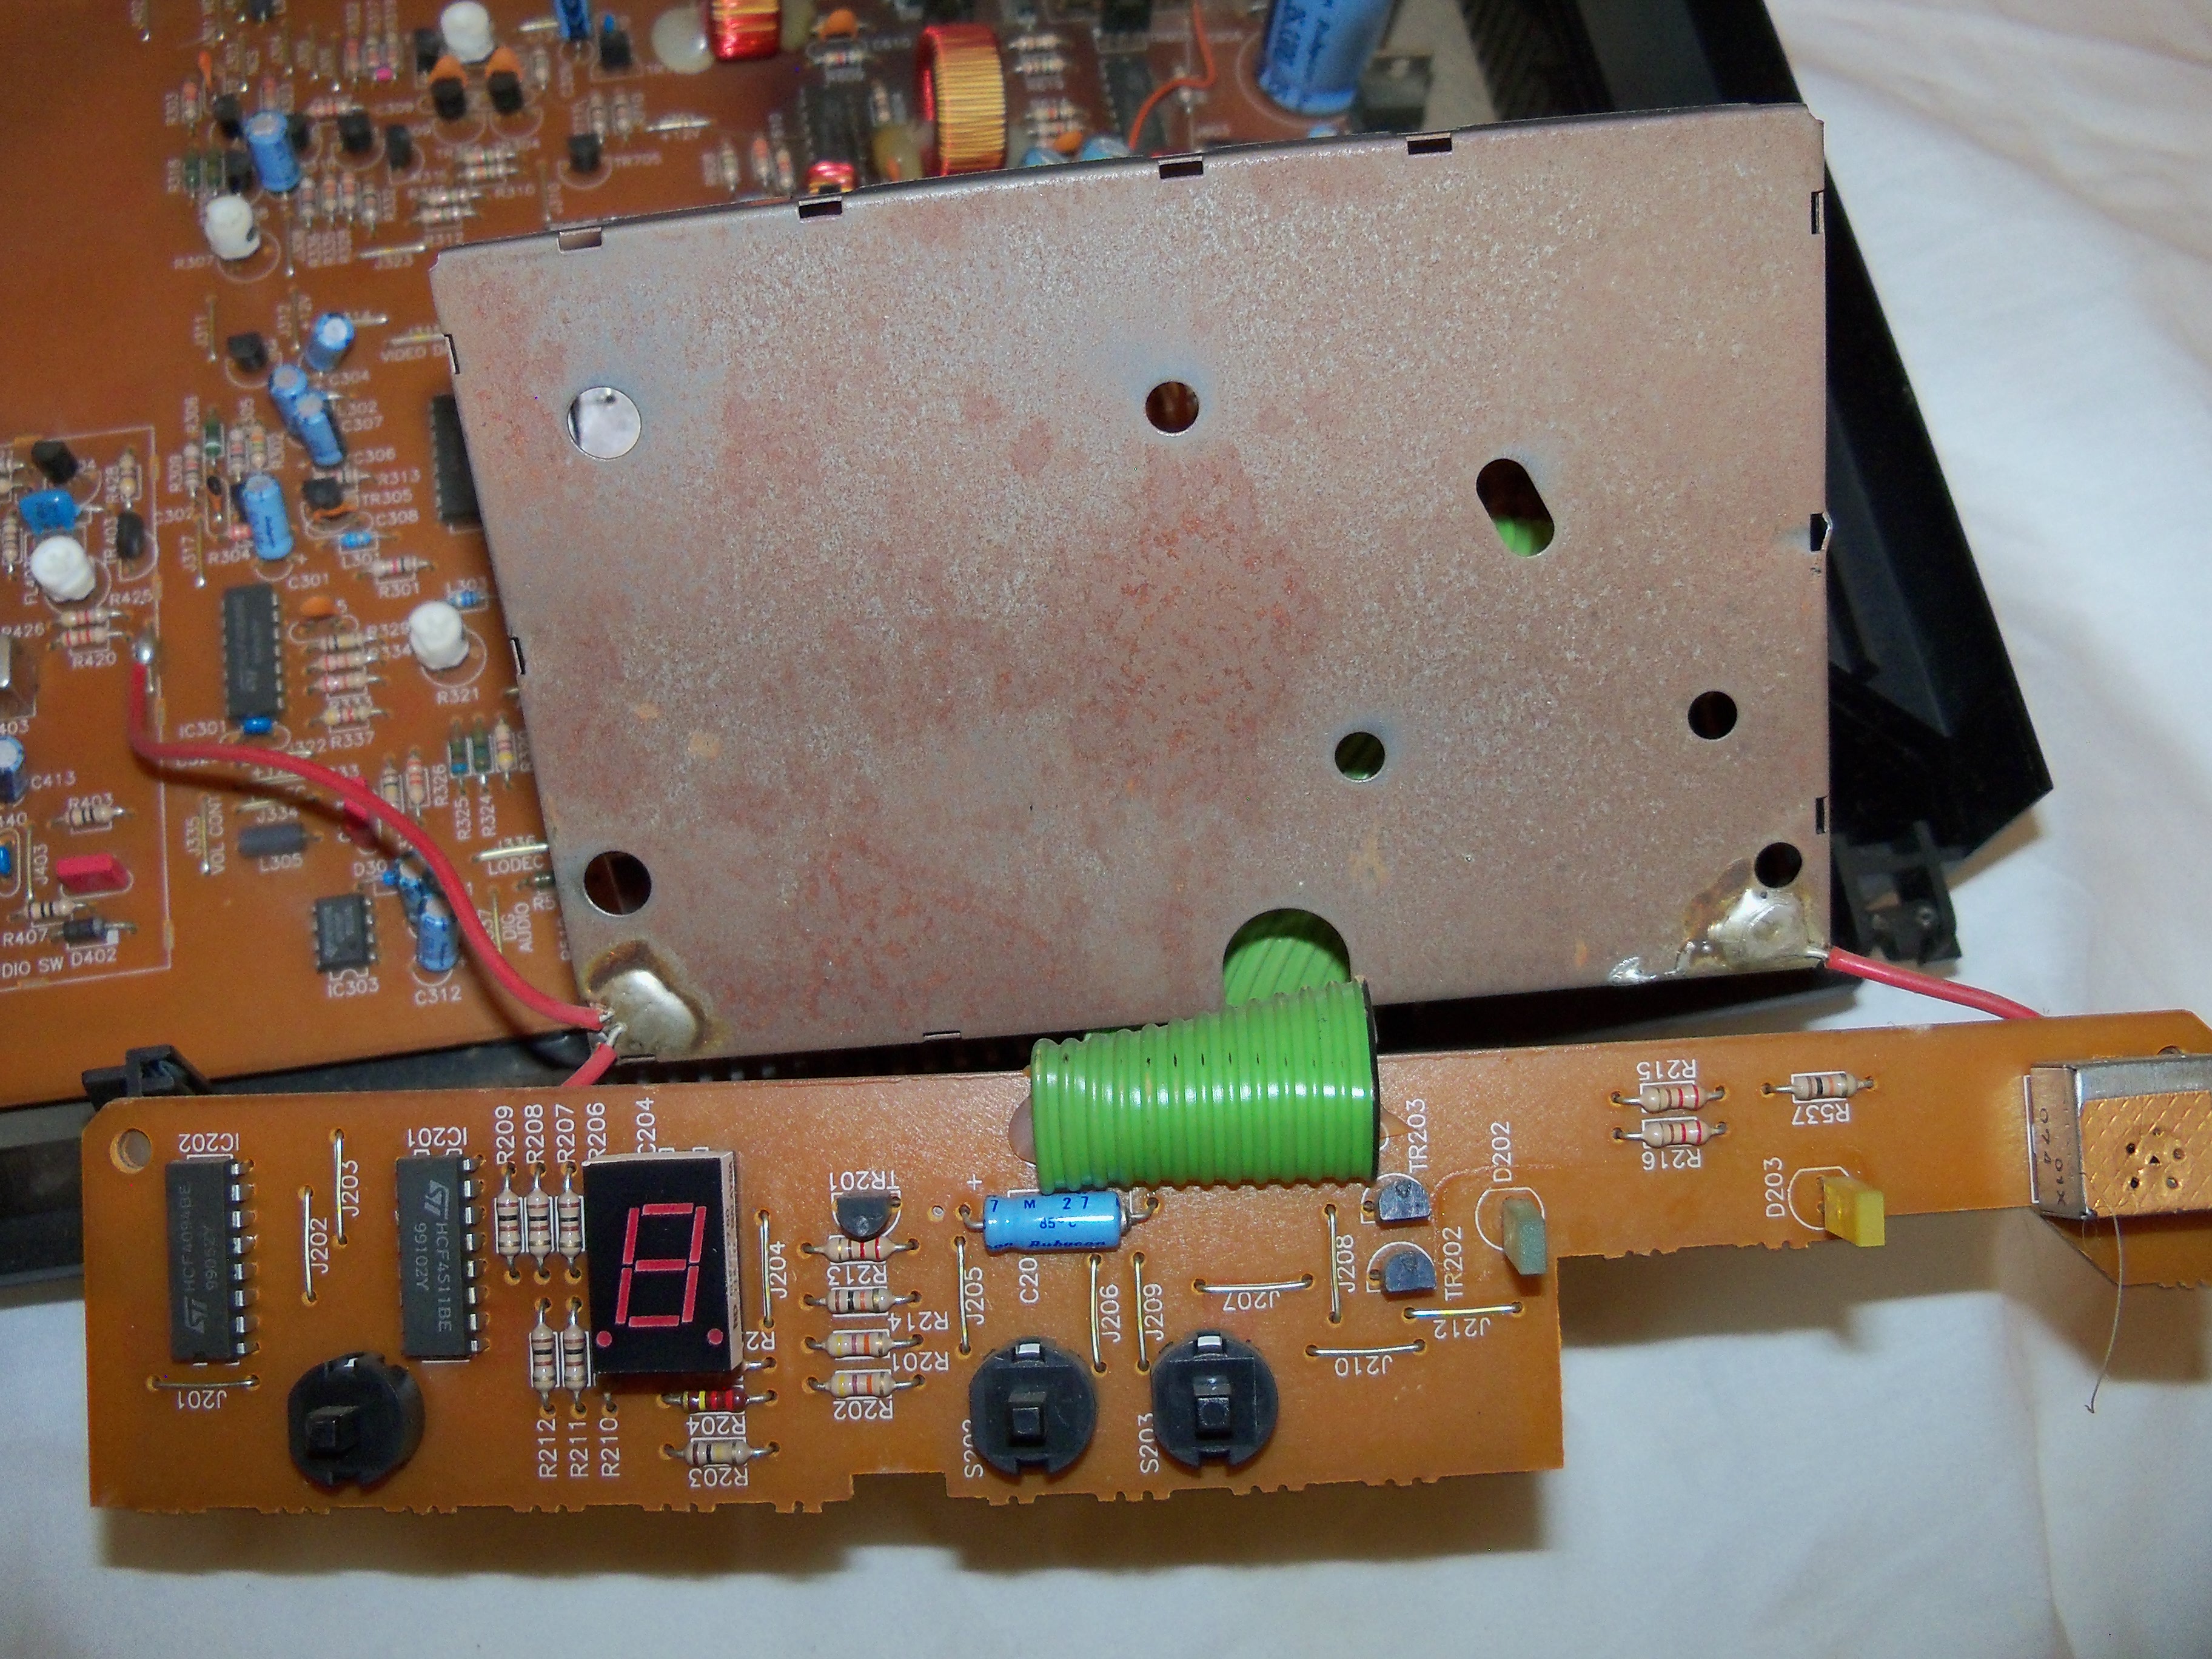
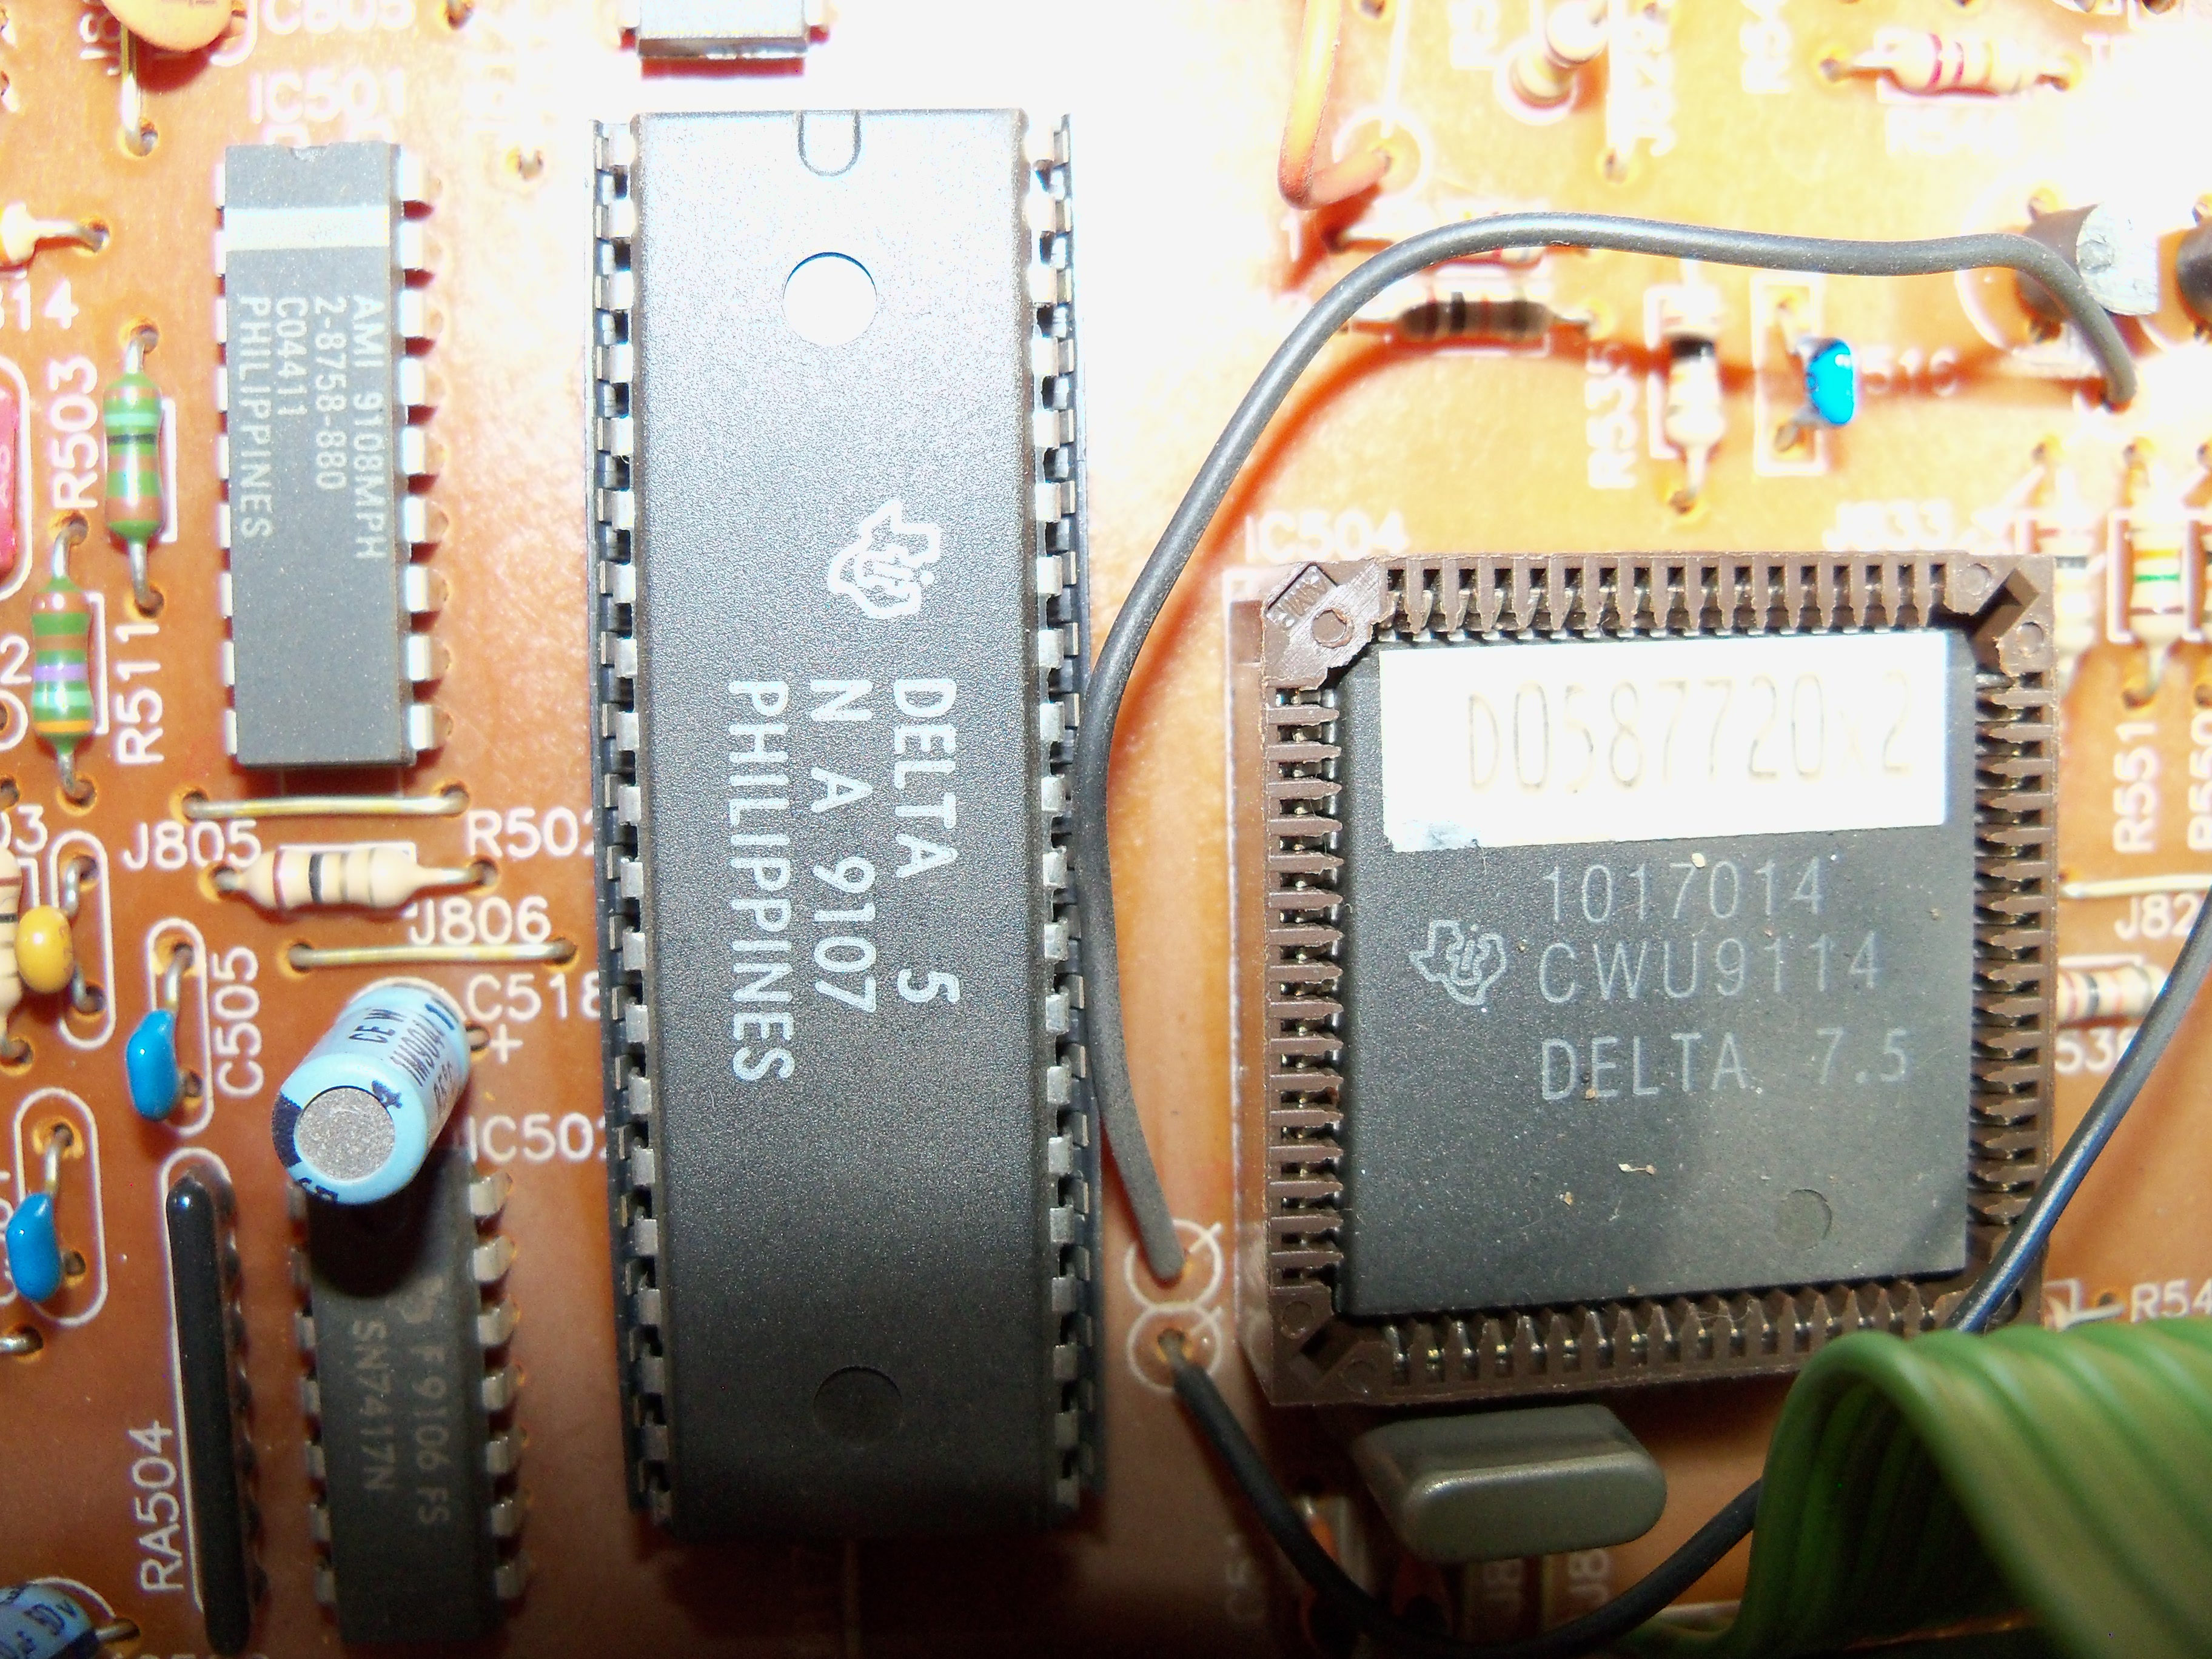
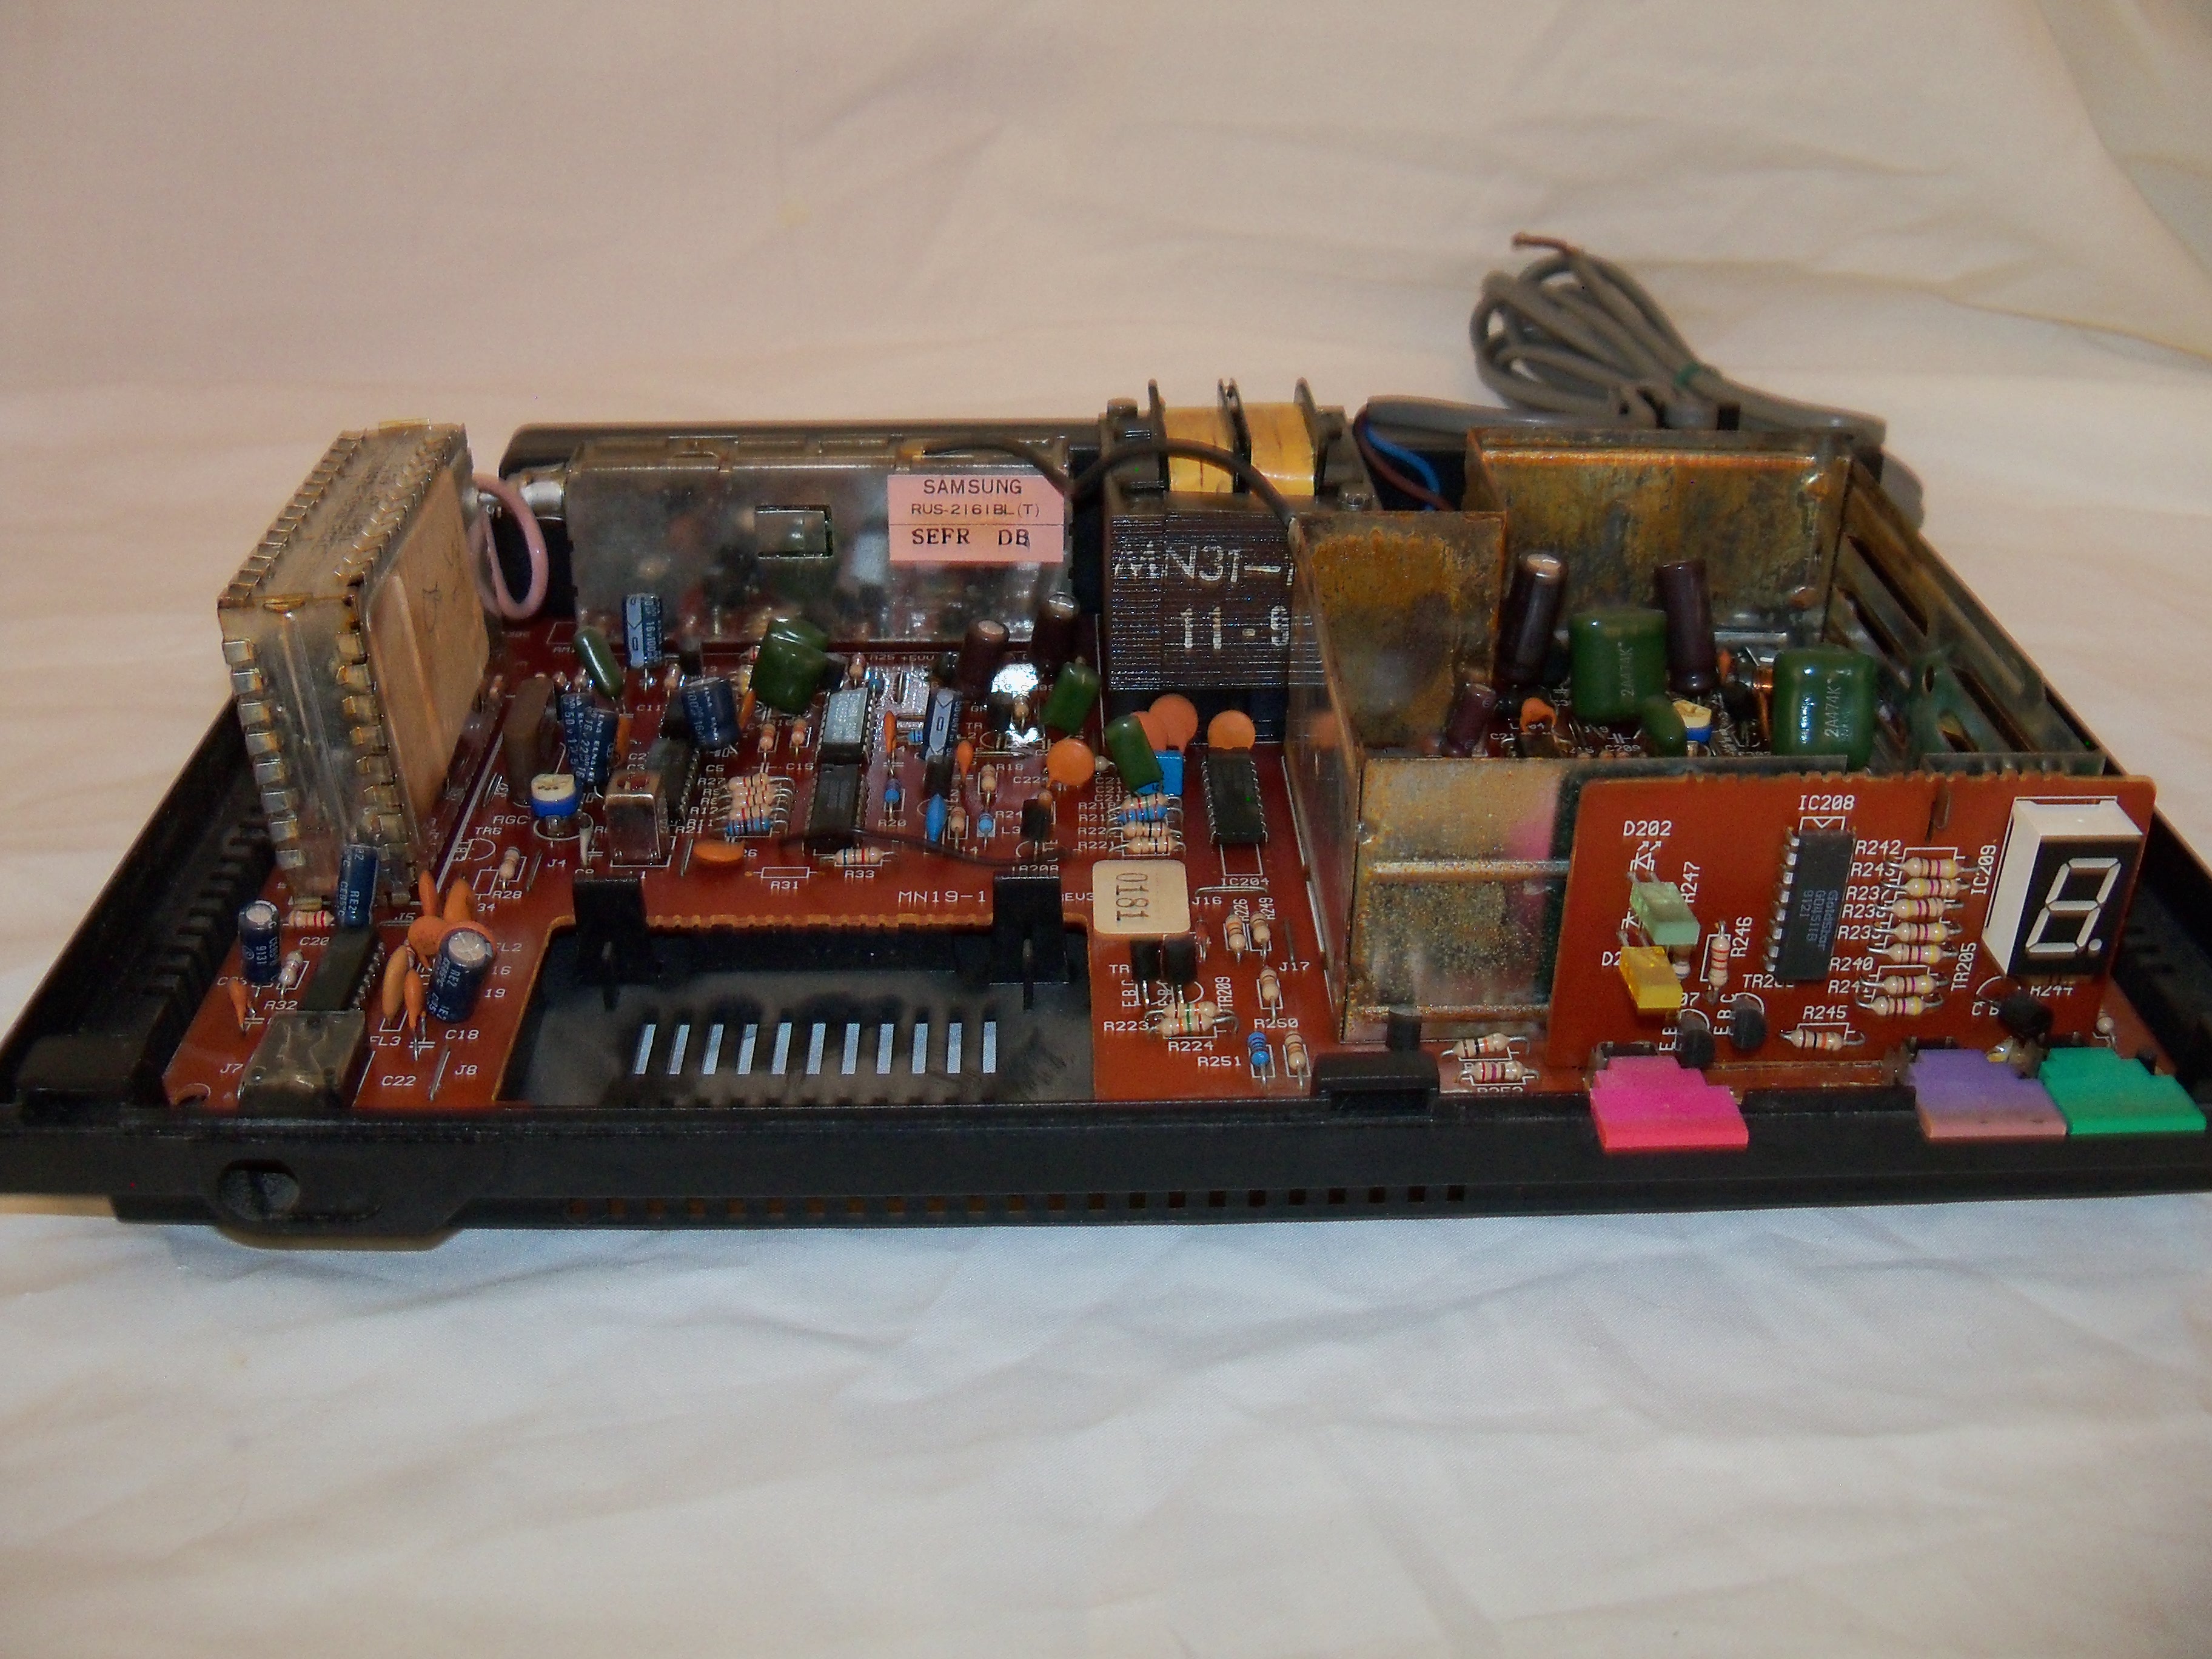
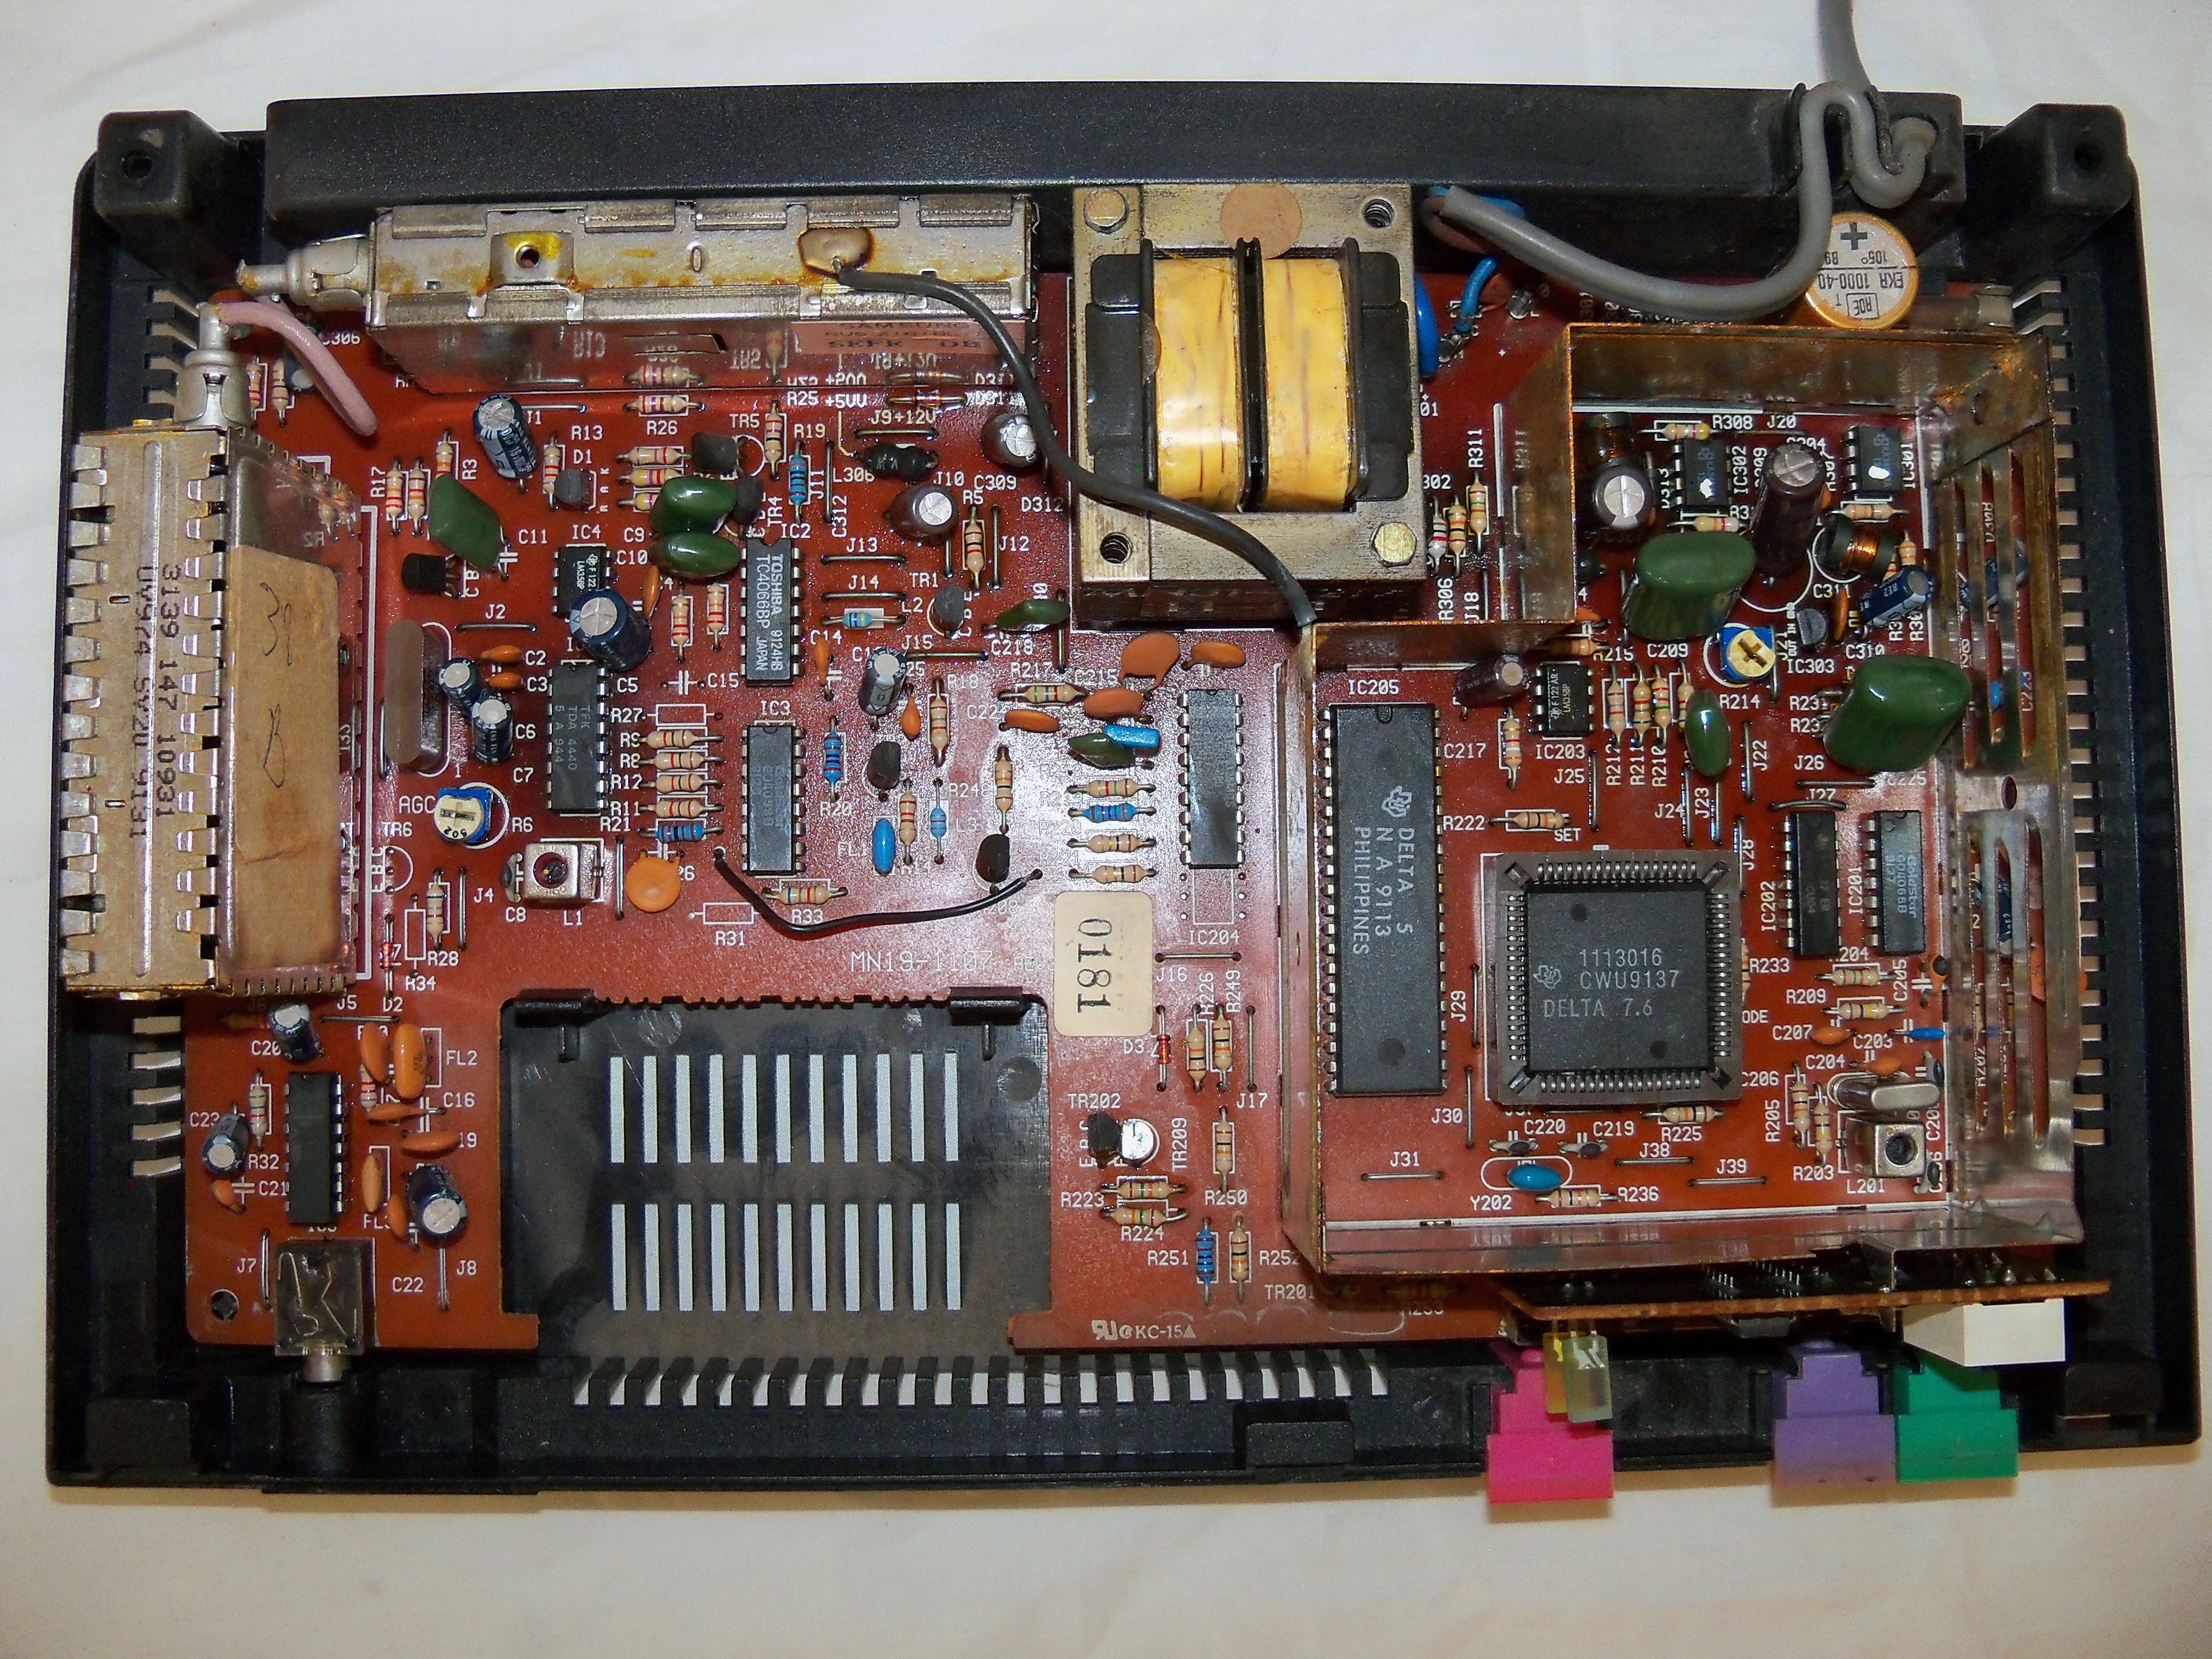
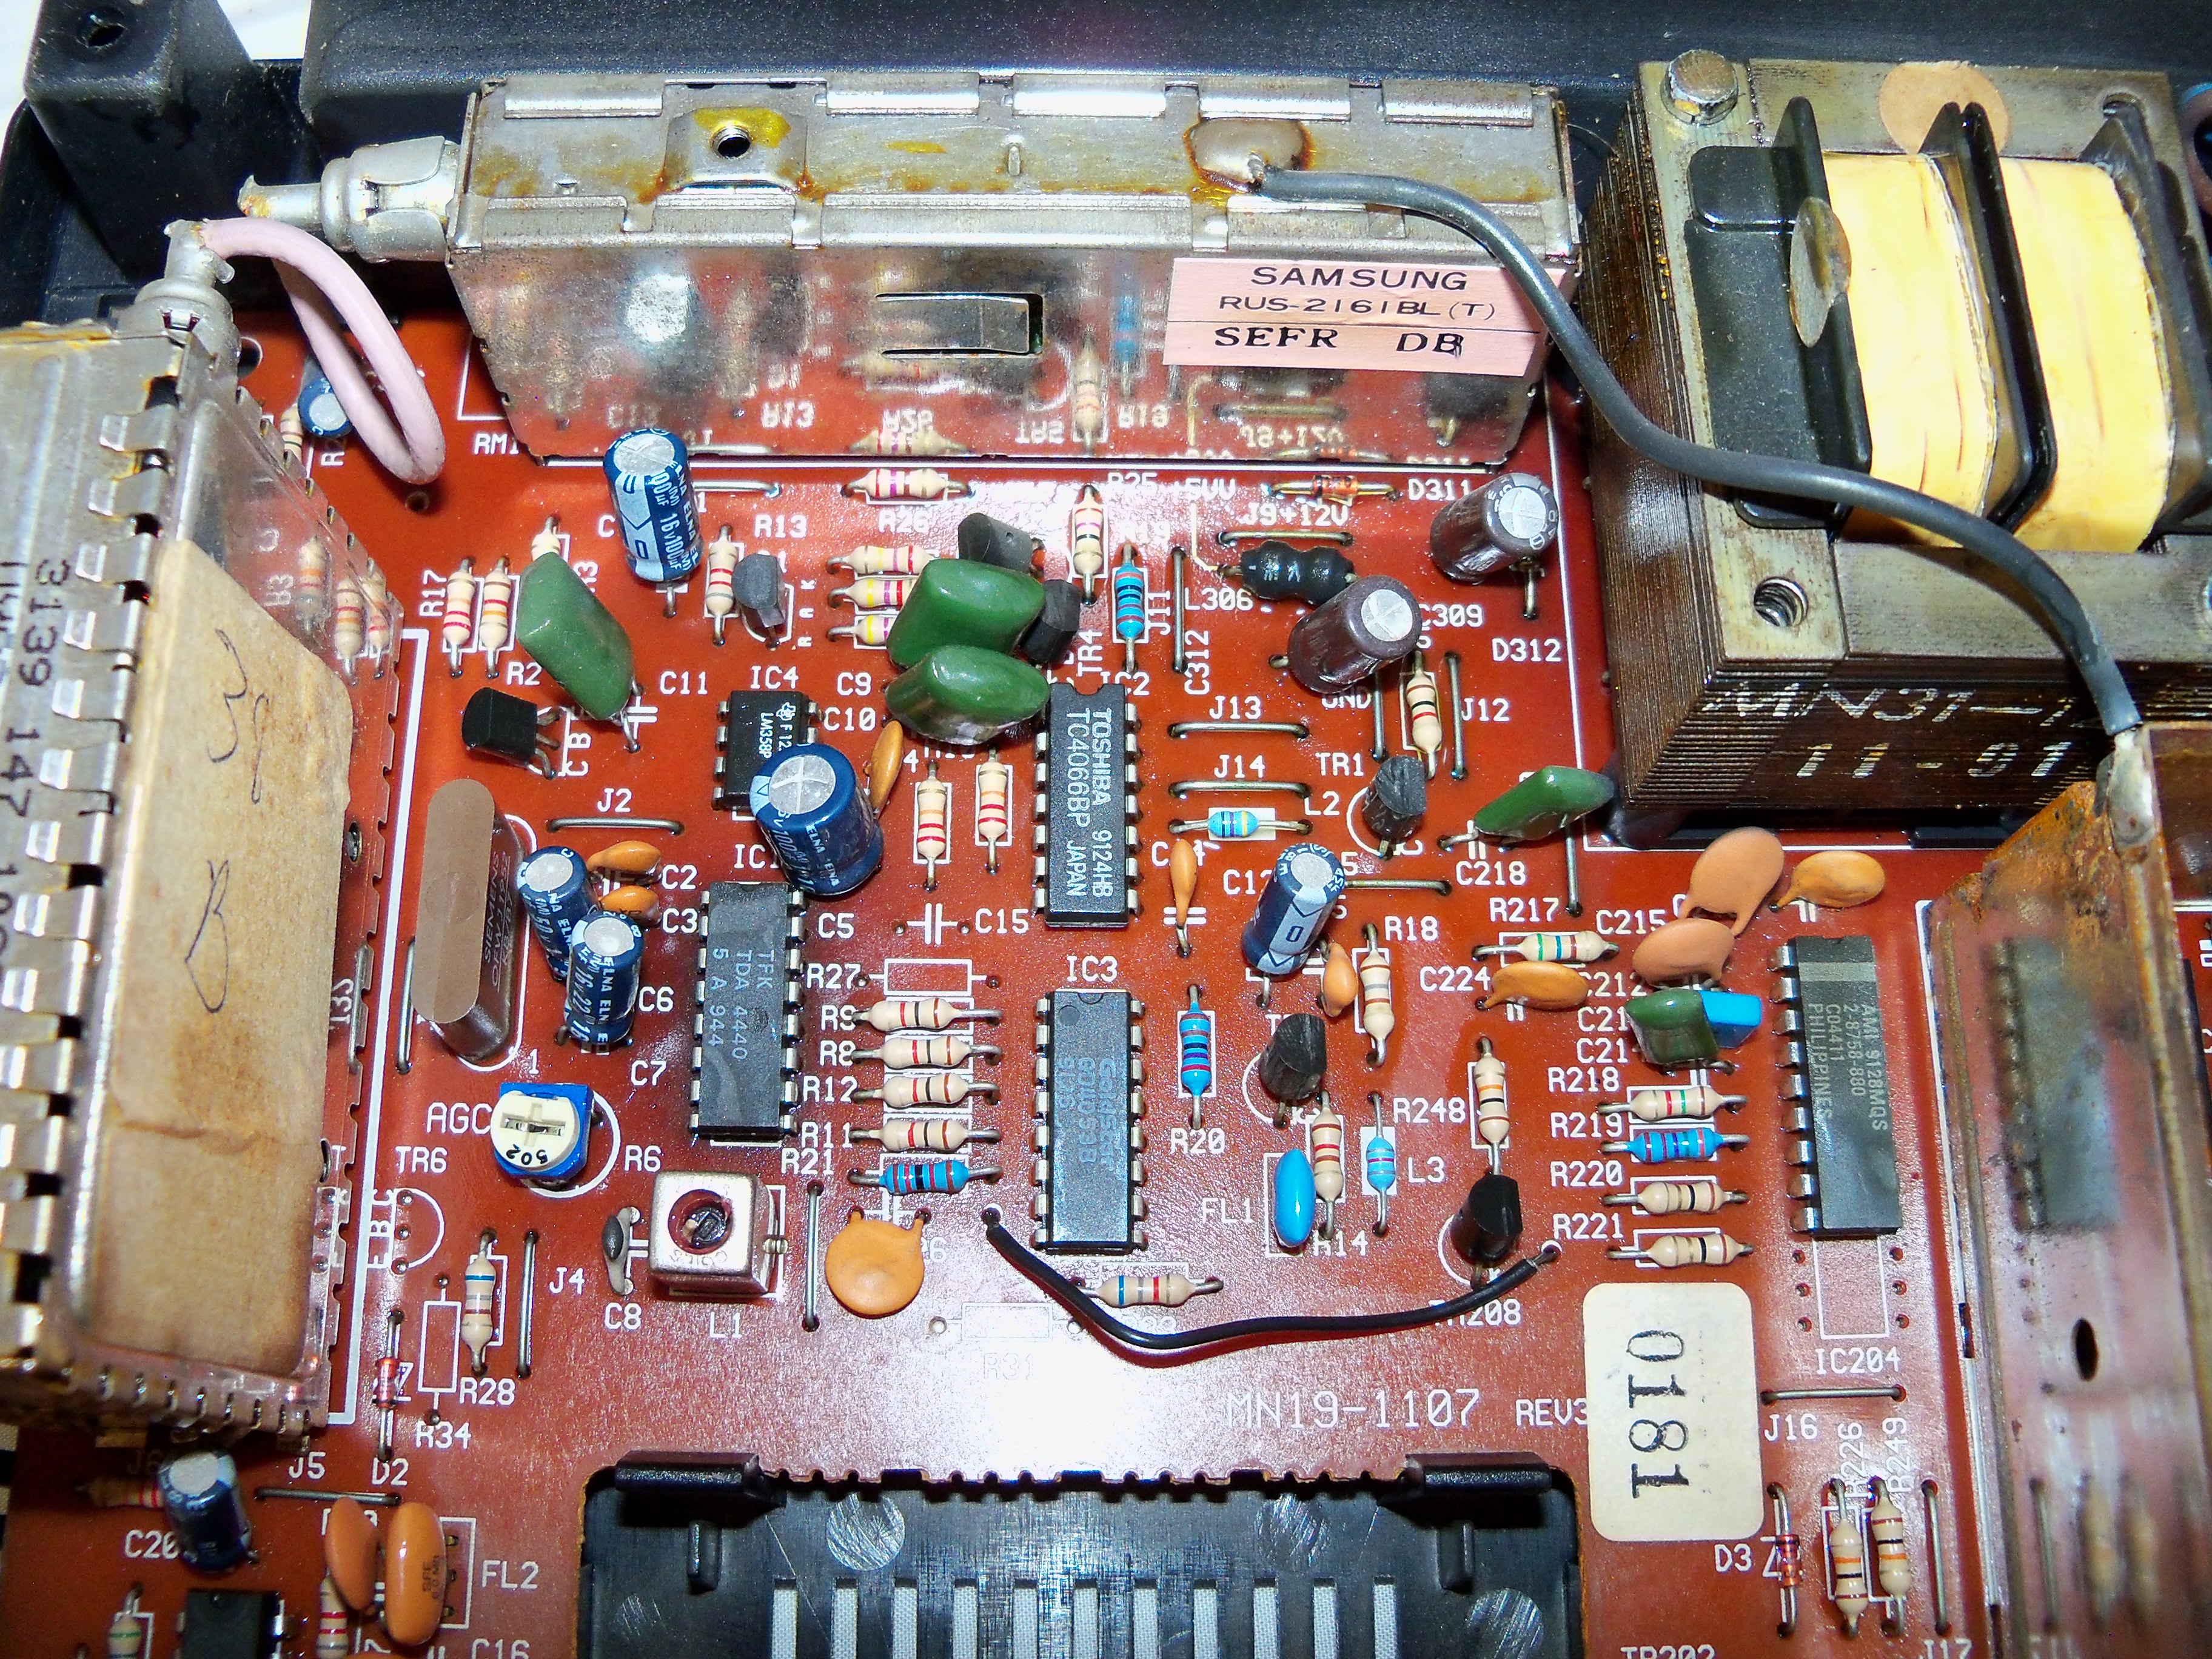
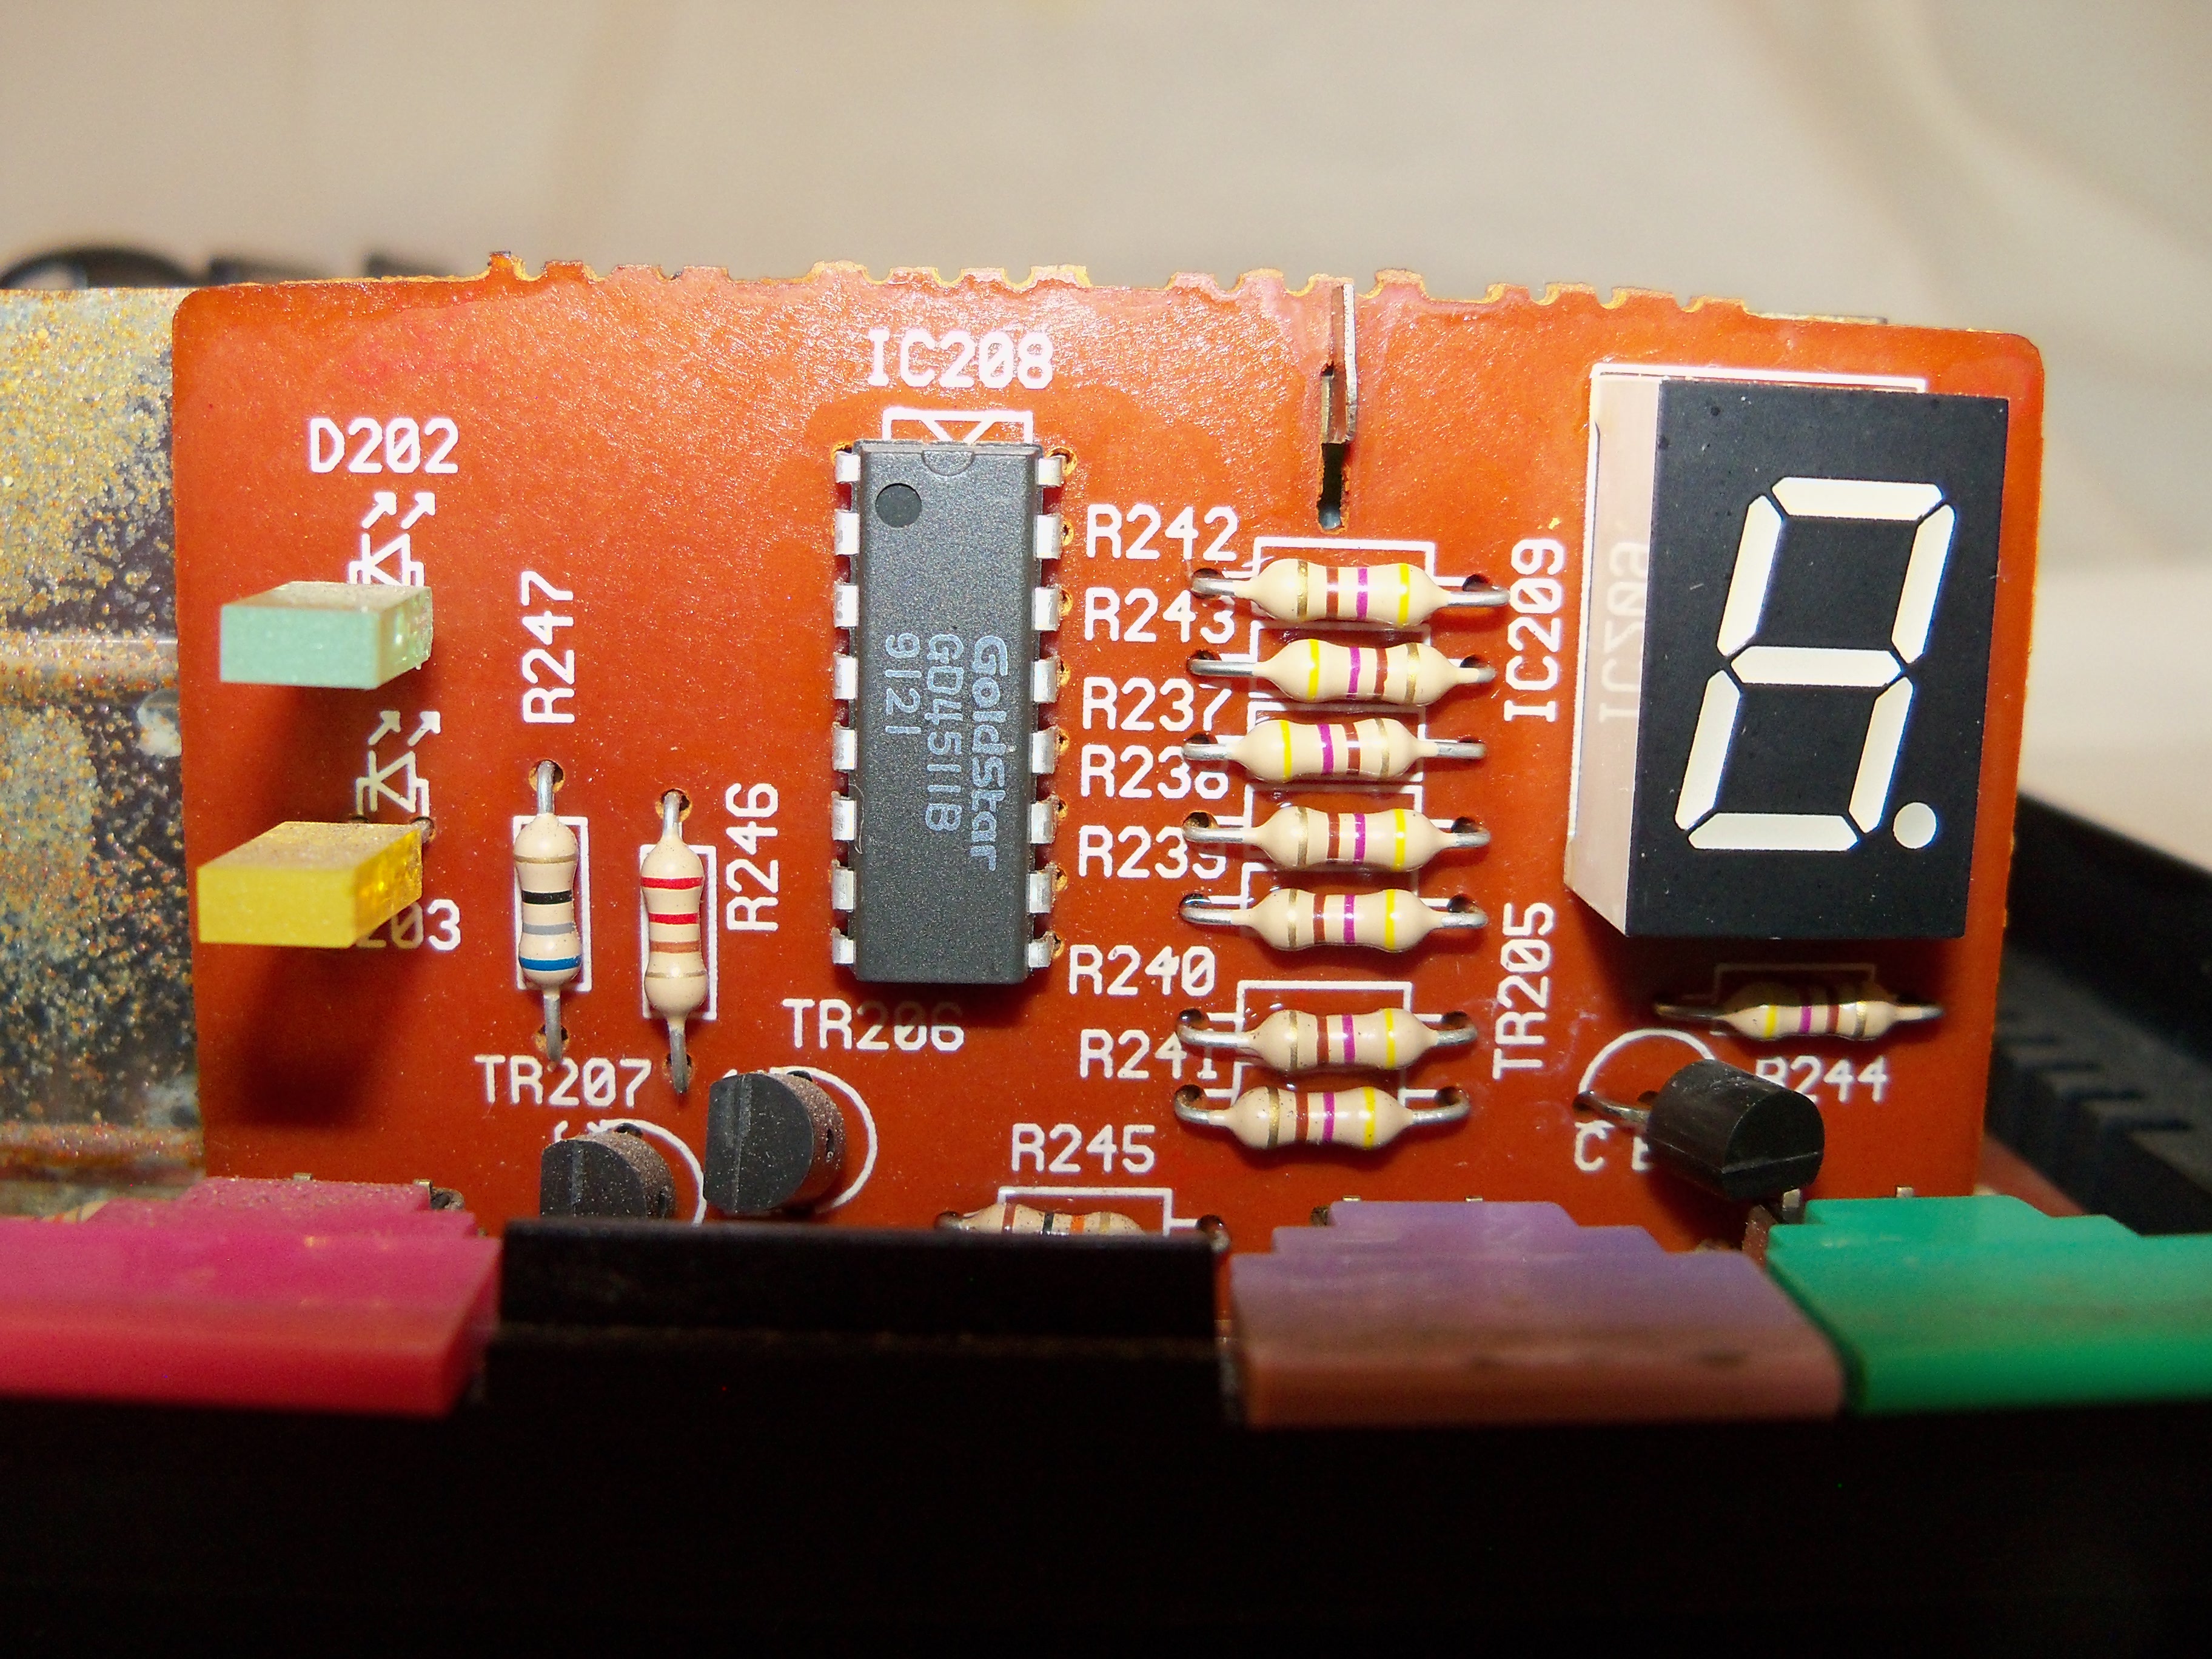
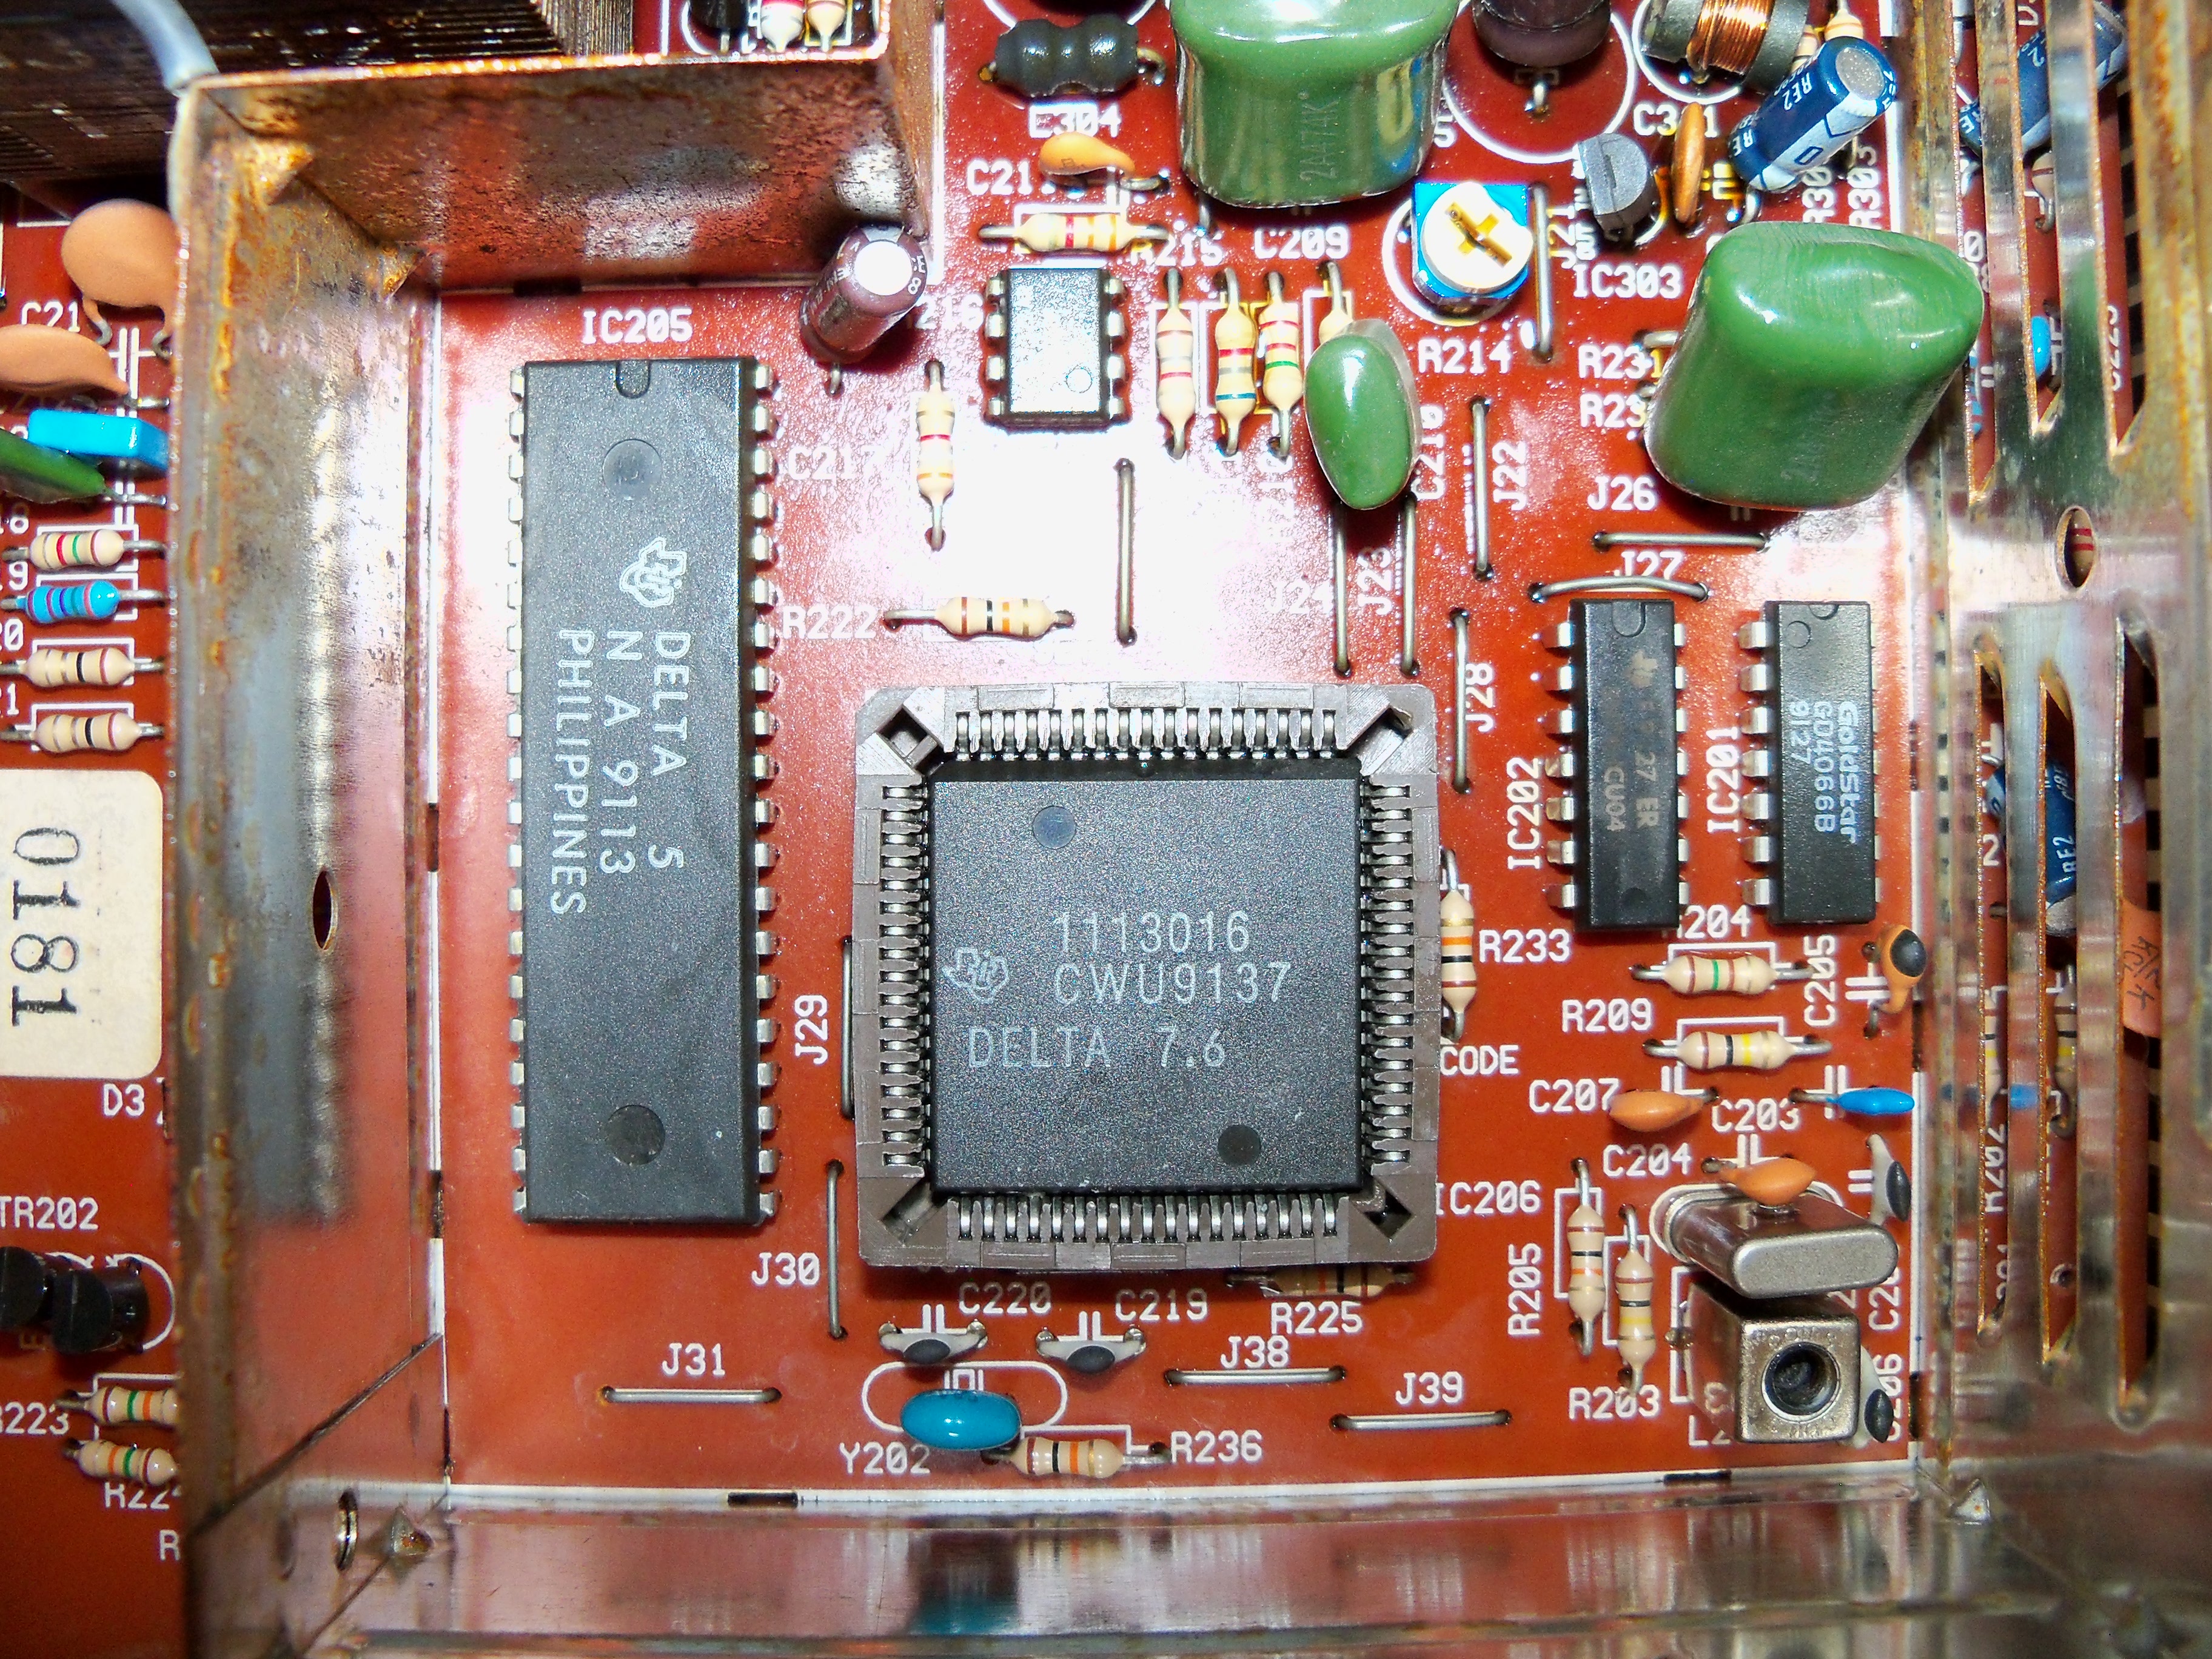
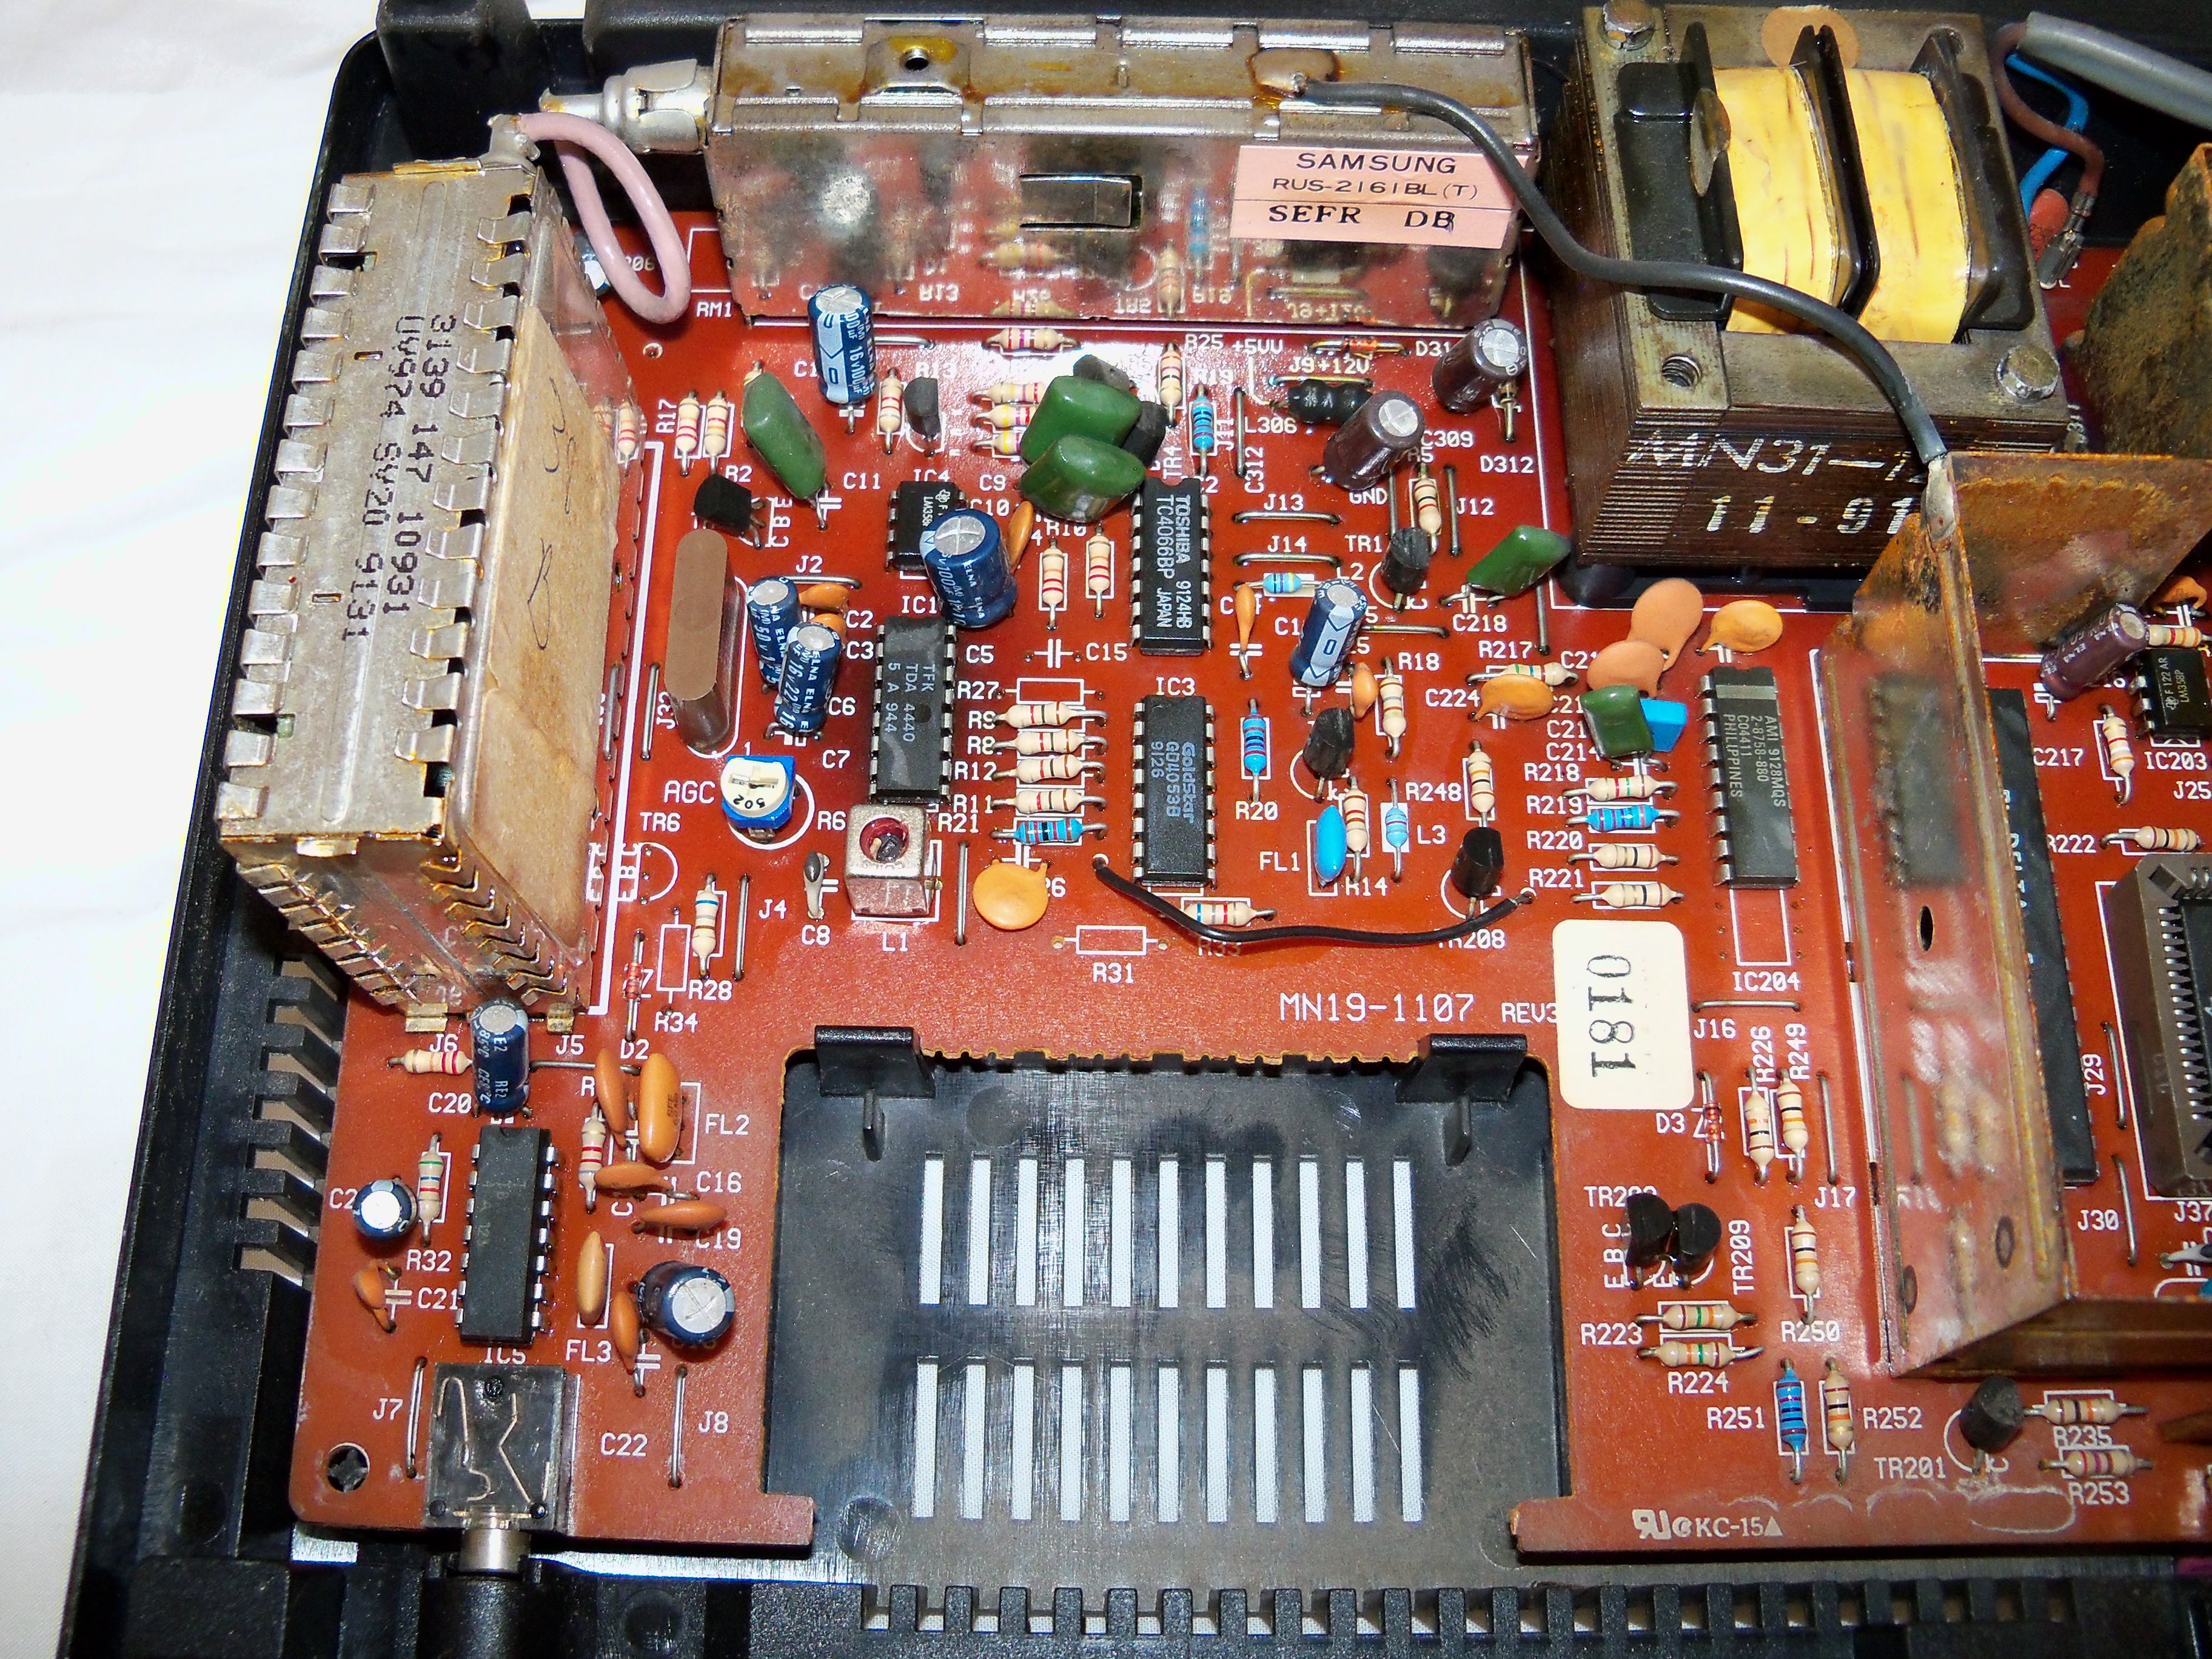
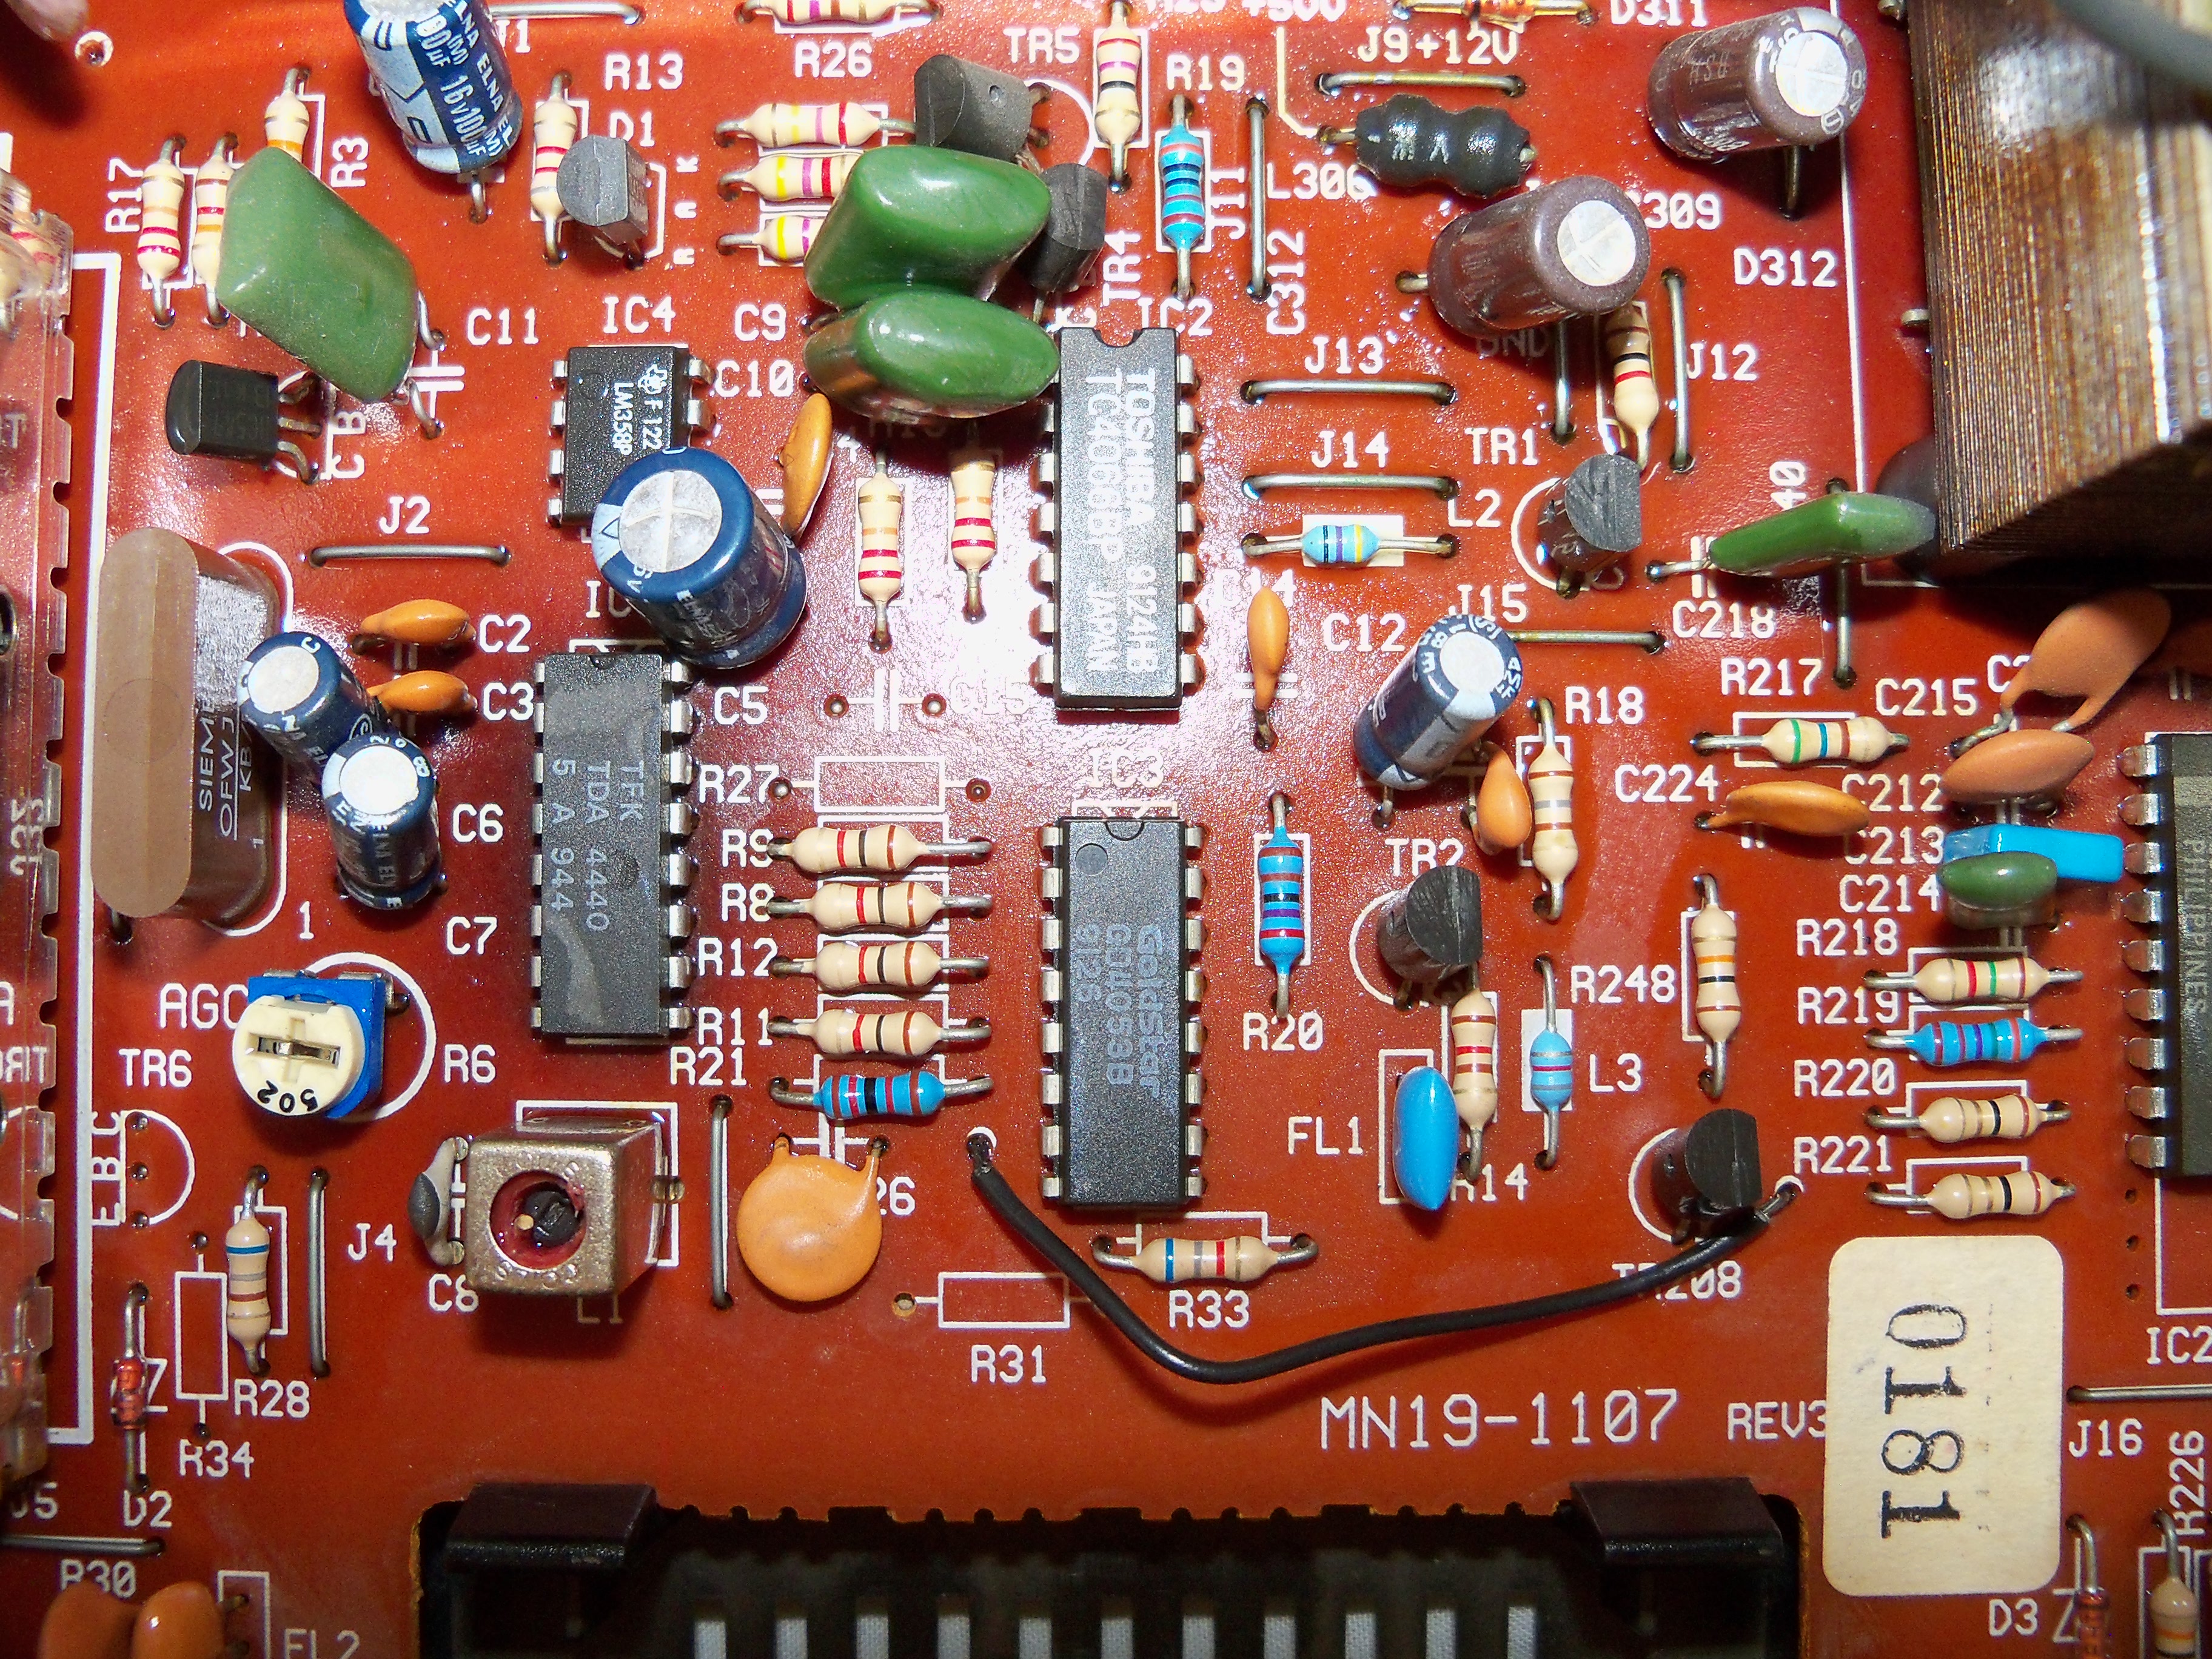
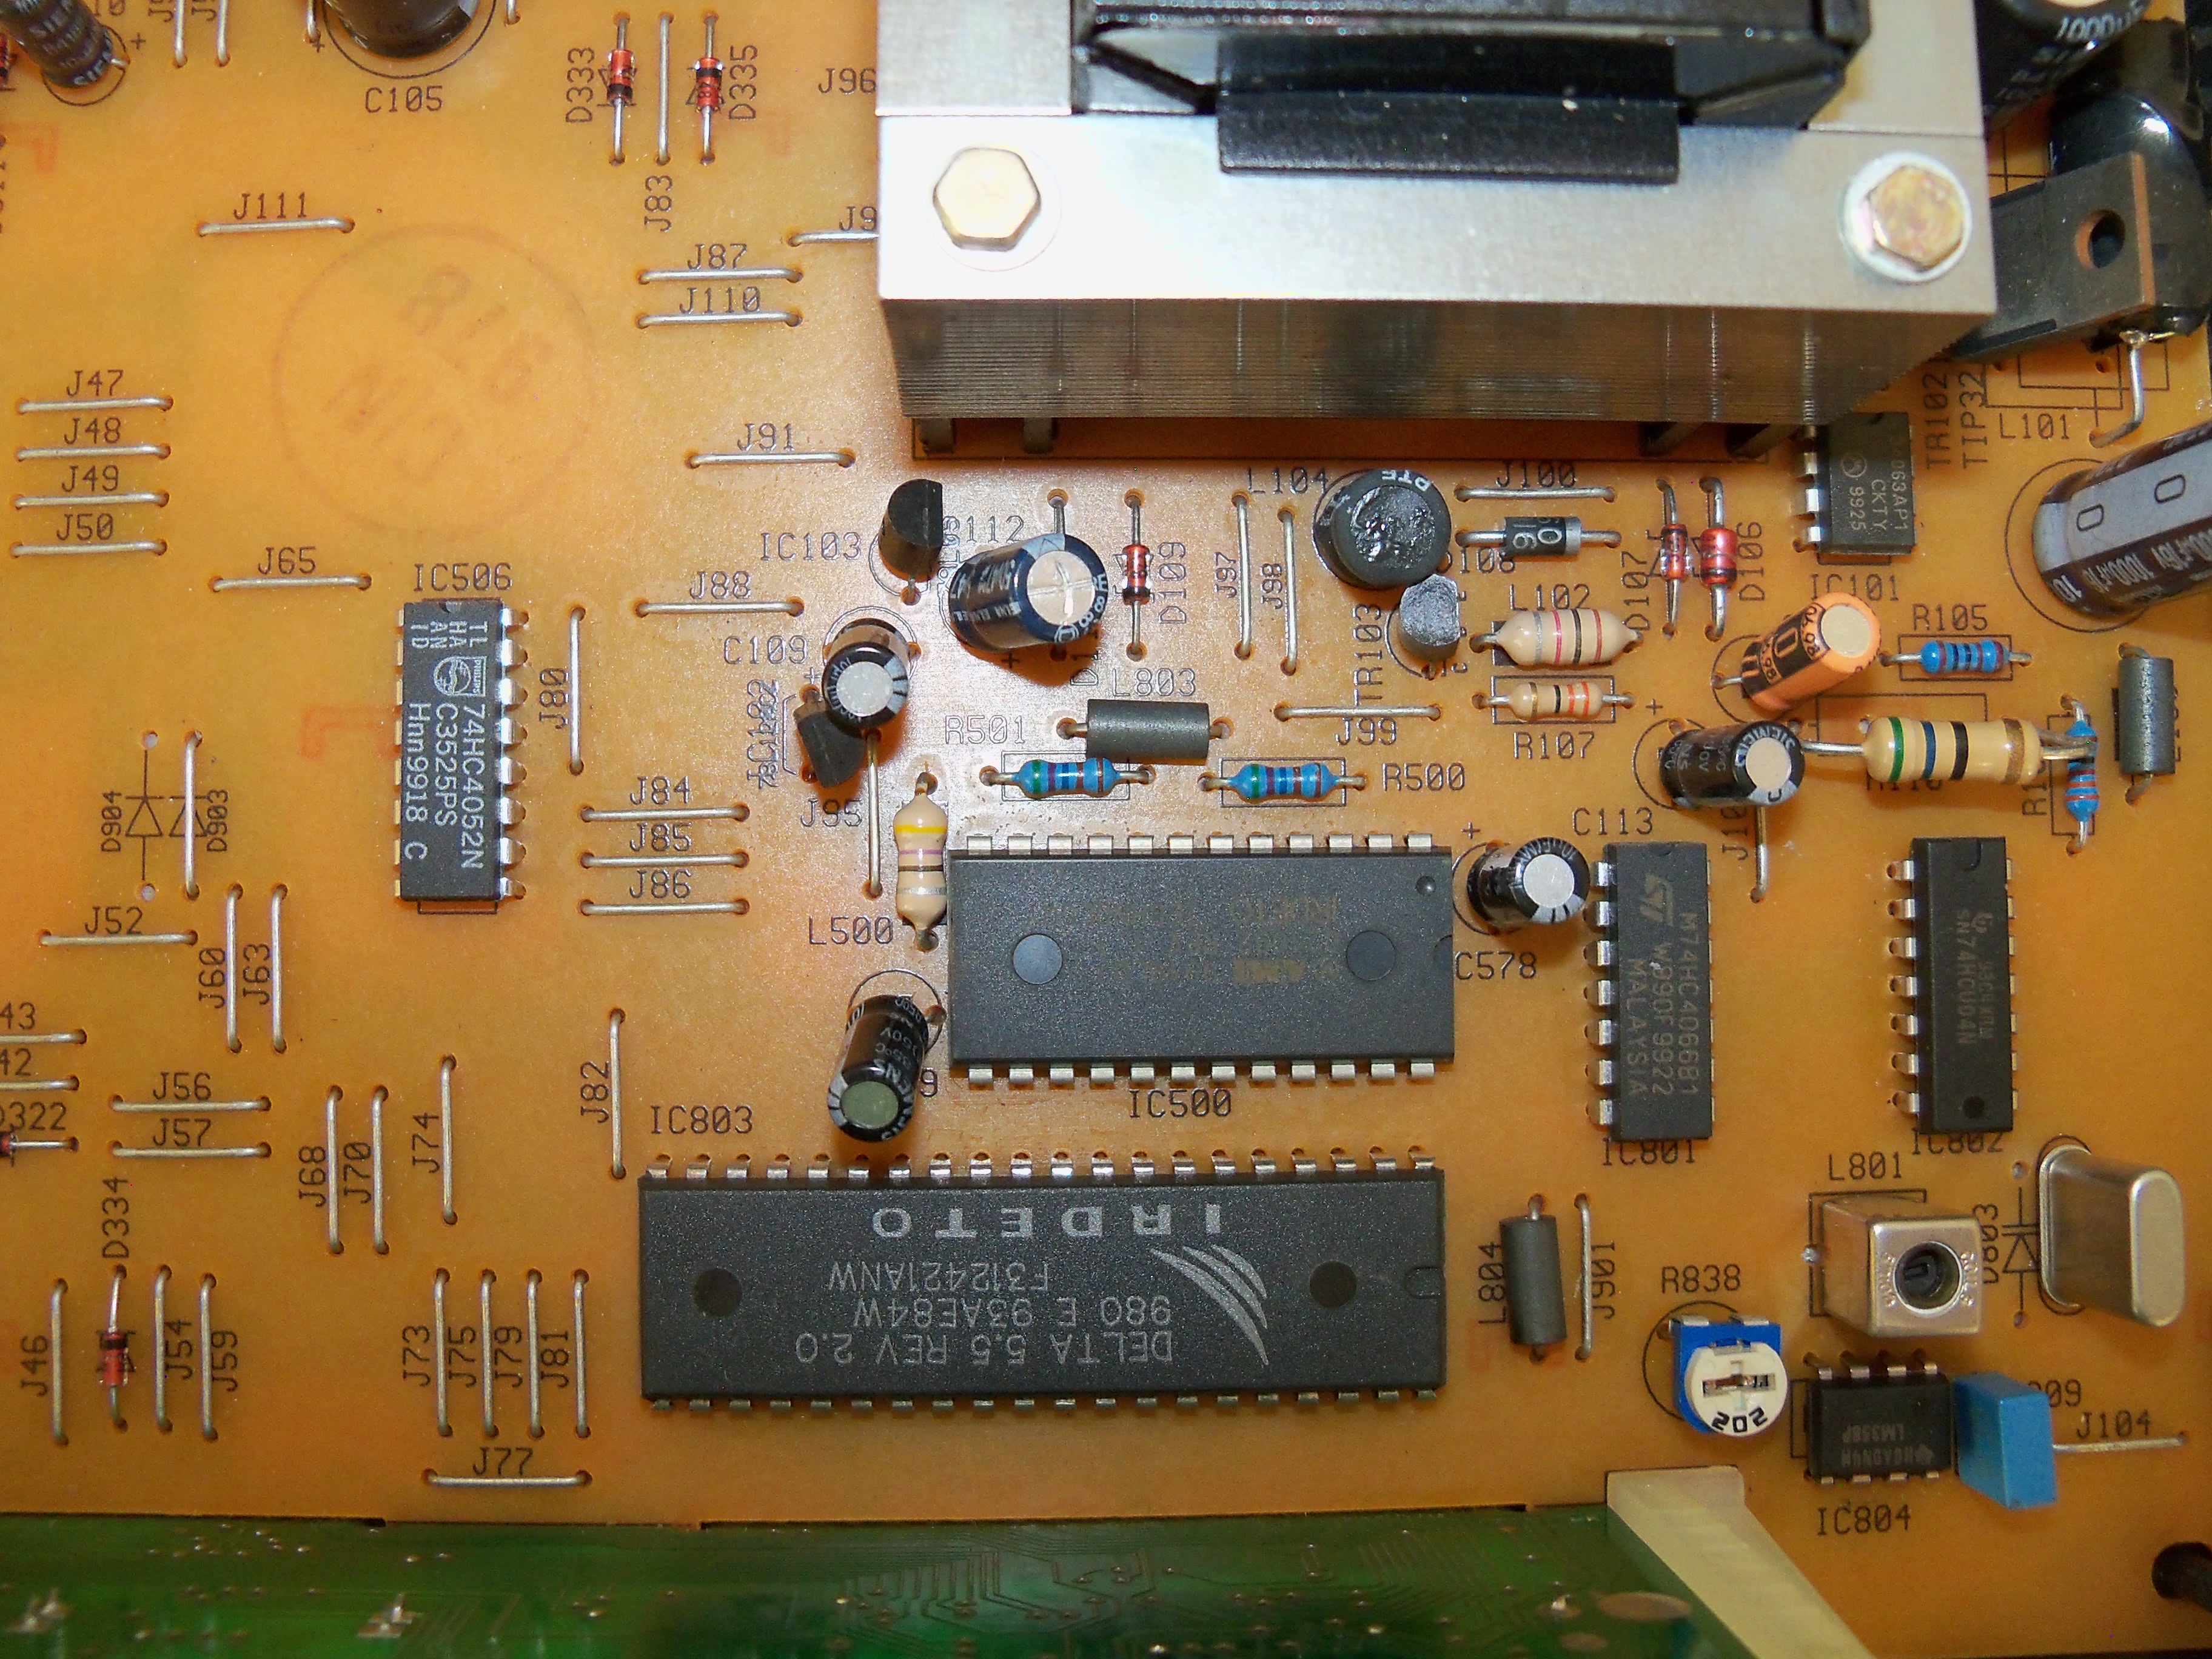
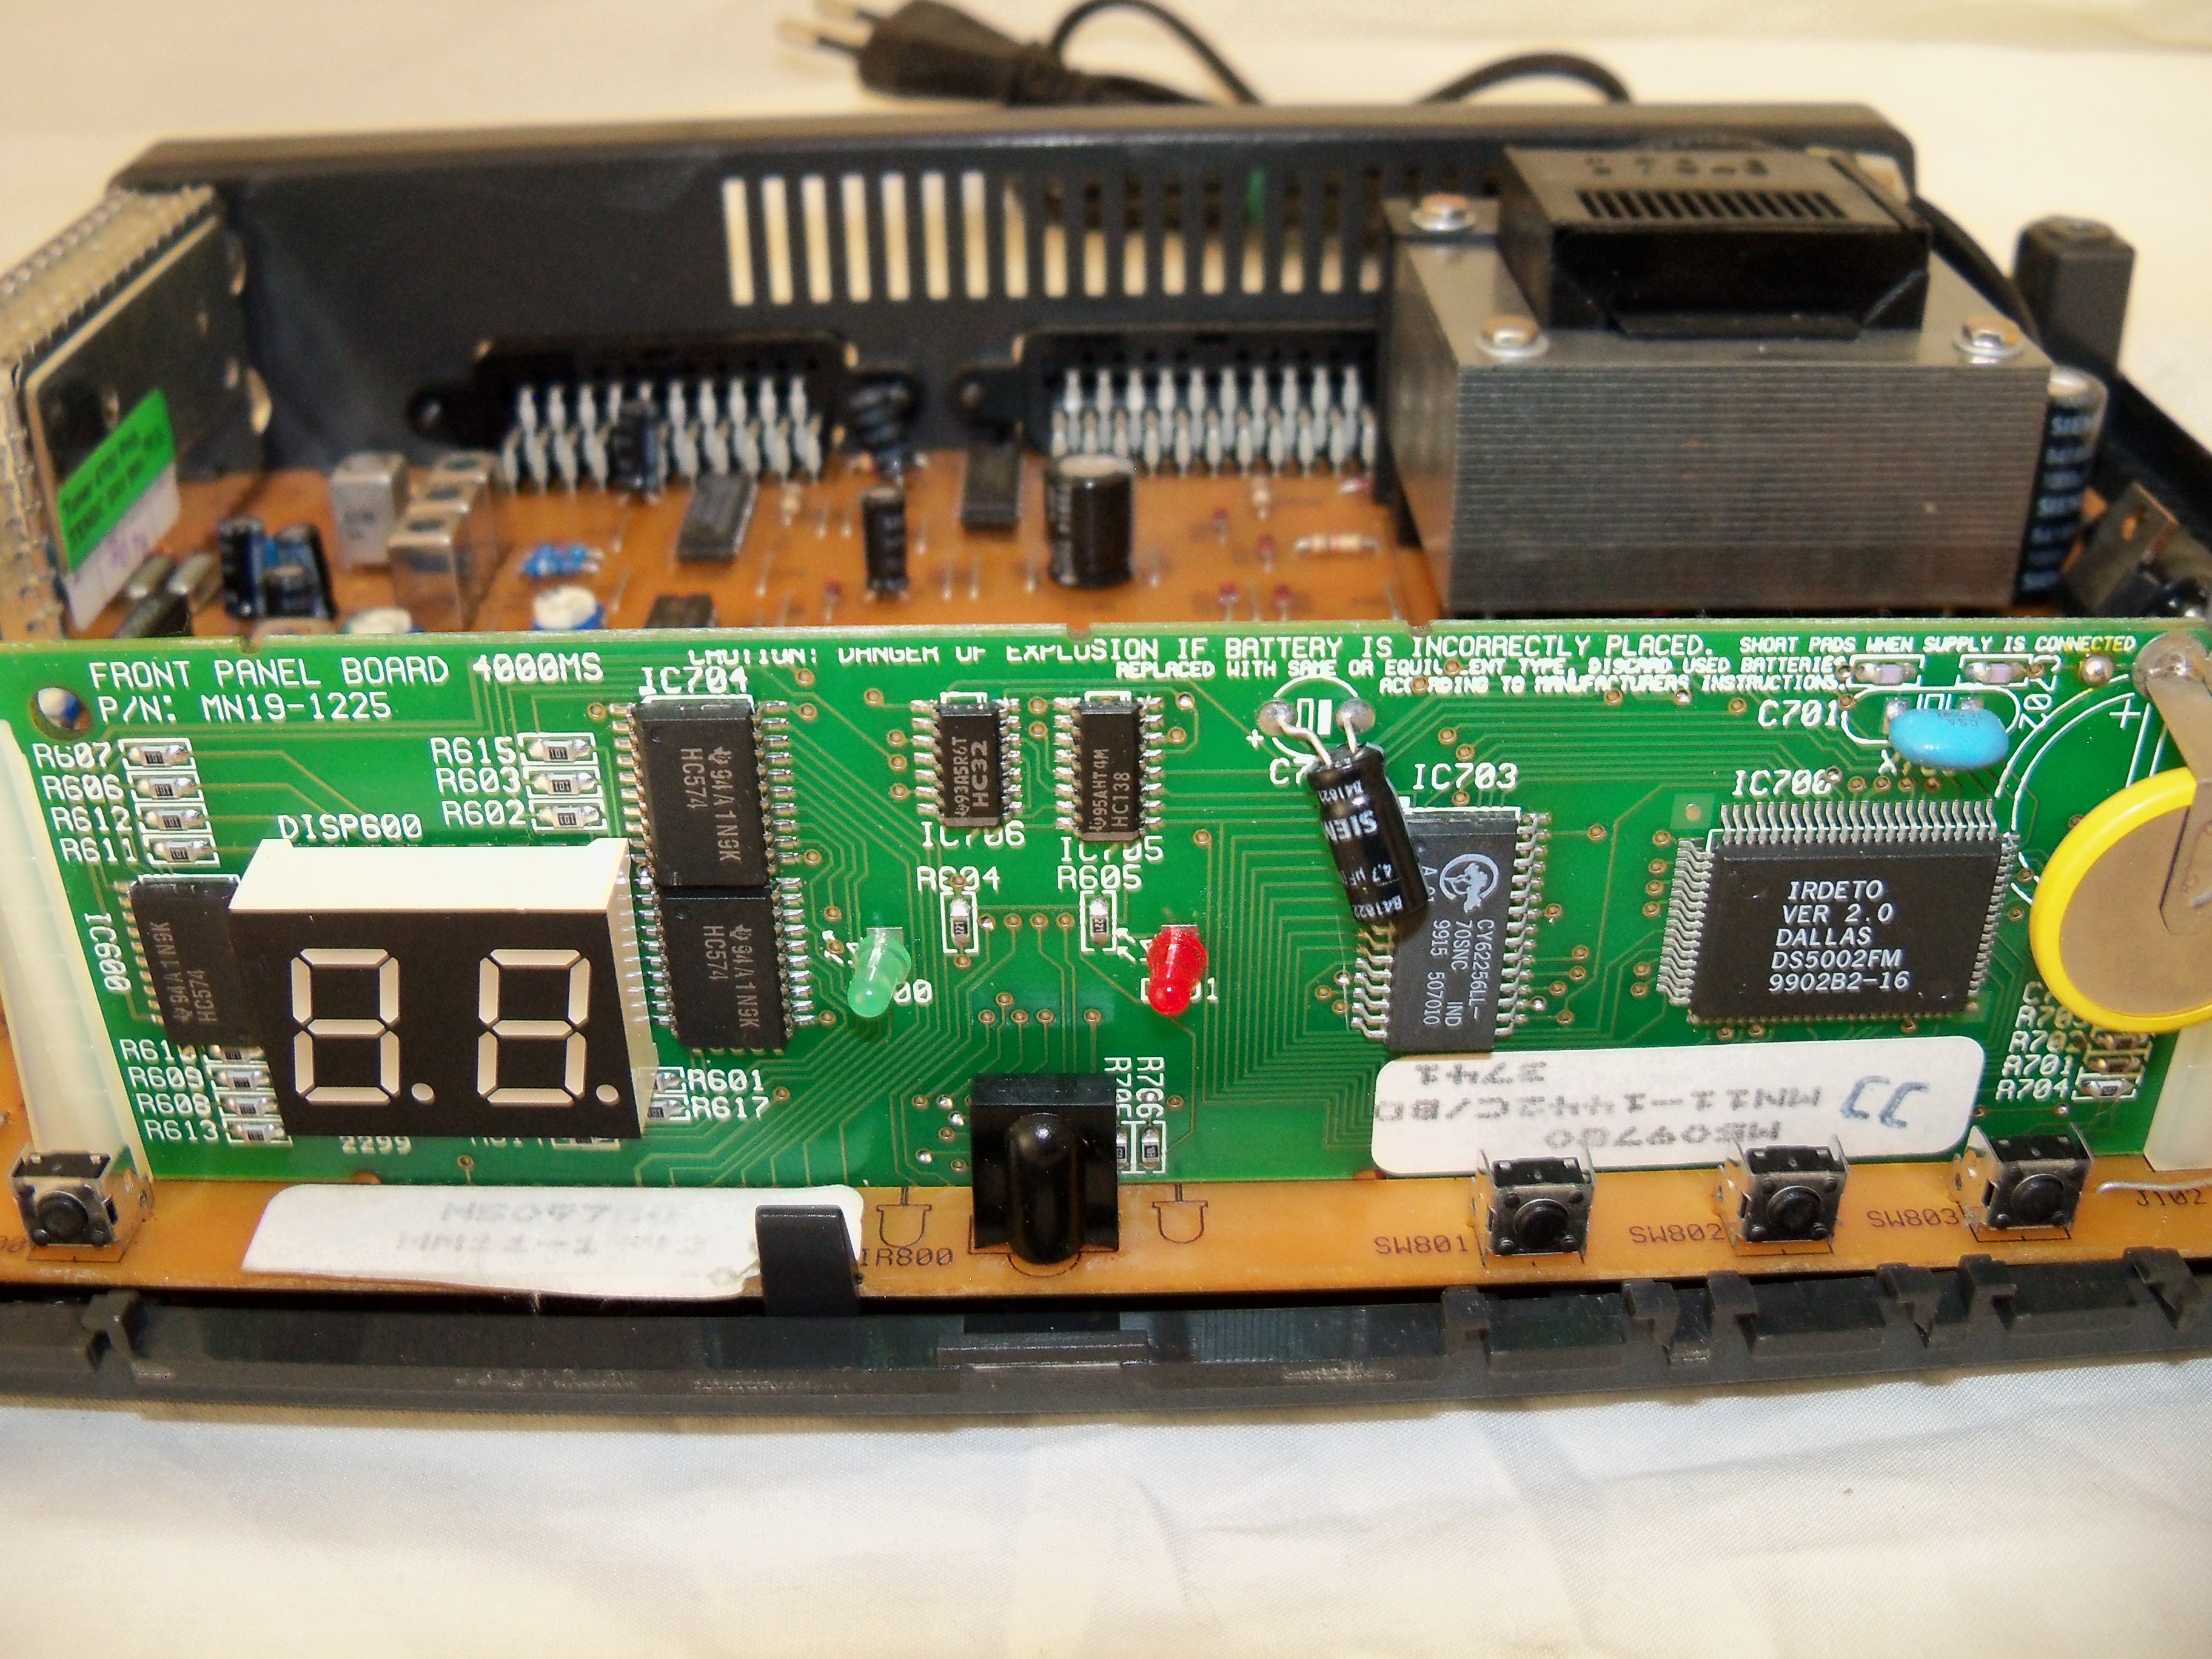
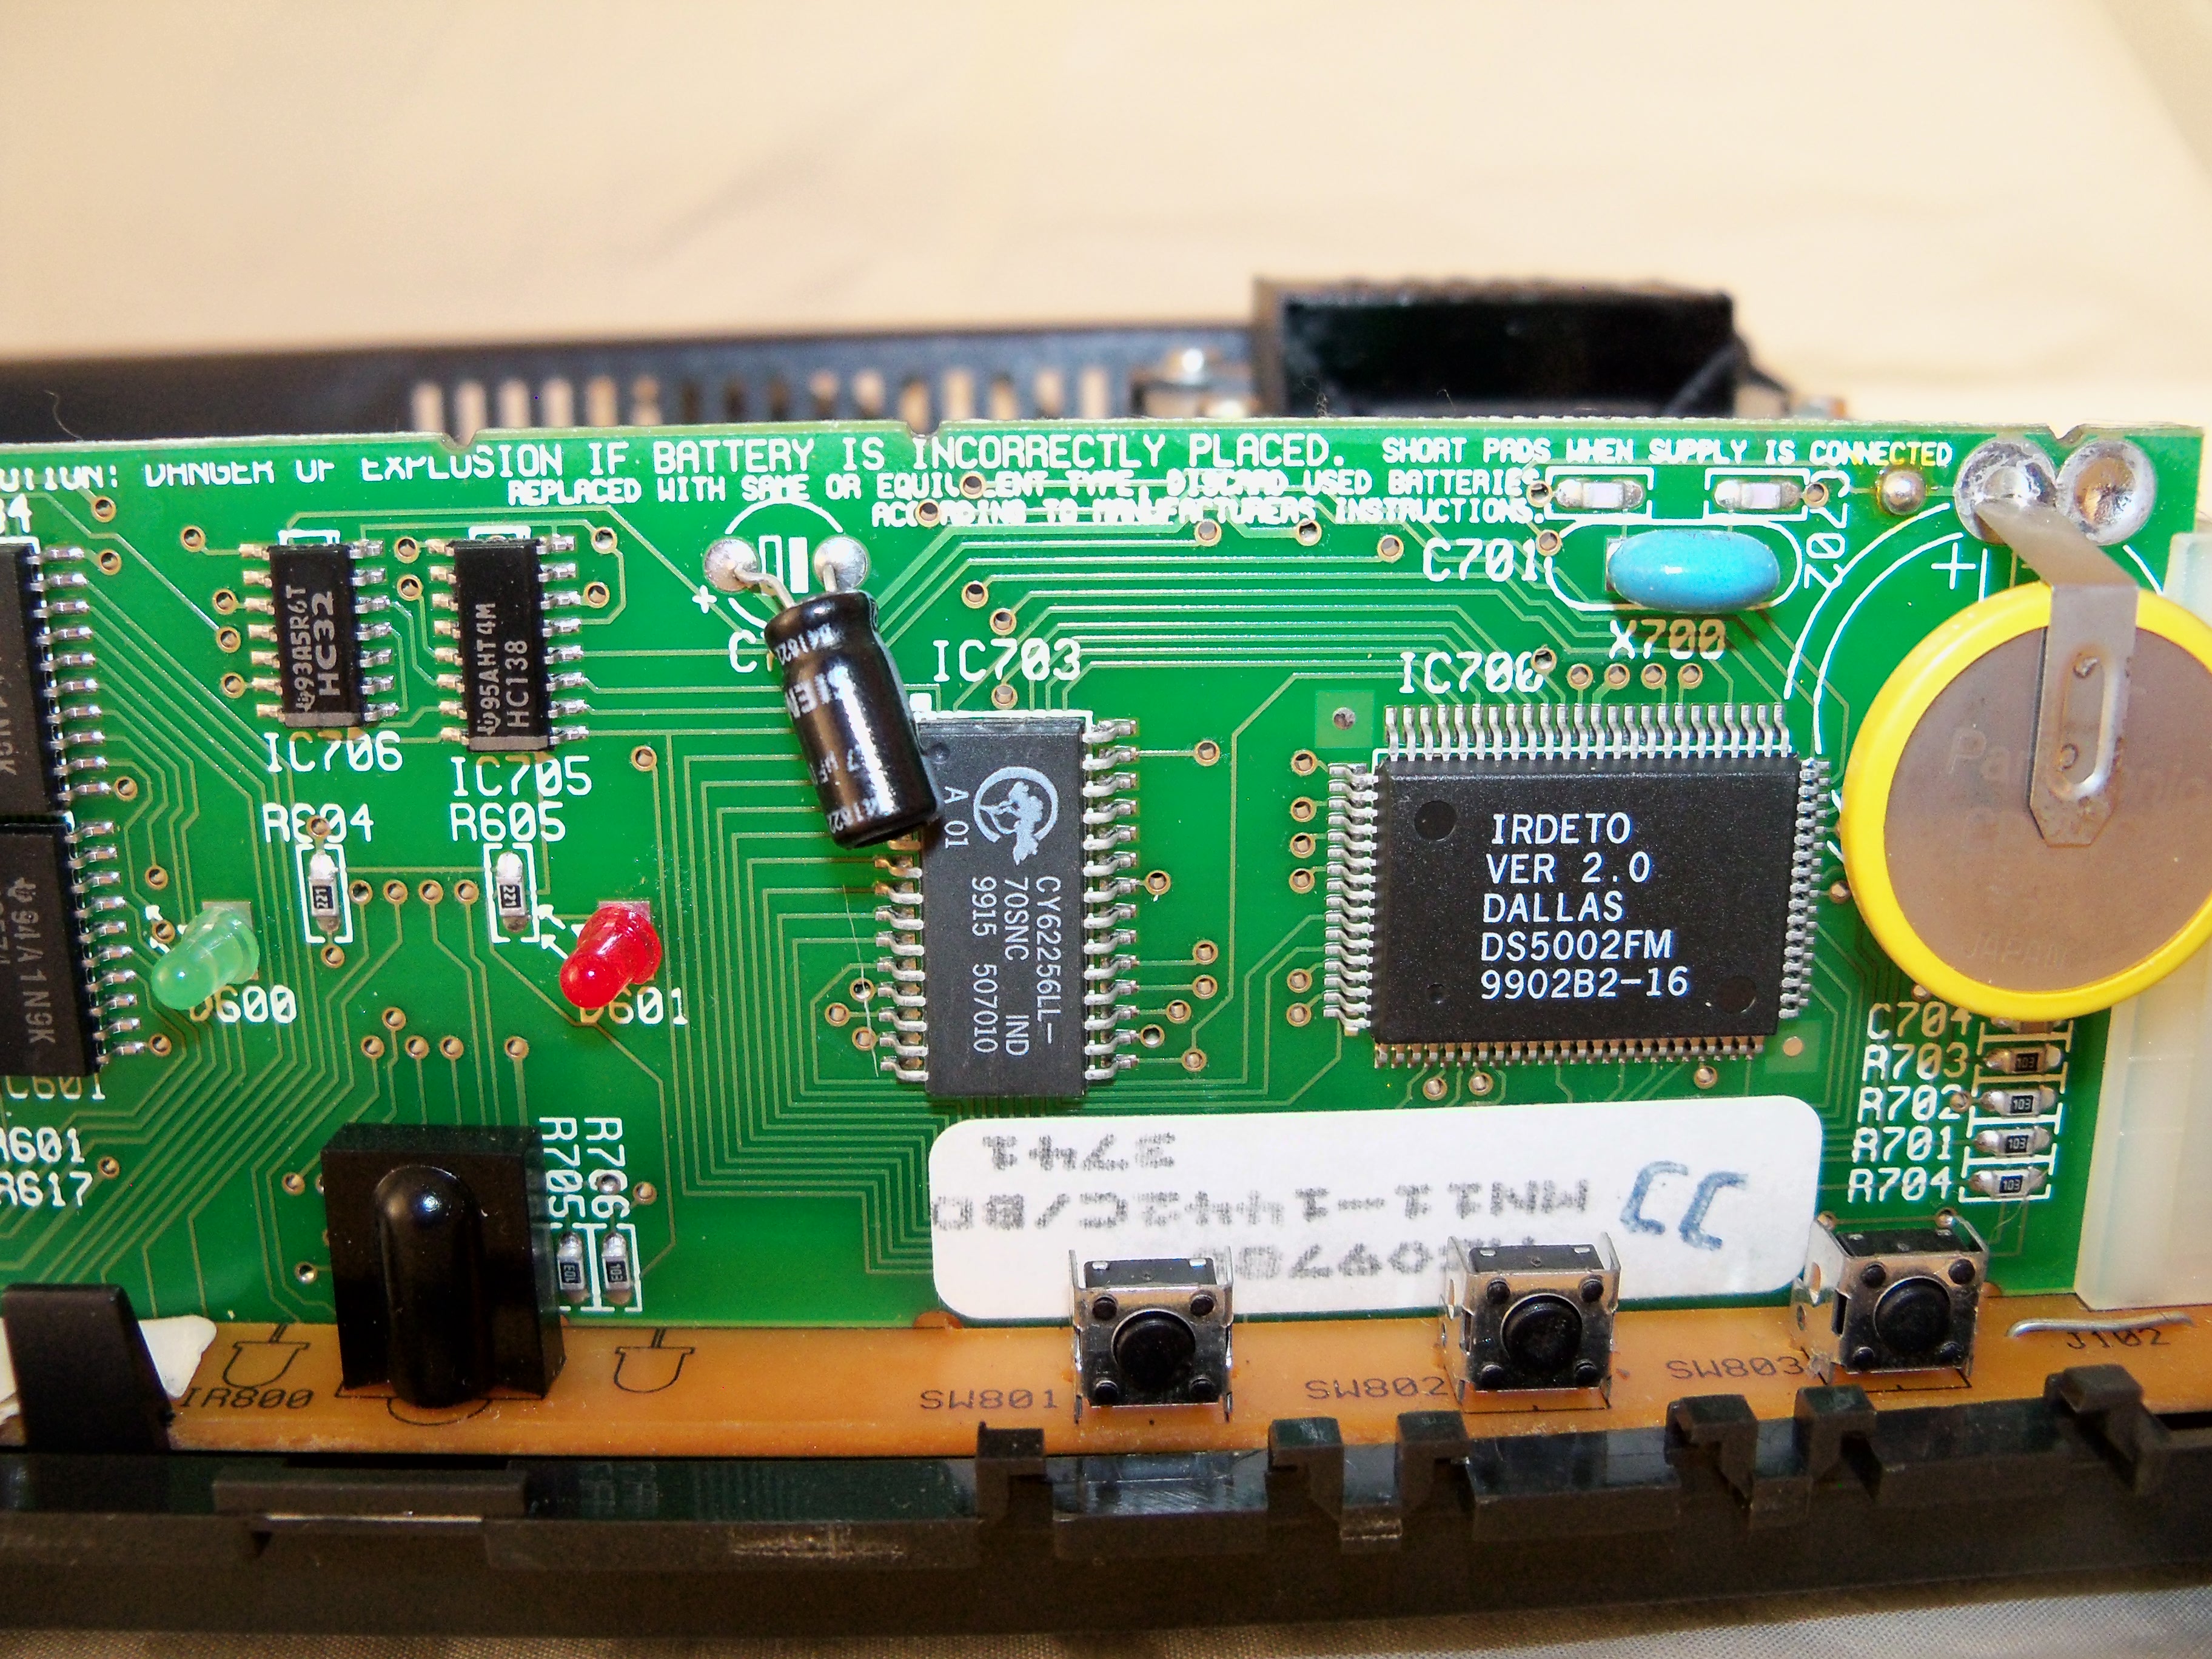
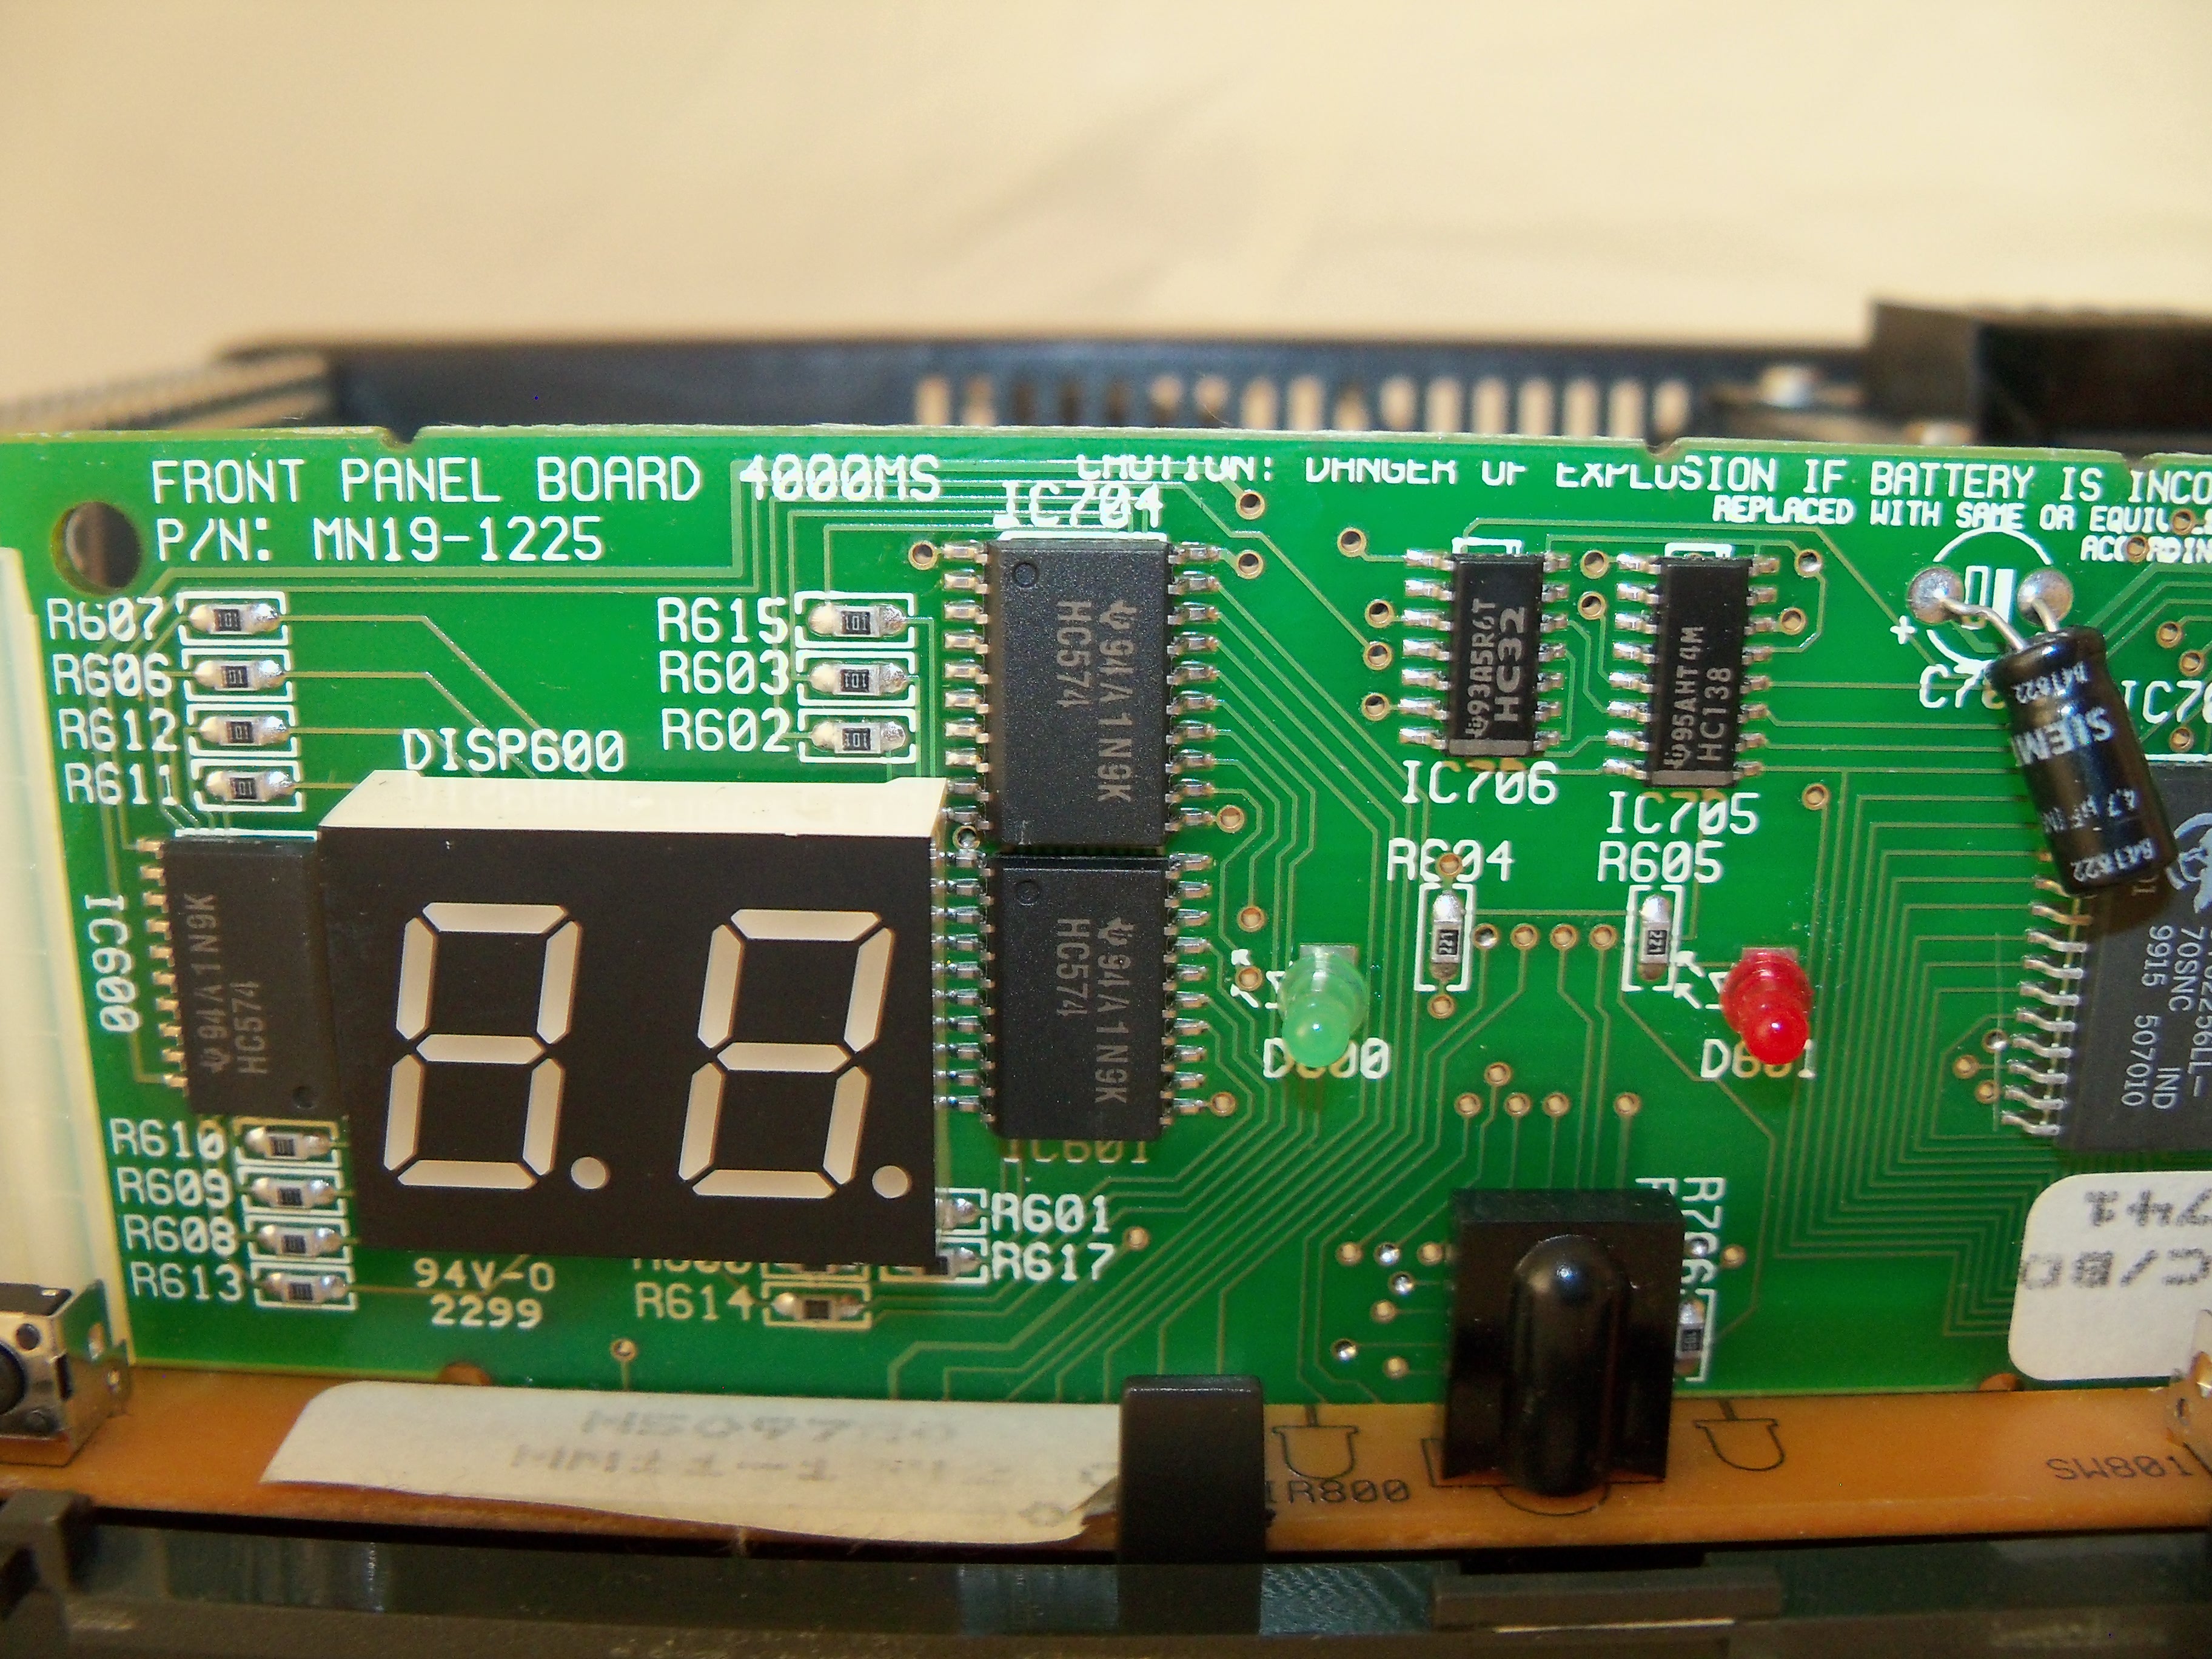
MNET used technology from OAK Industries. VIDEO SCRAMBLING - AN OVERVIEW, V.Bhaskaran and M. Davidov, 1984 M-NET DECODER PRODUCTION A TECHNICAL ANALYSIS David Robert Green, 1989 Hello DELTA! Shown above are the different models/versions of the Delta decoder sold from 1987 (MNET logo on the front) - 2018 (Comcrypt 4000). The Delta 9000 PLUS could be used with a satellite receiver (to receive MNET via satellite) and was stereo capable. The oldest model is the decoder with the user manual and remote on top. Notice the different slogan next to the MNET logo. The Delta decoder as it was called was the first decoder to be sold to the public. Later versions of the Delta 9000 are also shown. Also above is the smaller and cheaper Compact 9000 which became available during the early 90s. The Compact 9000 had no remote control and only UHF out, where the Delta 9000 had a remote control and AV outputs also. A size comparison between a Delta 9000 and Compact 9000 is shown. Interestingly, the motherboard in the Delta is only about the size of a Compact 9000 although the board layout is different. A design where the board for the front facia "snaps" off the main circuit board during manufacture is used. Also, the main board just clips into the casing making assembly easier. Earlier motherboards could have been larger, hence the large case of the Delta. The two most prominent chips is the micro-processor and "Delta" chip where the actual decryption happens. The micro-processor has a label on it corresponding to the code label on the outside of the decoder. The "serial number" seems to be burned into each micro-processor during manufacture. Age sequence as far as I know is:
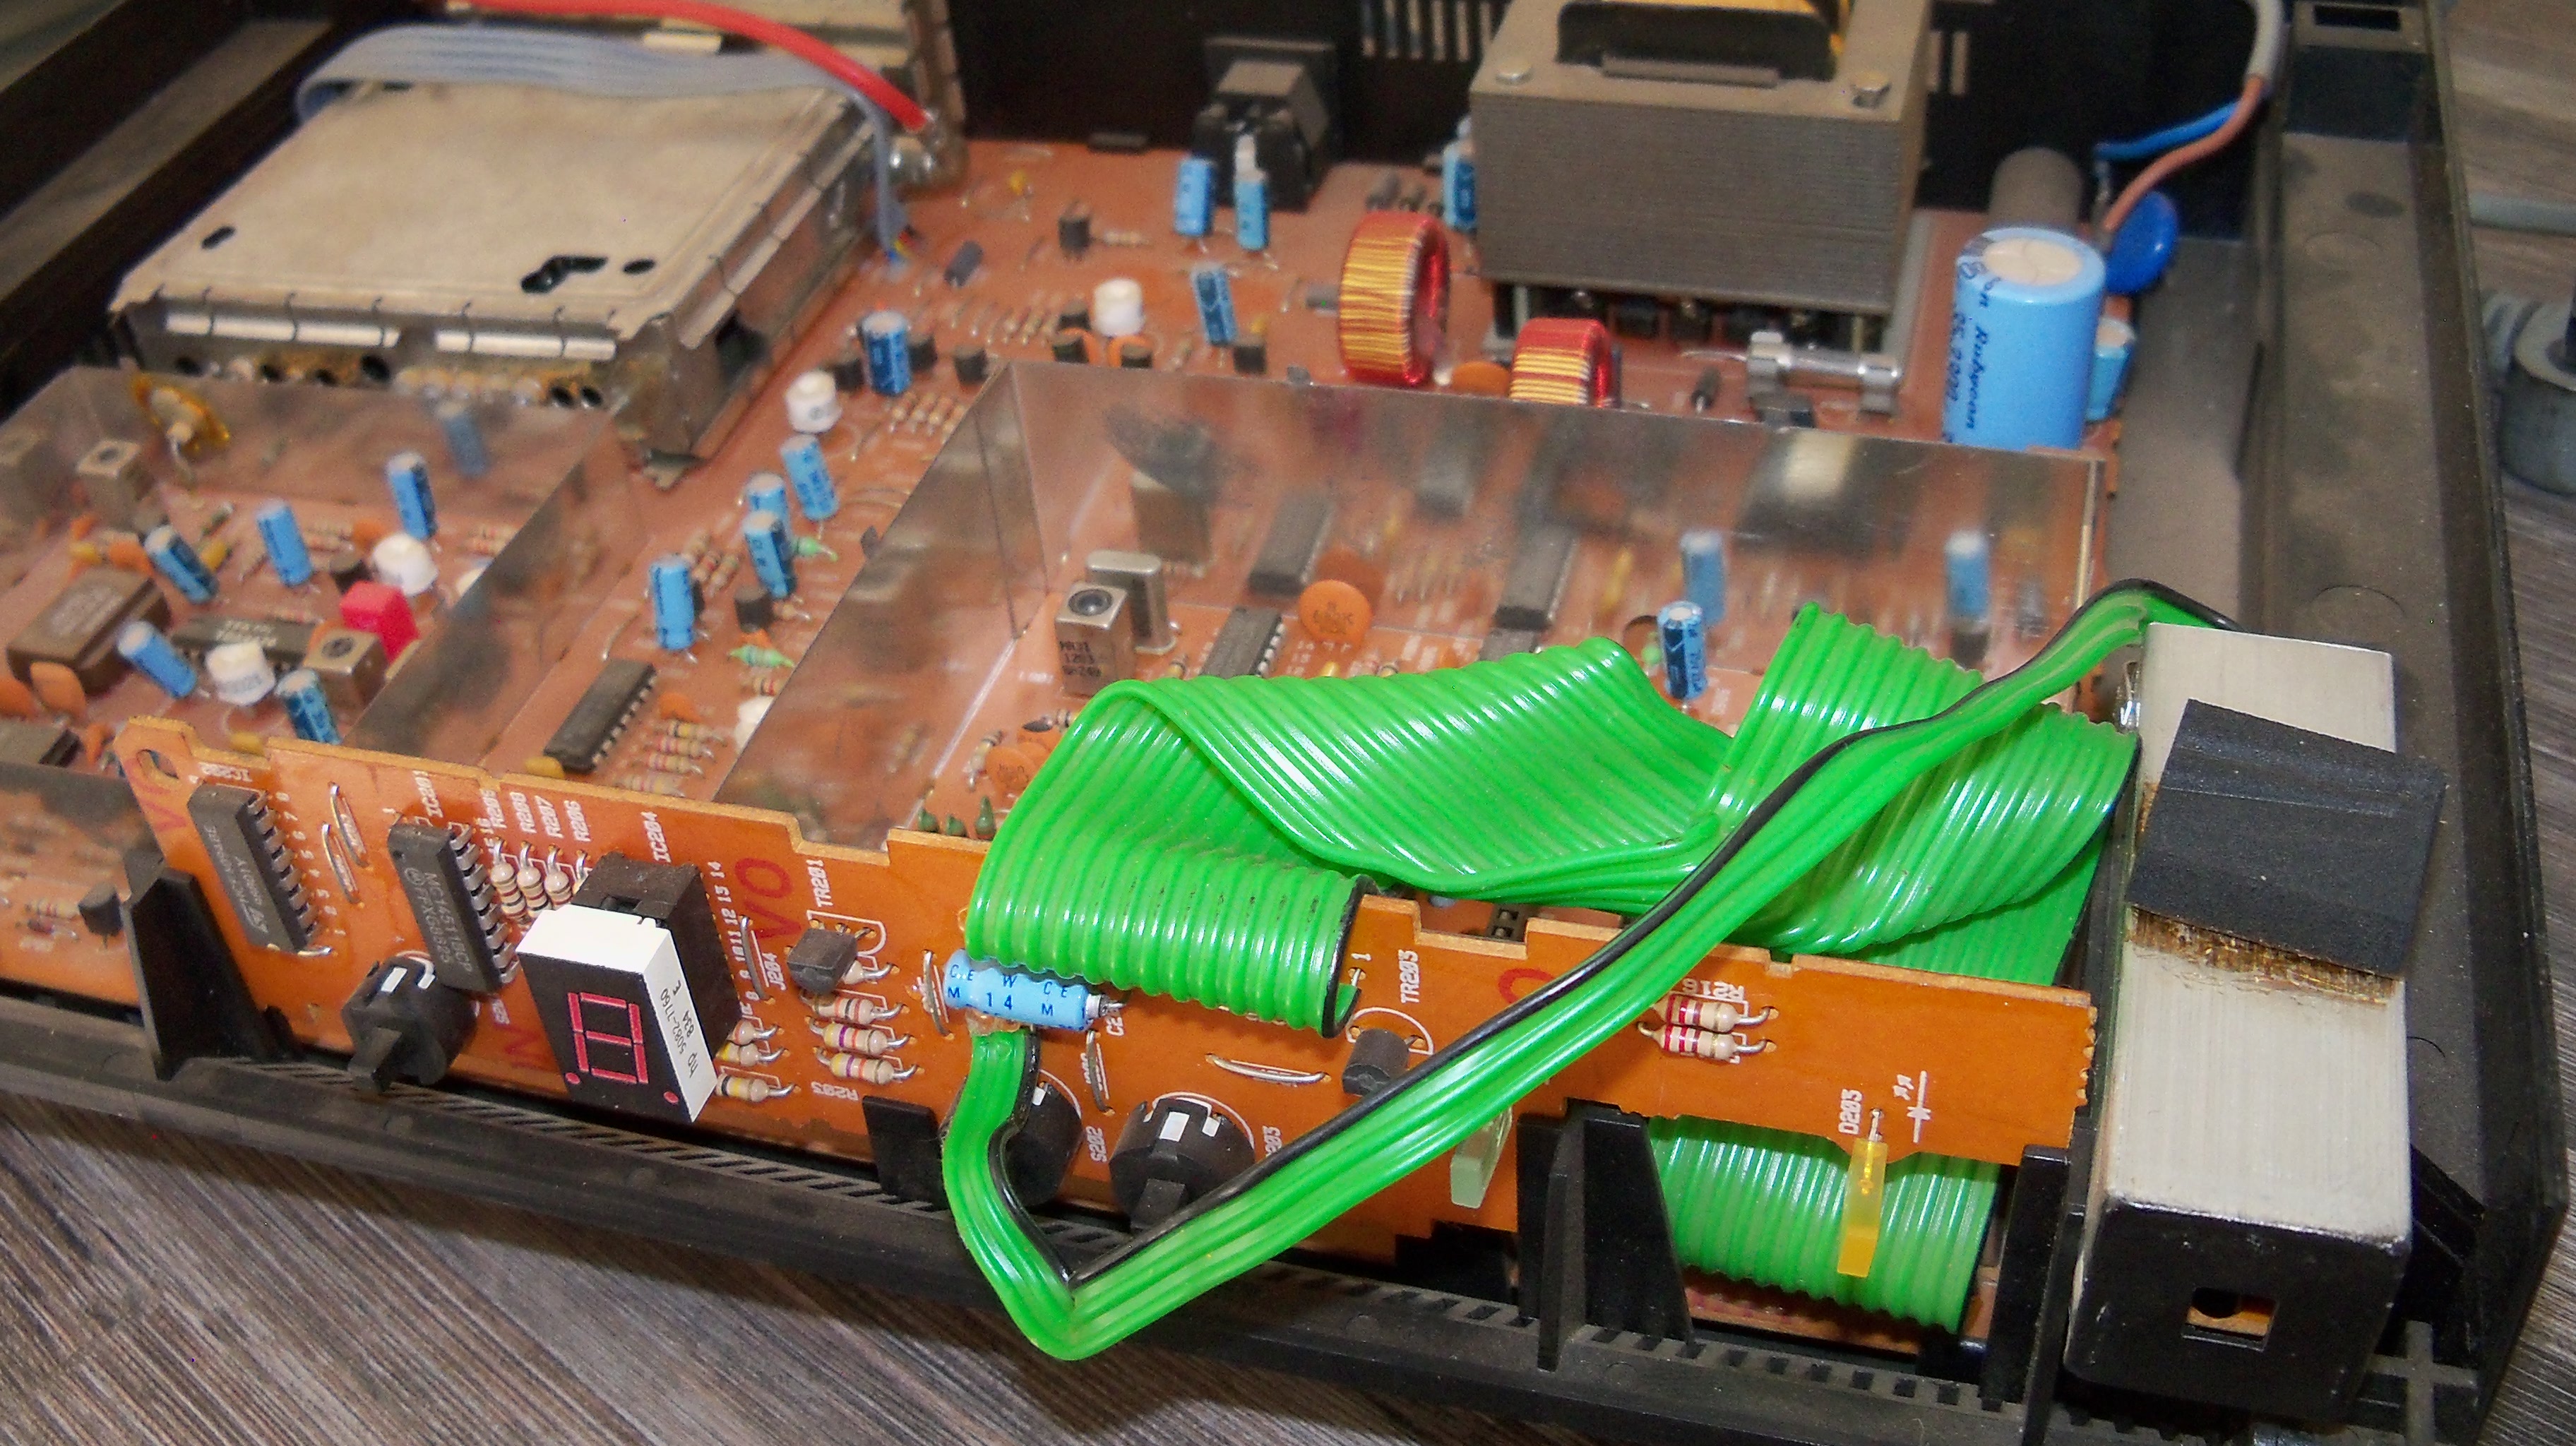
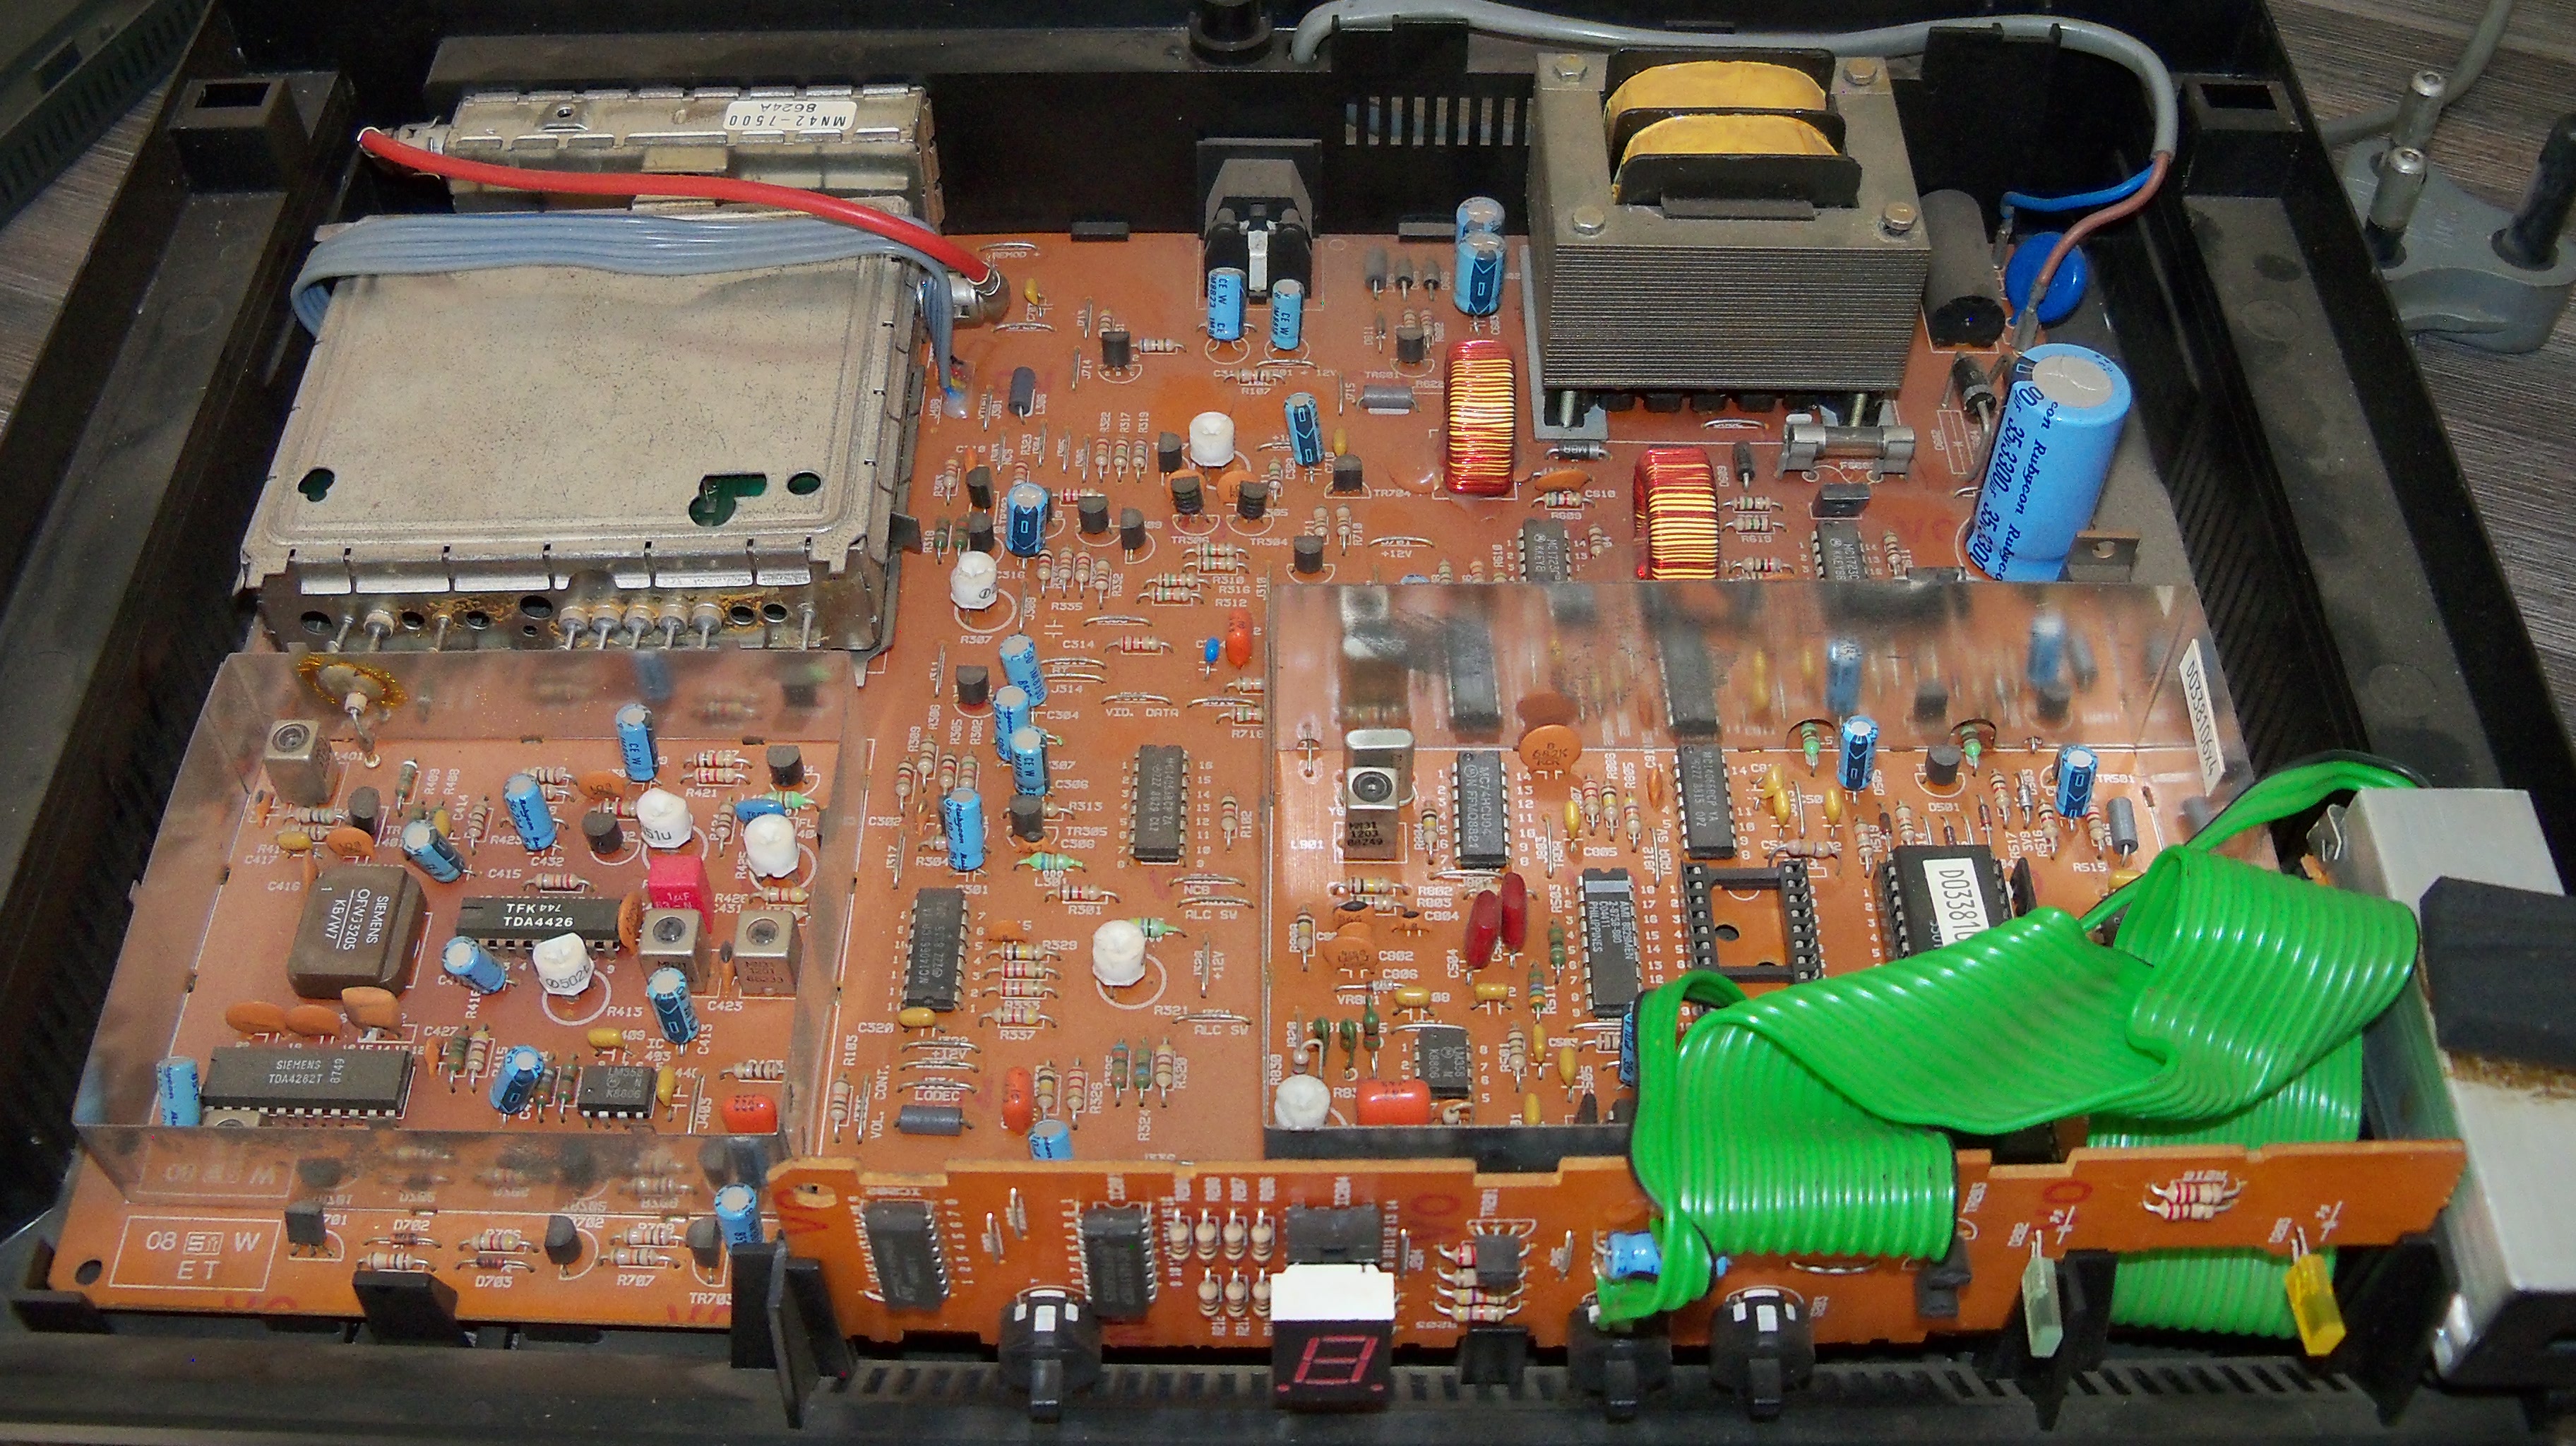
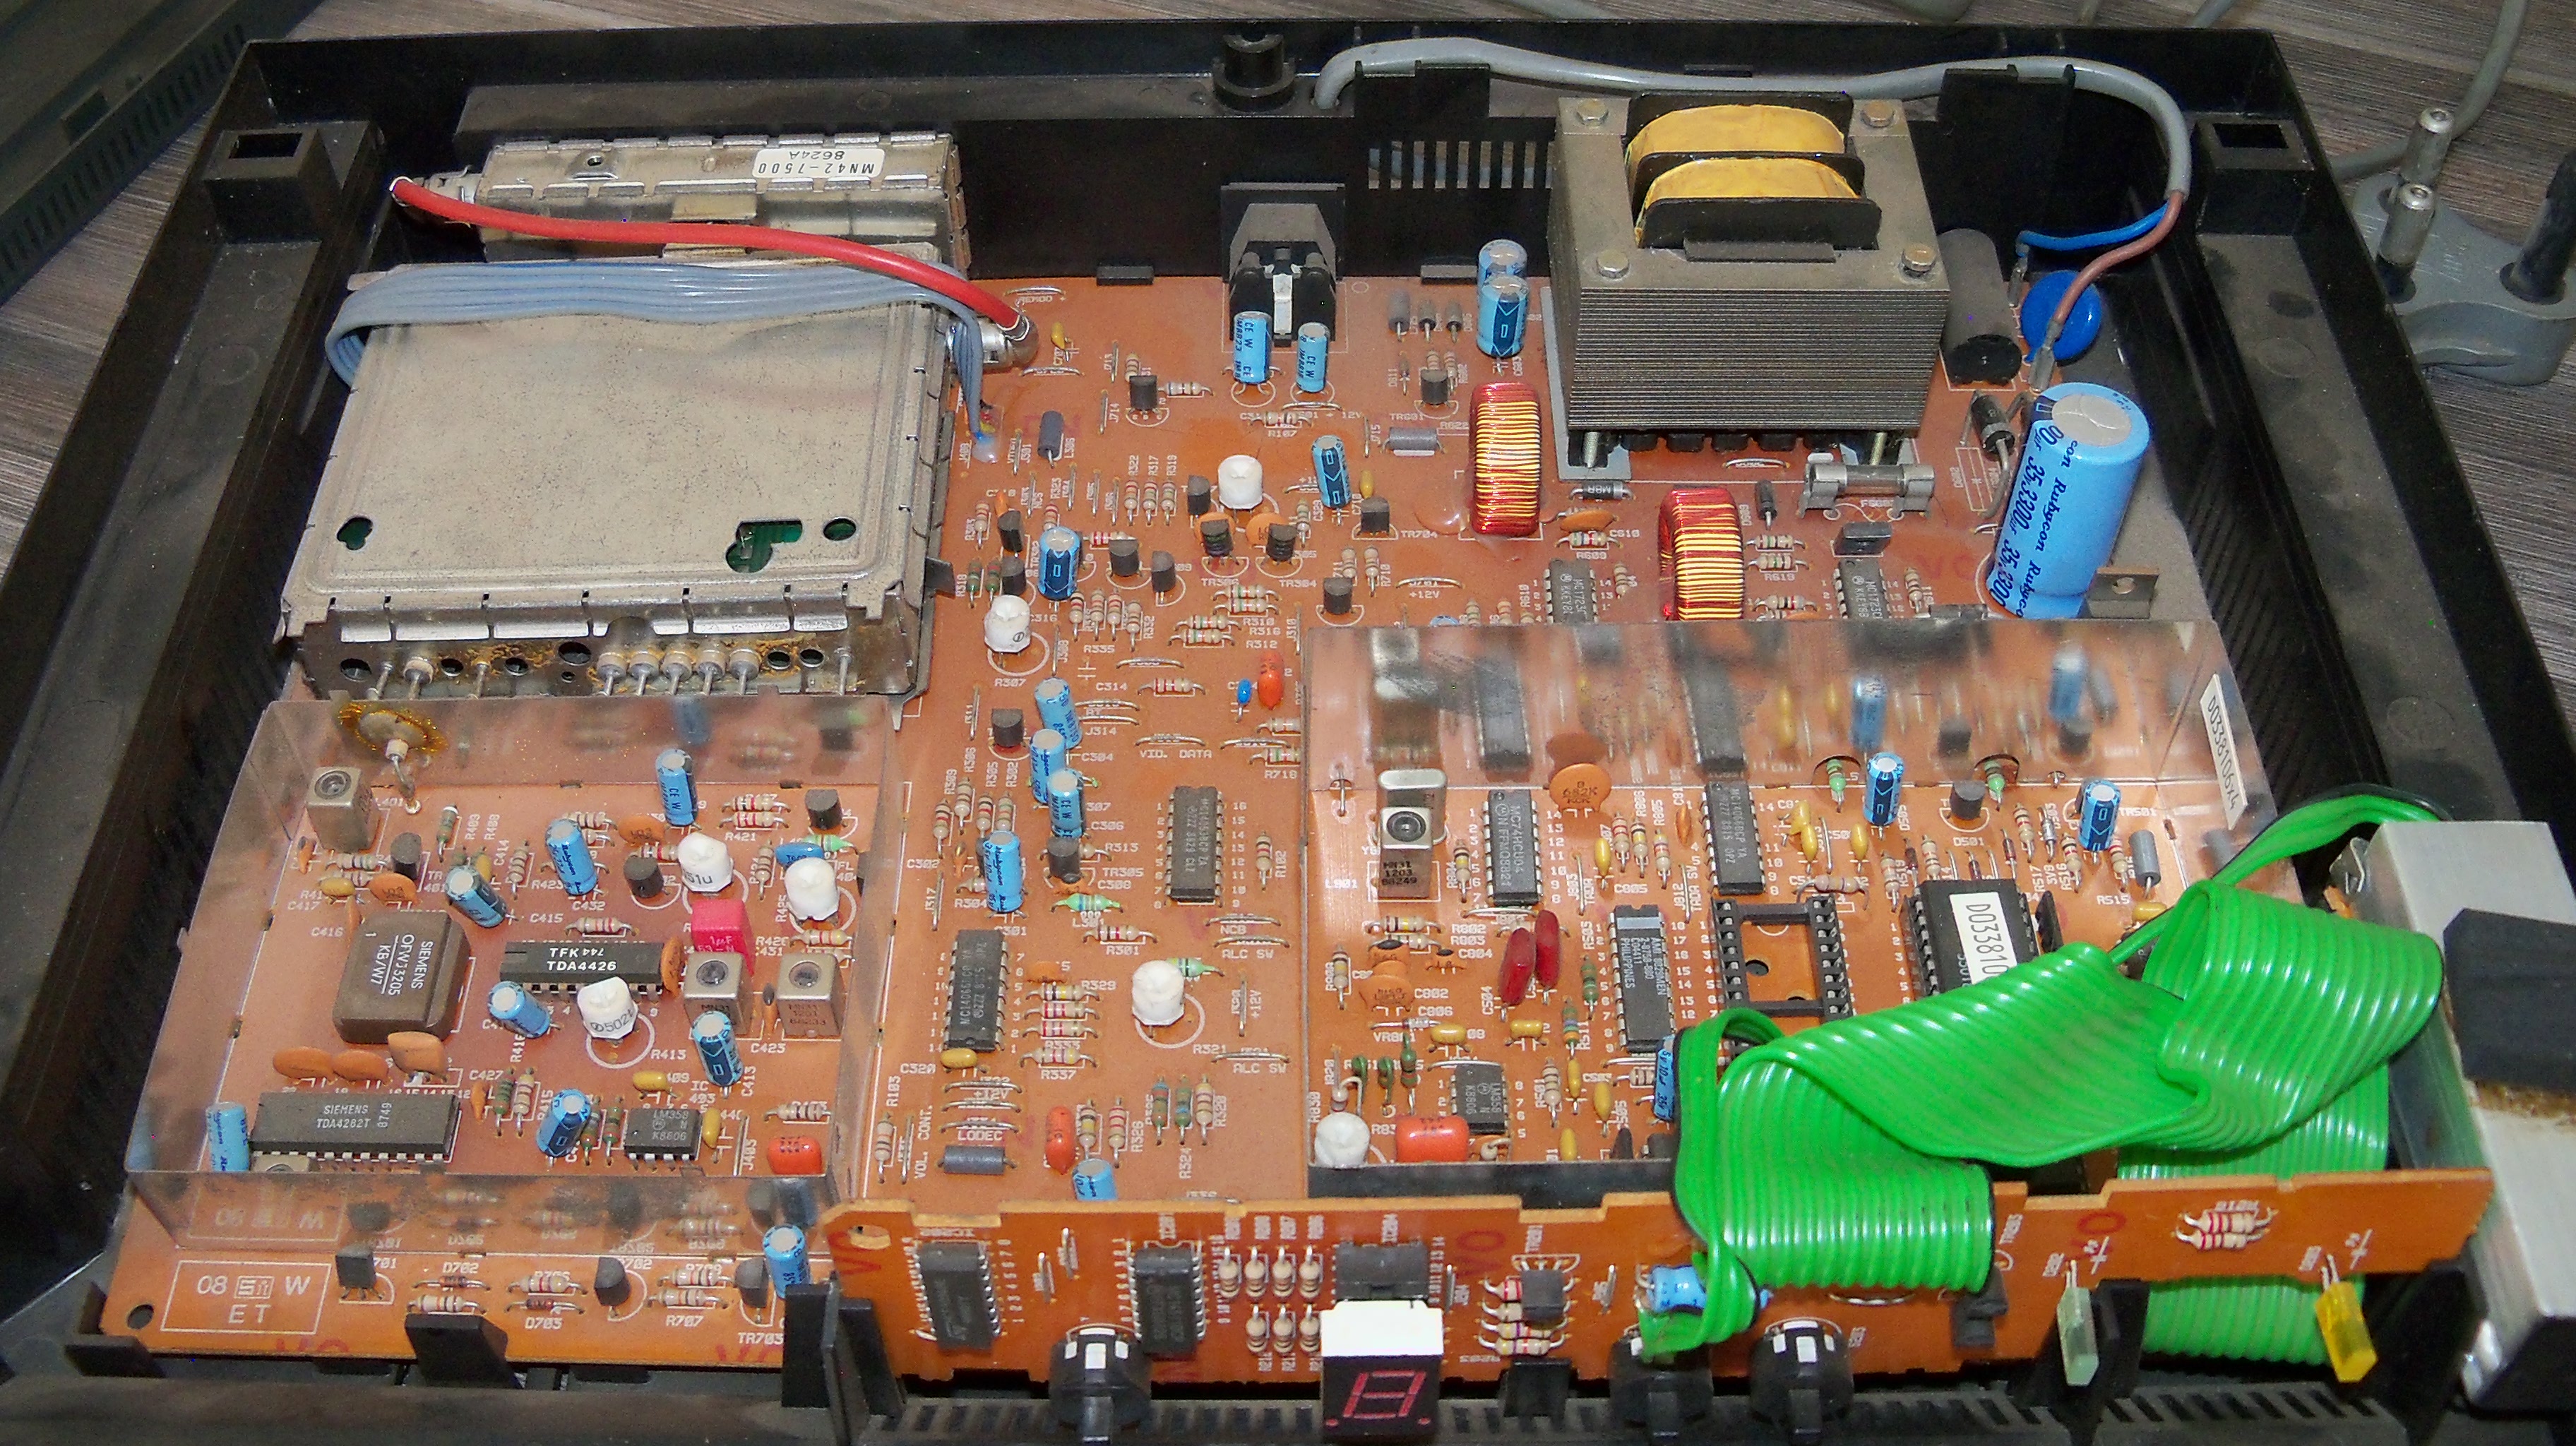
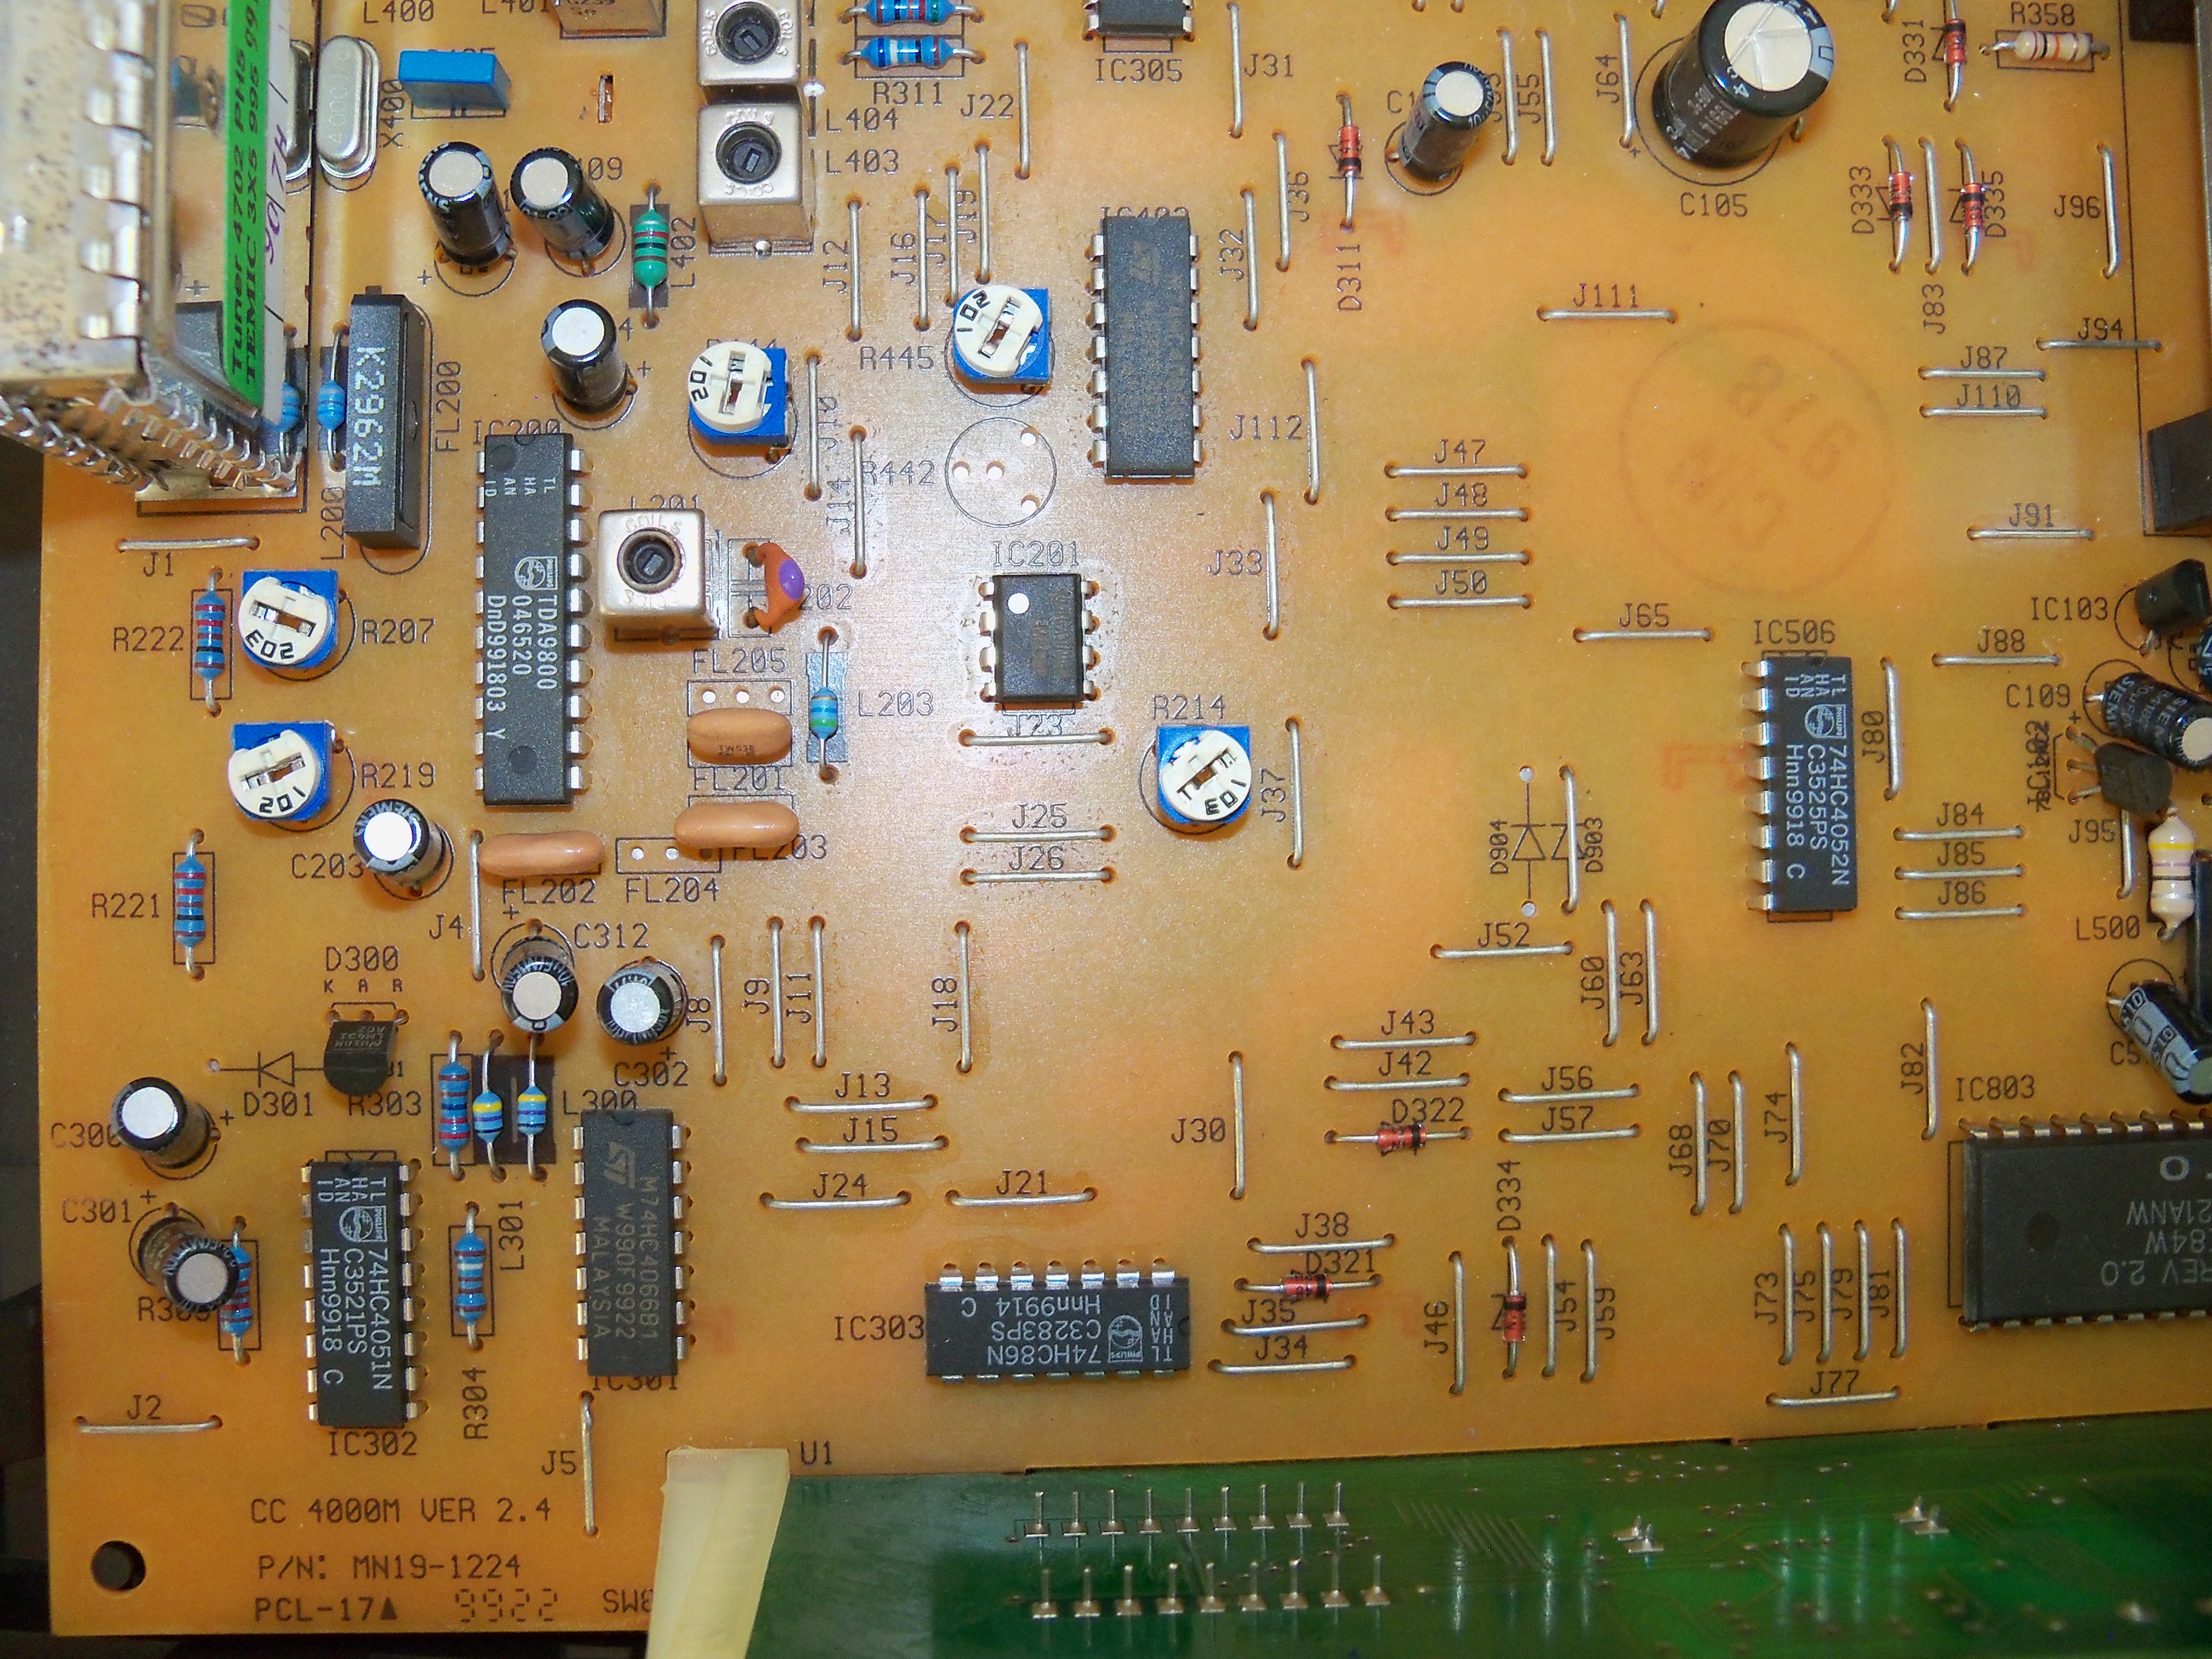
A Look Inside Delta 9000 logo. PCB layout is identical to unit below. Notice the very large IR receiver. MNET logo - Own the Silver Screen (~1987). The clips on this unit were broken indicating it had been interfered with. The Delta 5 ASIC was mssing. Above, Delta 9000 PCBs MNET logo - We won't stop the magic with Delta insignia and 9000 lettering.
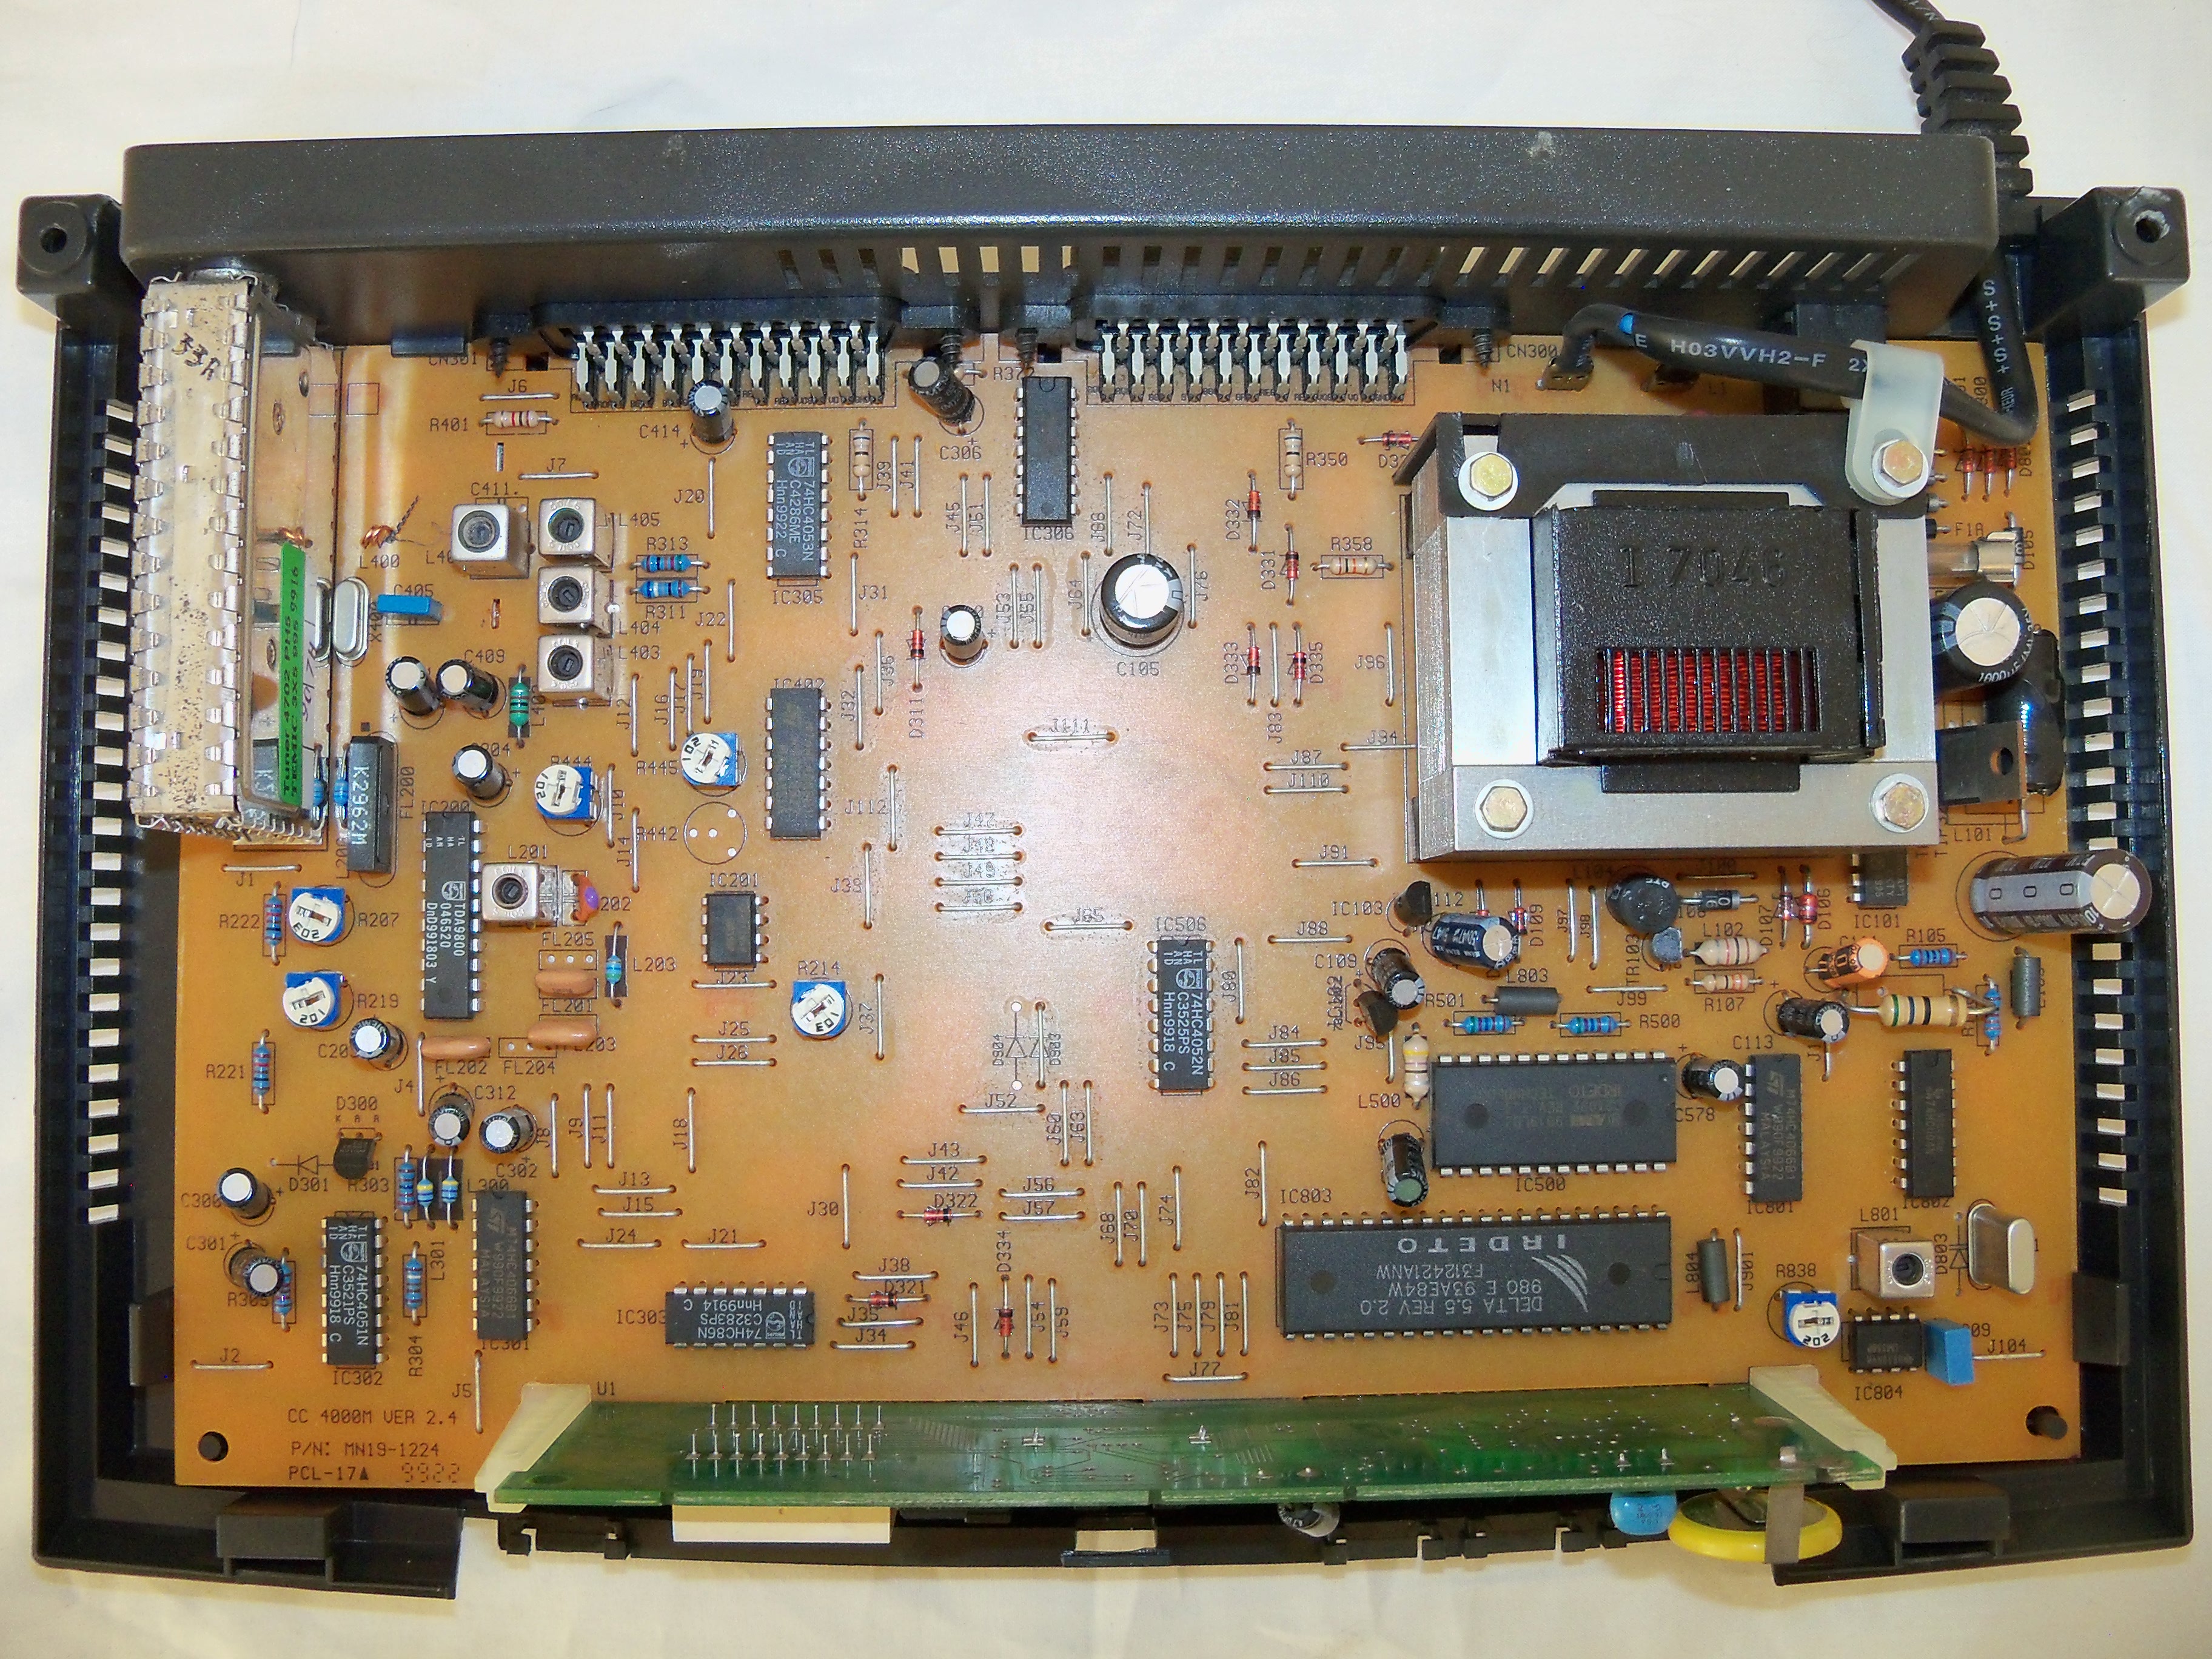
Above, Compact 9000 PCB Above, Comcrypt 4000M PCB I still remember the giddy excitement when my parents bought a Compact 9000 at Christmas time 1992. It was just after MNET changed their corporate look.
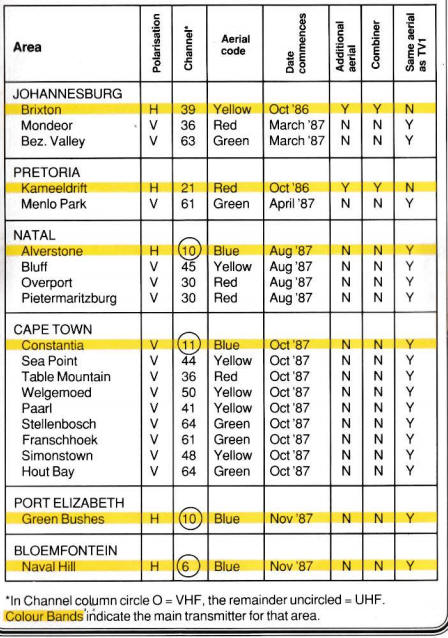
The delightfully illustrated and well written user manual that came with the first decoders (left). The dates that different transmitters went live with MNET (right, right-click and select open in new window)
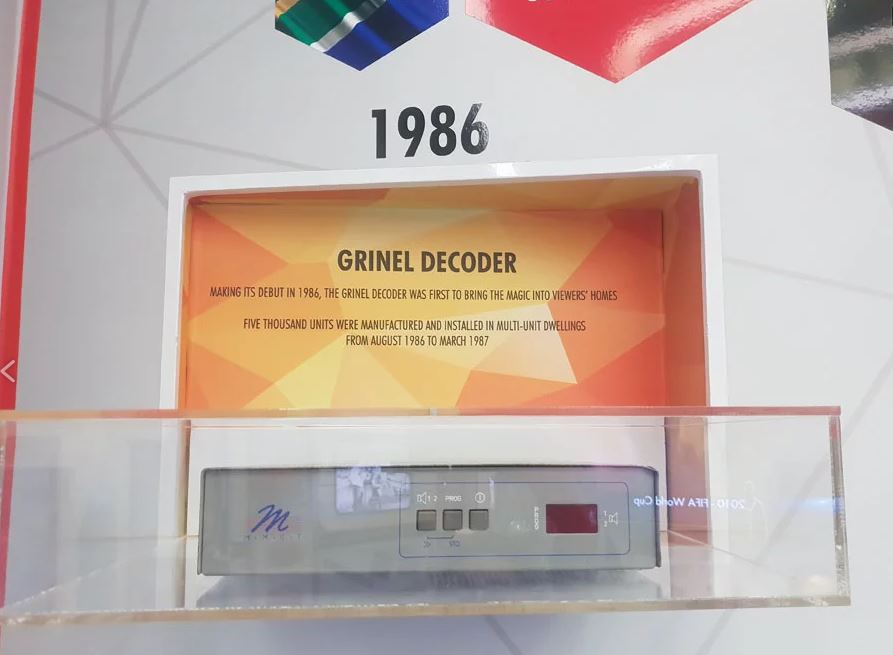
The Grinel Decoder. The first MNET decoder. These were not sold to the public. Only 5000 were made.
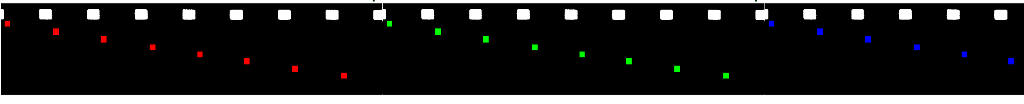
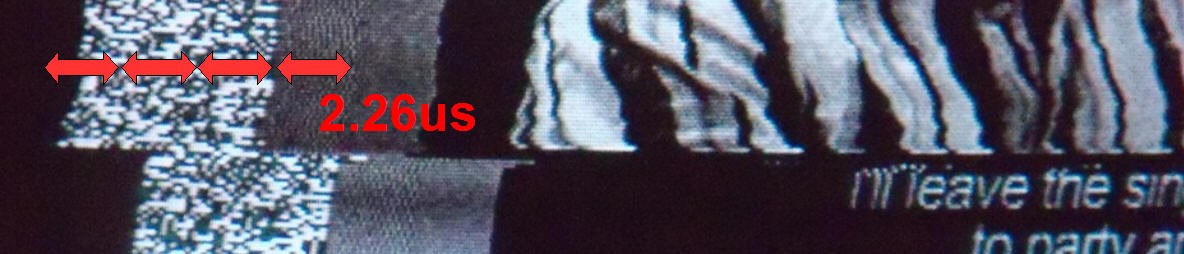
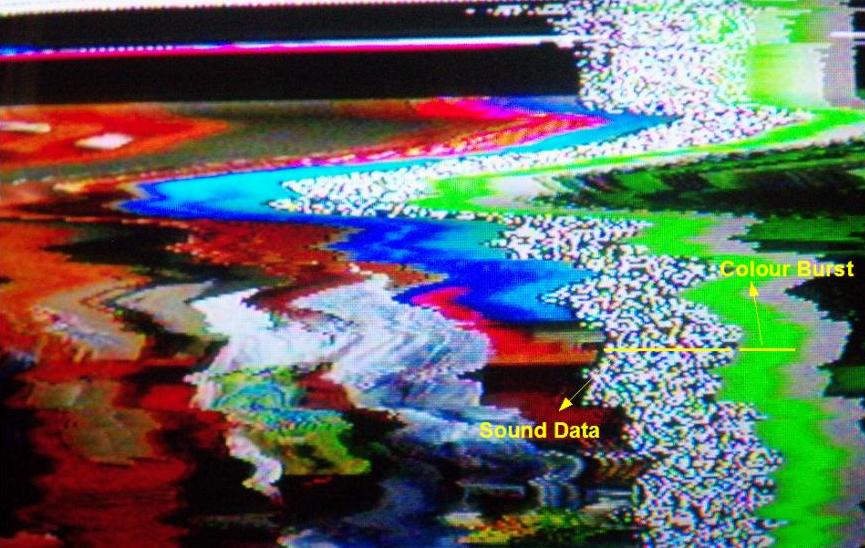
Scrambled MNET above and below showing the digital sound data (snowy dots) and colour burst (green), followed by a grey porch.
Notice how the portion before the image starts is grey instead of black. This is indicative of the sync pulse having been raised in accordance with SSAVI scrambling. Also, the sound data appears to go right up into peak white and down to, or below, black level. The sound data also seem to occupy the entire space normally occupied by the front-porch and the sync pulse, right up to the colour burst. See below how the image edge is right up next to the snowy bar? The green bar (colour burst) is also right up next to the snowy bar. The grey bar can be used as a reference as to where black level is supposed to be. Finally, judging by eye from my video on Youtube it would appear that the audio data essentially just "keeps going", extending right through the the VBI!
The above photograph was taken during a very brief period where colour was actually displayed. The image tears horizontally and rolls vertically. The image also alternately switches between positive and negative. The vertical blanking interval would contain data that'll allow a microprocessor in the decoder to track the positive/negative video switches. The normal FM sound carrier that the TV tunes to sometimes have a radio station on it (Radio 702). When I was taking these photos there was just a steady tone.
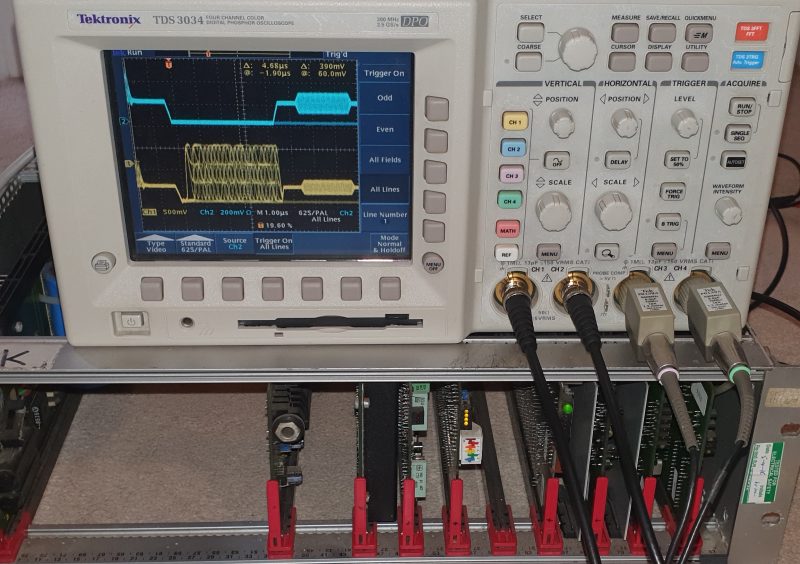
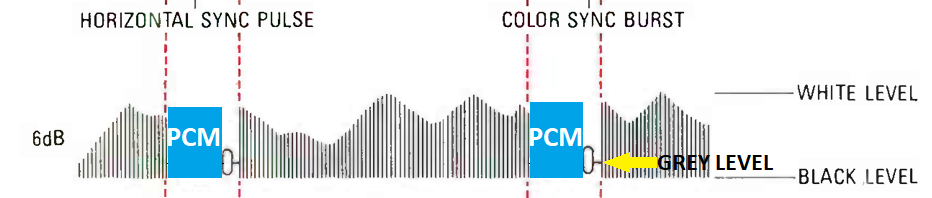
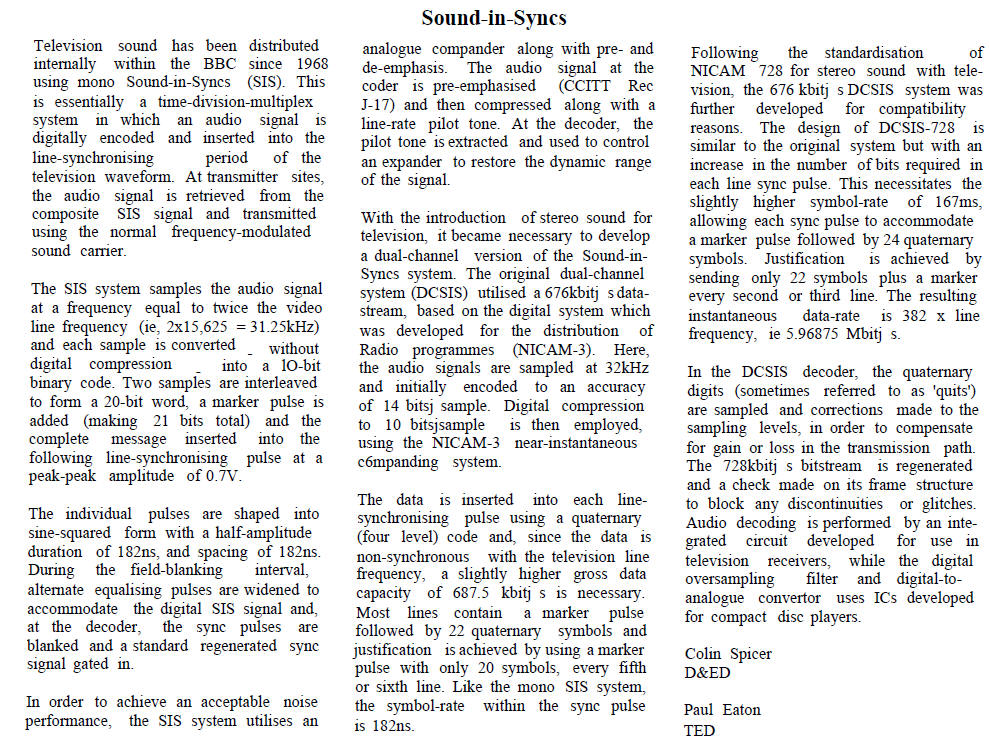
Oscilloscope trace, 2022 Matthew Millman The digital sound system used by MNET is called sound-in-syncs and was invented by the BBC in the 1960s. The above photograph shows what digital sound data in the sync area looks like (yellow trace). Below is a picture from a 1968 BBC document describing the sound-in-syncs system. The BBC needed an easy way to embed audio into the actual video signal in order to simplify signal distribution. They determined that PCM audio data could be inserted in the gap where the sync pulse would be. Diagram (a) below shows a normal PAL video signal with its colour burst and sync pulse. Below (a) is a proposed alternative (b) that would allow more digital data to be inserted. Option (b) was not recommended due to the difficulty of moving the colour burst back to its proper location without upsetting the delicate colour phase relationships.
My guess as to what the MNET signal looked like based on my observations. According to the BBC, sound for the sound-in-sync system is sampled at 31.25kHz which is twice the line scan frequency. This means that according to Nyquist the MNET audio bandwidth is 15.625kHz. While the frequency response is very good the signal-to-quantizing noise ratio is not that great. The BBC proposed a 10bit PCM system with appropriate companding to improve the situation. Here is a 1971 BBC document further describing sound-in-syncs. From its' inception MNET provided two audio channels to viewers. This provided a "clean" and regular sound option for movies. With the introduction of the Delta 9000+ decoder, it became possible to combine the separate MONO channels for stereo sound. At a sampling rate of 31.25kHz for two audio channels, four 10bit PCM samples will be generated for every video line. This means at least 40 bits must fit into 5.6us, giving only 140ns/bit! A better explanation can be found in this 1991 BBC document explaining stereo (or dual-channel) sound-in-syncs. I do not know how closely MNETs sound-in-sync system follows the BBC dual-channel sound-in-sync (DCSIS) system described below. I do know that in 1986 this was hi-tech cutting edge sound technology. Further investigation has revealed that apparently the sound data burst is 36 bits long (confirmed visually). Also, the audio data appears to be 8 bit PCM.The sound is also scrambled. That's why it looks like random noise. Appropriate pre/de-emphasis should be able to cope with the quantization noise of an 8 bit PCM system. Also it would seem that the sampling frequency is ~22.5kHz which, according to Nyquist, gives an audio bandwidth of ~10kHz. This would be in line with the bandwidth of conventional FM analog TV sound. 22.05kHz would make perfect sense actually. 44.1kHz is exactly related to PAL video timing (think PCM Adapter) and 22.05kHz = (44.1) / 2 kHz At a sampling rate of 22.05 kHz using 8 bits and two channels, a data rate of 352800 bits/s results.
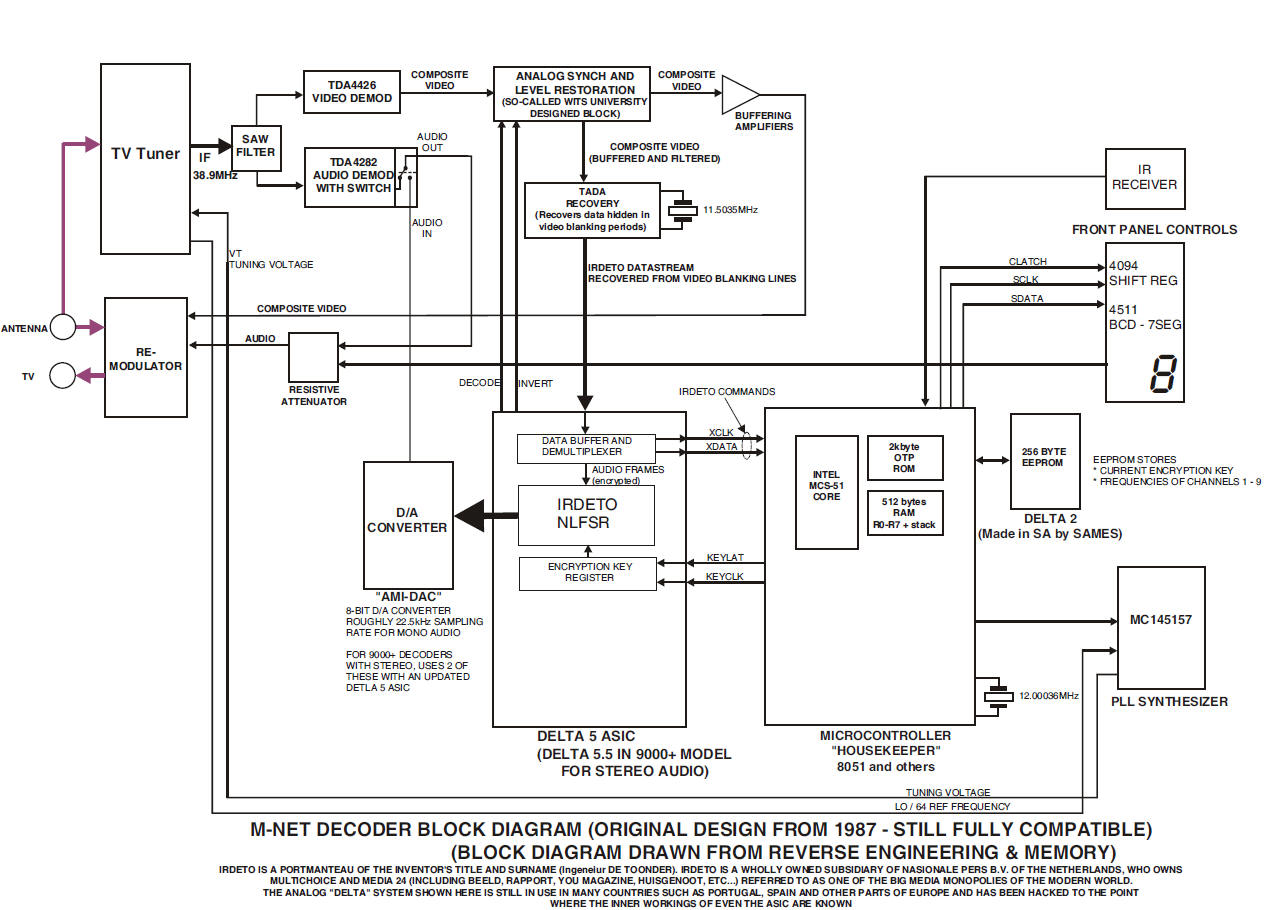
Below is a block diagram of the Delta MNET decoder.
9 April 2010 I've been experimenting using the combination of NBSC Player and NBSC Recorder. My goal is to make it easier to record narrow-band video onto audio tape by reducing the effects of AC coupling from tape to sound card. Narrow band video contains a DC component that cannot be recorded onto tape. Unfortunately this DC component is needed for stable playback and correct detection of sync pulses. My goal is to use some sort of white/black level restoration by artificially adding a white or black reference to the video. To that end I recommend you use NBSC recorder as follows:
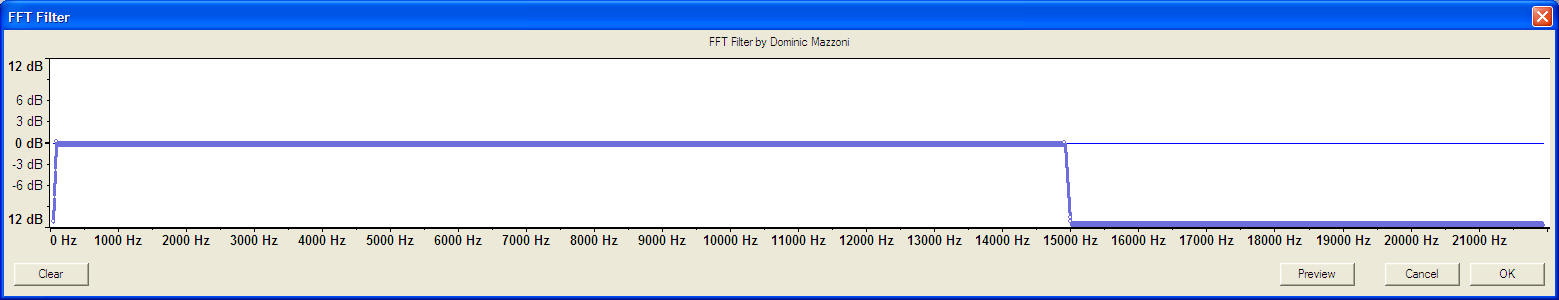
When you use the record window, position the AVI playback window on a white background. Position NBSC recorders' window such that a portion of the white background appears in the recording window on the right. This will record a peak white reference in your video WAV file. Using Audacity FFT function to remove the DC component and limit the upper frequencies to 15kHz (simulated tape playback) in the resulting wav file, I managed to get stable playback. The peak white section appears to have the effect of reducing the DC component in the video. It may be able to use methods similar to normal TV black level restoration to further process the video from the tape and restore proper white level. I still need to try with actual tape playback.
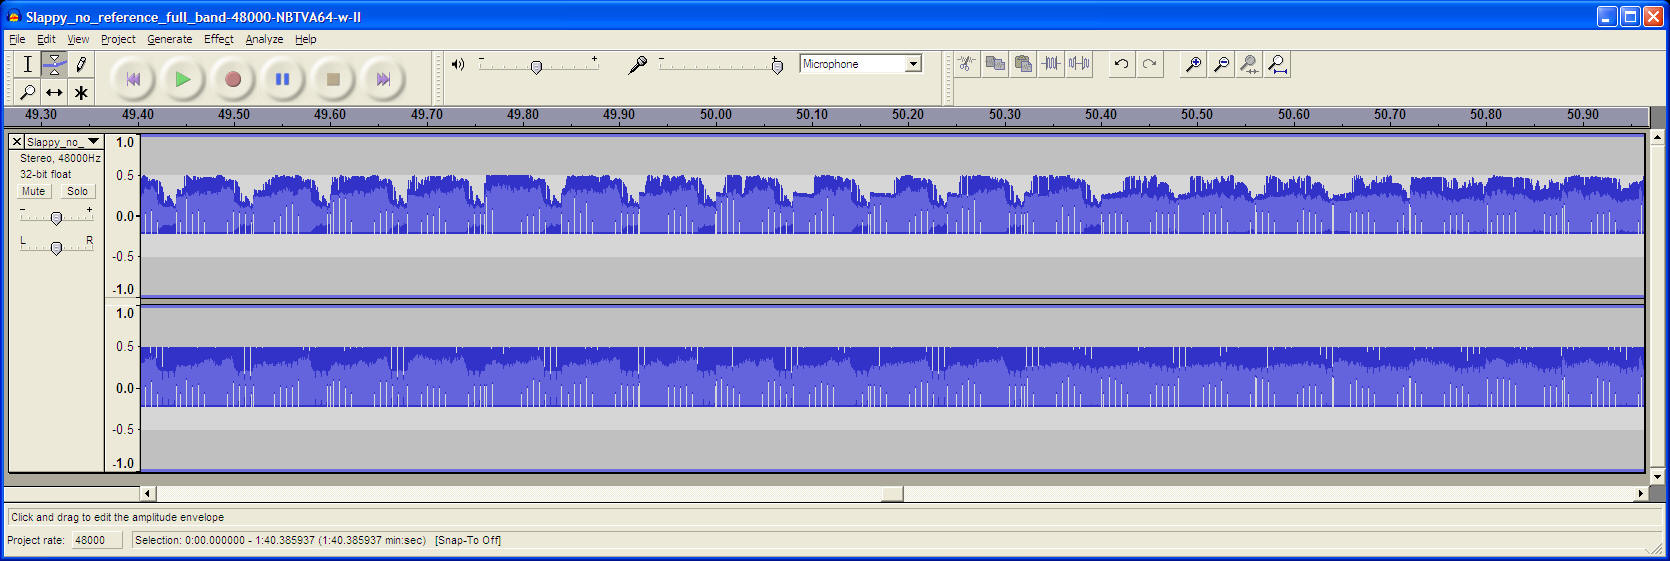
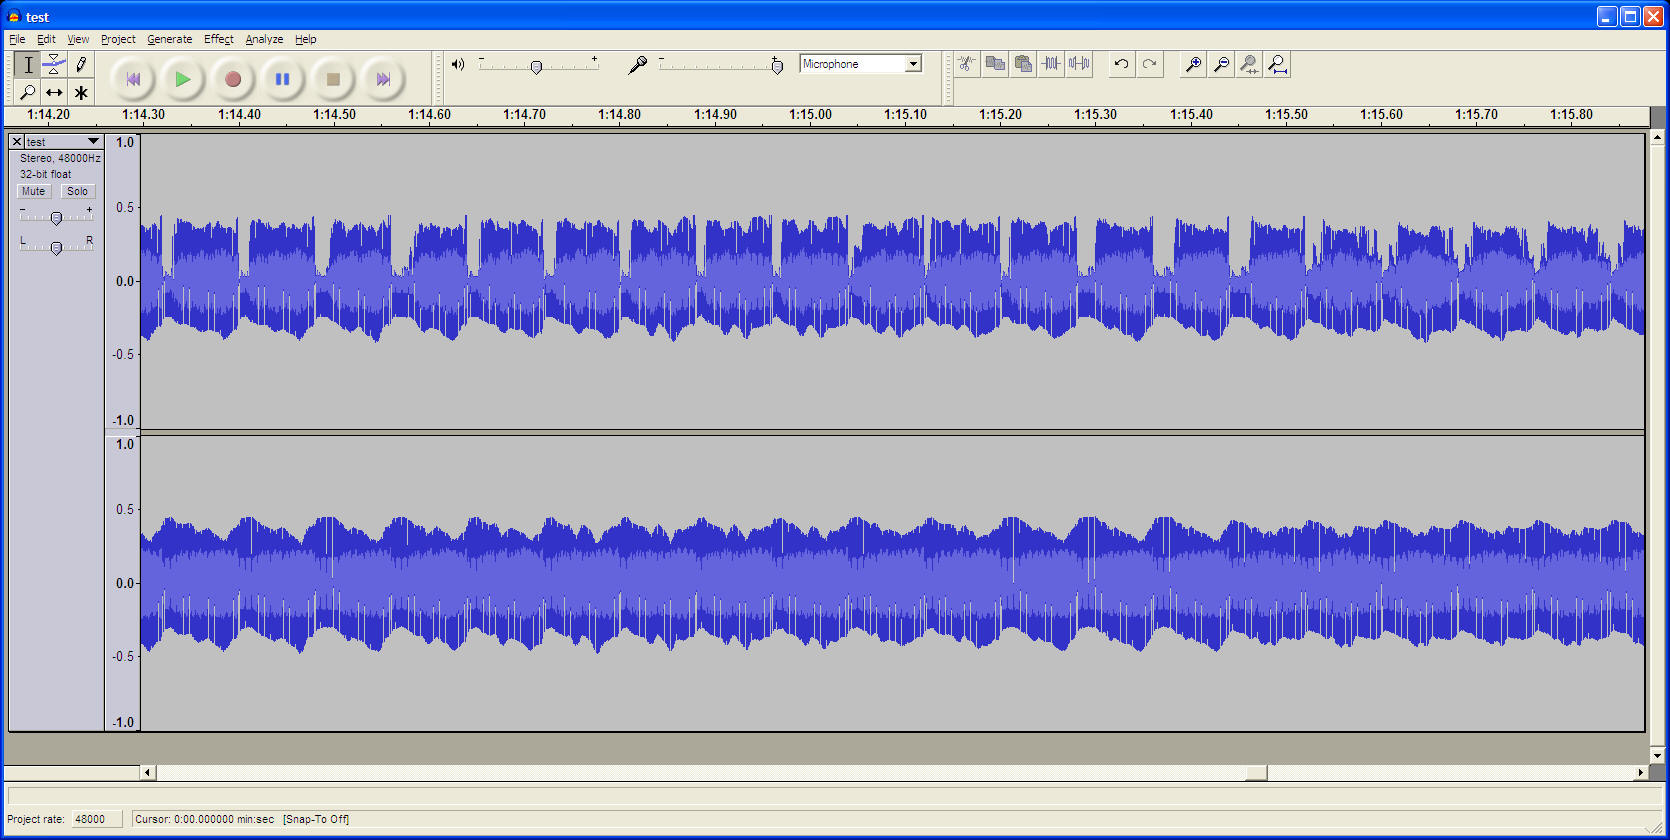
The above view in Audacity shows the 64 line video signal without a peak white reference at the top, and with peak white reference at the bottom. Notice how the video waveform with peak white reference (bottom) is more symmetrical around zero than the video signal without peak white reference. (top).
The above view in Audacity shows the results of lowpass filtering below 15kHz and removing the DC component. The envelope of the video signal is more symmetrical (below) than at the top.
The filter response
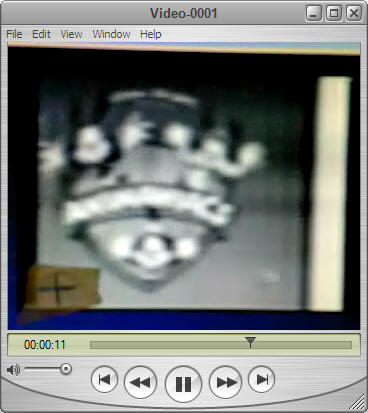
64 lines, DC removed, lowpass filtered WAV with cutoff at 15kHz Notice the peak white reference on the rigth. (click to view)
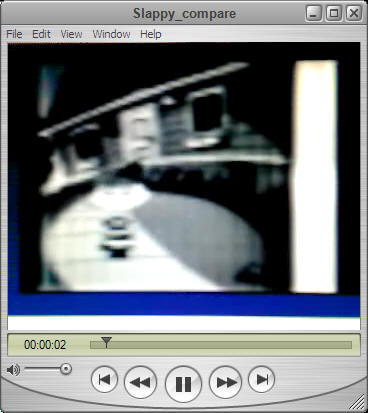
64 lines, DC removed, lowpass filtered WAV with cutoff at 15kHz Compare with and without white reference. No major difference when played back from WAV, but the one with white reference will be easier to post-process to restore a set level upon playback when using tape.
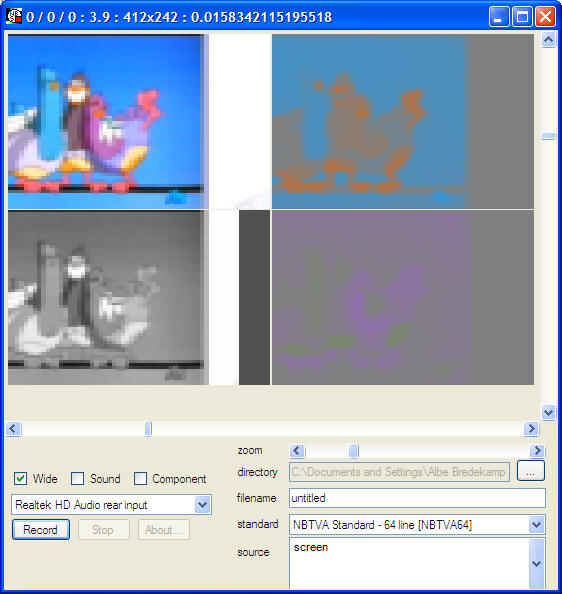
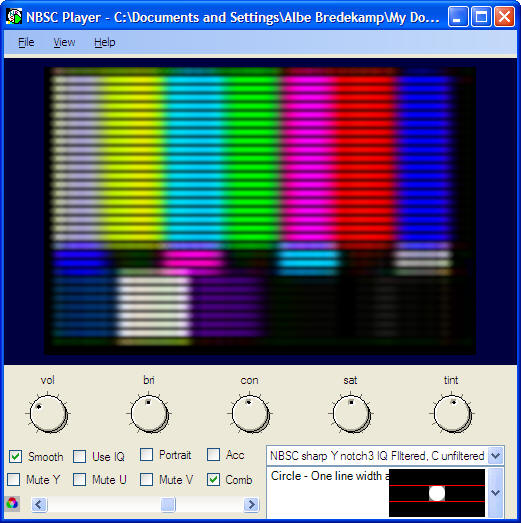
23 August 2009 I found some awesome new NBTV software here. NBSC Player and Recorder has been written with great care and are packed with features. It supports all major NBTV formats and even supports colour.
1 May 2009 Analysis of VinylVideo VinylVideo is a novel video storage and playback system using 33rpm vinyl records. Its' mostly used by artists to produce records for exhibition at galleries where the VinylVideo playback system is found. I decided I'll analyze the signals from their recording system to see how they work.
Here's the original image I found on their website.
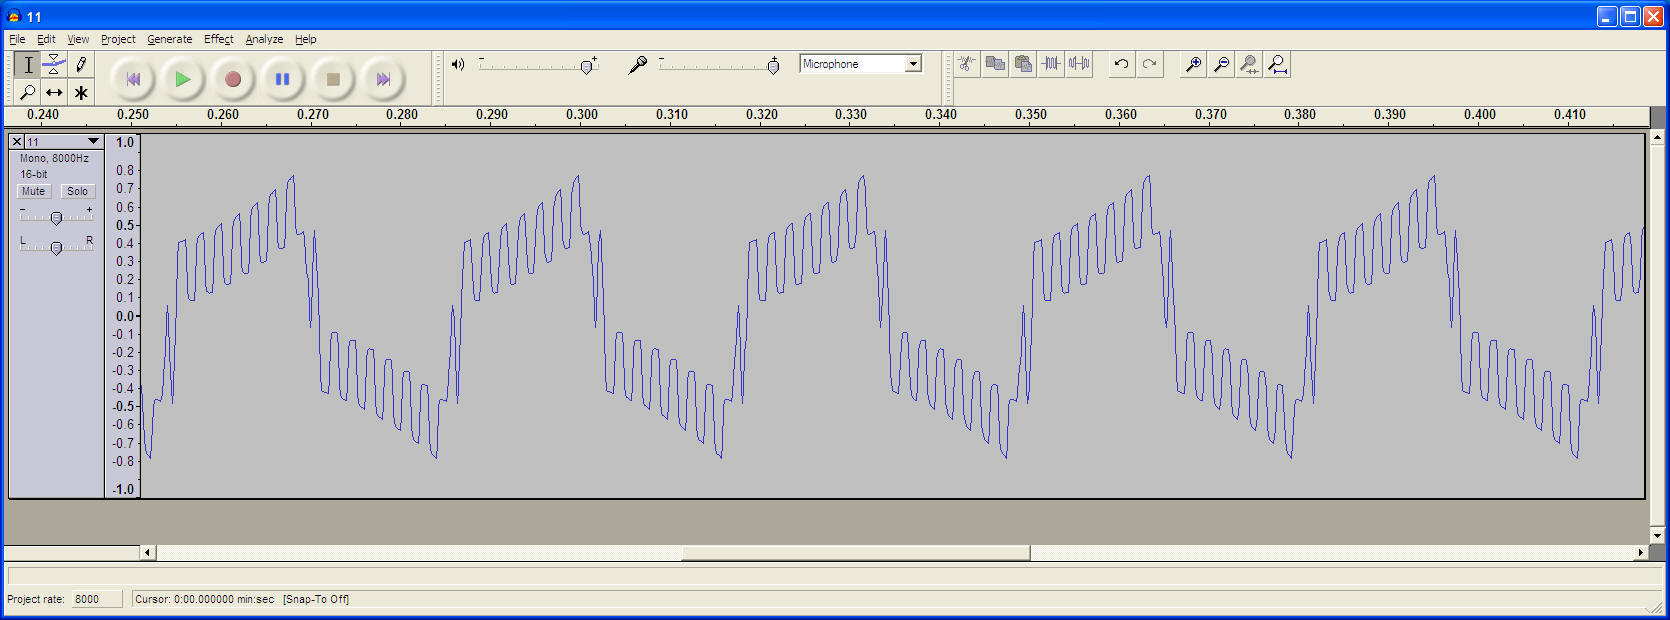
I pulled the original sound file corresponding to the image into Audacity:
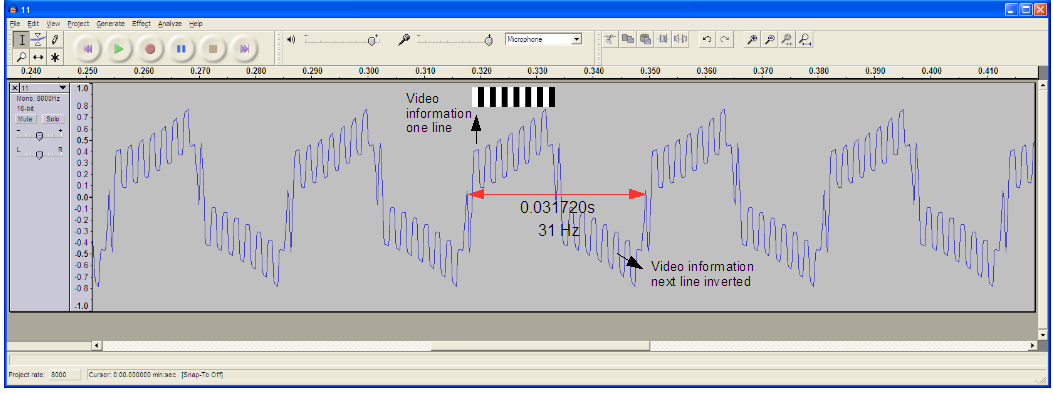
The signal has a pattern that repeats at a rate of about 30Hz. Superimposed onto this 30Hz signal is the video signal which appears to be inverted for every other line. This is done to make the signal more symmetrical and reduce DC offset. Since two lines are scanned in 0.031720s, that makes the line scan rate about 60Hz. The base 30Hz signal when full-wave rectified and low-pass filtered to remove video information can be used as the line scan waveform. Notice how the video is superimposed on a ramping voltage similar to a line scan sawtooth.
Example with higher resolution image.
29 November 2008 I thought I would try to back up a file to audio tape using software that converts normal digital files to OFDM modulated tones suitable for transmission over HAM radio. The software is called RDFT and WAV2BIN. You can also use DIGTRX. Here's what I do:
Using this method I manage to record 2 x 42KB files, one per channel in 6:40. That's 84KB in just under 7 minutes. One C90 tape should hold just over 1MB!
28 November 2008 The Sony deck is erasing recordings properly again! I didn't do anything though!?! Dry joint? Turns out it only likes making recordings going in one direction. It's an auto reverse deck and the head swings around depending on which way the tape is going. I wonder how the connection between the deck and the moving head is done? Made some tests.
Sony TC-FX510R Frequency Response, TDK Normal Position Type 1
Yamaha KX-150 Frequency Response, TDK Normal Position Type 1
Conclusion: Pretty much the same.
I did some research. Turns out I shouldn't be recording my white noise signal onto the tape at full blast, but at a lower level. Frequency response is measured using a signal at -20dB. I tried to record lower than usual and got this response:
Looks good. Pretty flat right up to 15kHz using TDK Normal Position tape. This is what my ears have been telling me, but I'm a man of science. I want to see the numbers!
Same procedure, Philips Chrome tape
Philips chrome tape, white noise recorded at 0dB. More pronounced high frequency roll-off.
Compensating for high frequency roll-off of cassette tape
no pre-emphasis, TDK Normal Bias
with pre-emphasis, TDK Normal Bias, compare roll-off at 14 and 16 KHz, some improvement
pre-emphasis setting, high frequencies boosted before recording
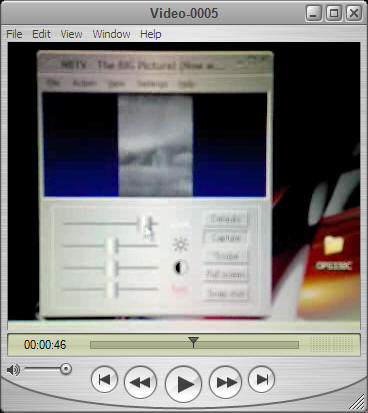
This is 32 line video being played back from ordinary audio cassette using my Yamaha KX-150 deck and TDK Normal Position Type 1 tape at standard speed.
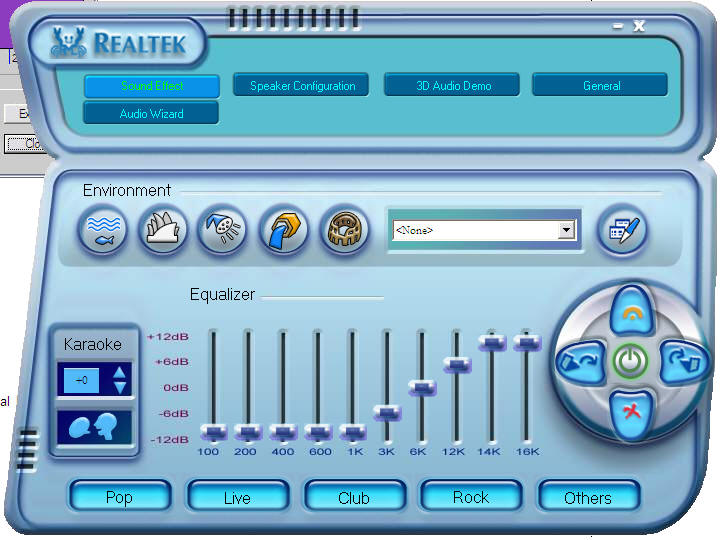
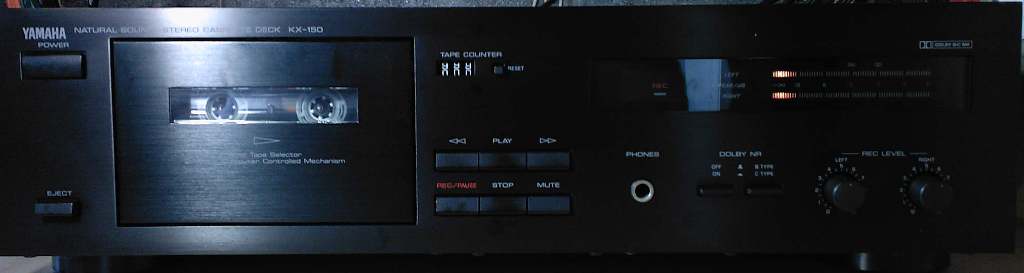
Used Yamaha KX-150 I purchased to replace the faulty Sony. I was curious about the tapes' frequency response, so I made some measurements. See below.
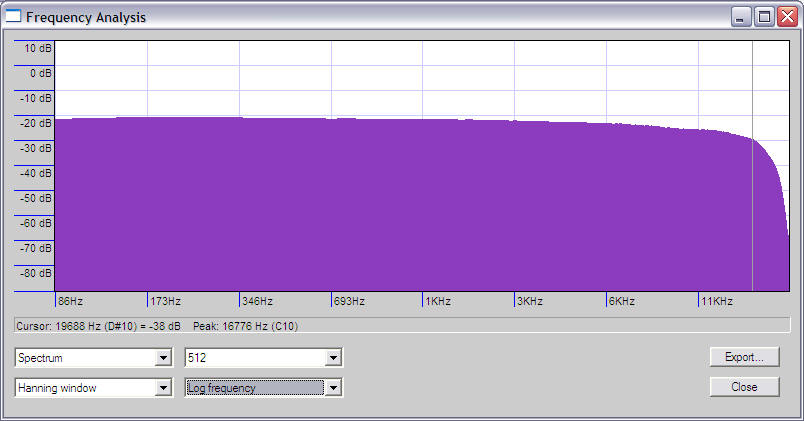
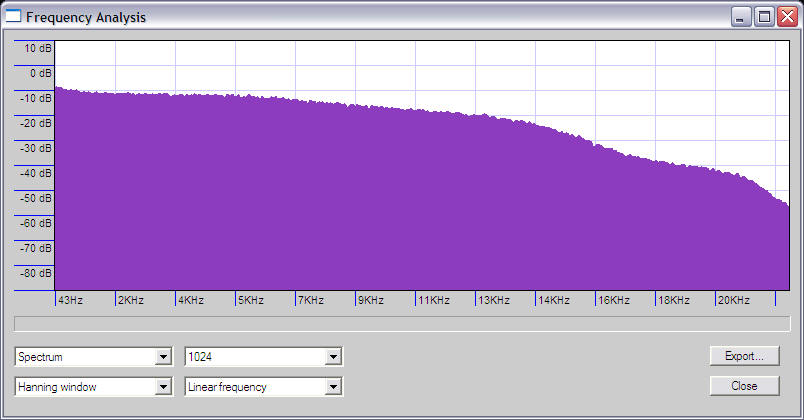
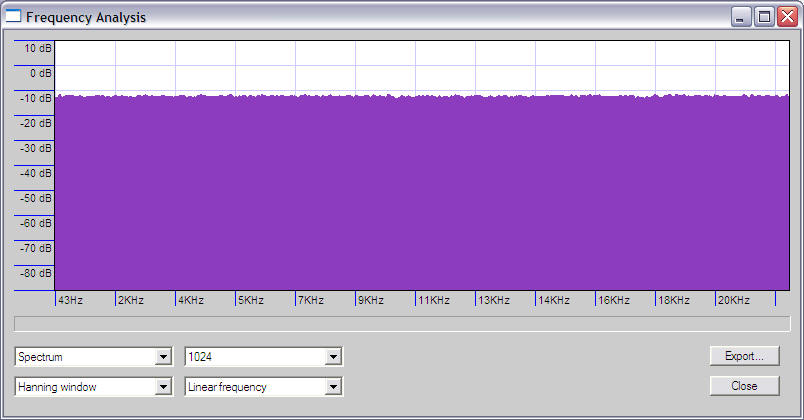
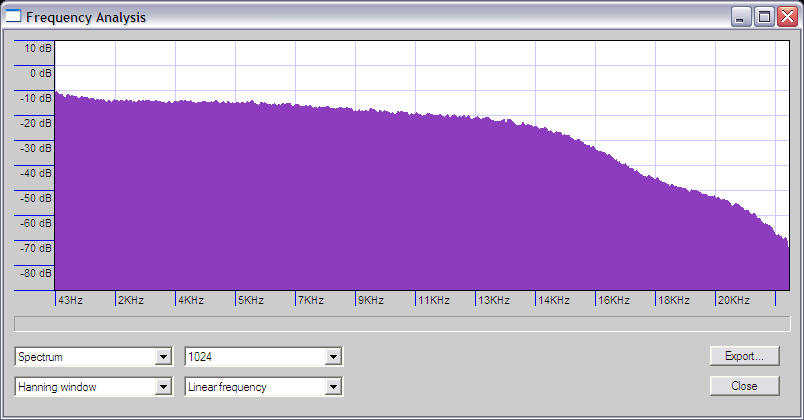
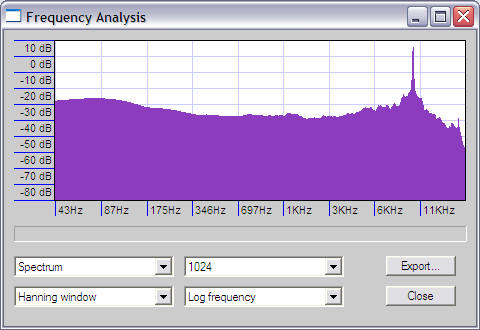
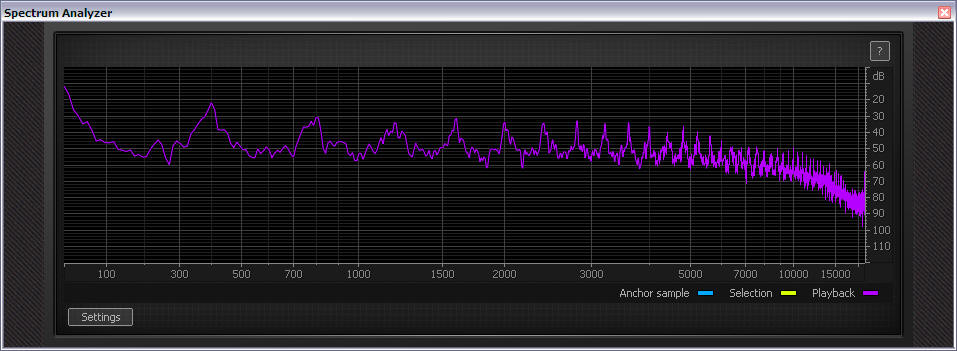
I first created some white noise in Audacity and exported it to a wav. Spectrum of original white noise wav file (above)
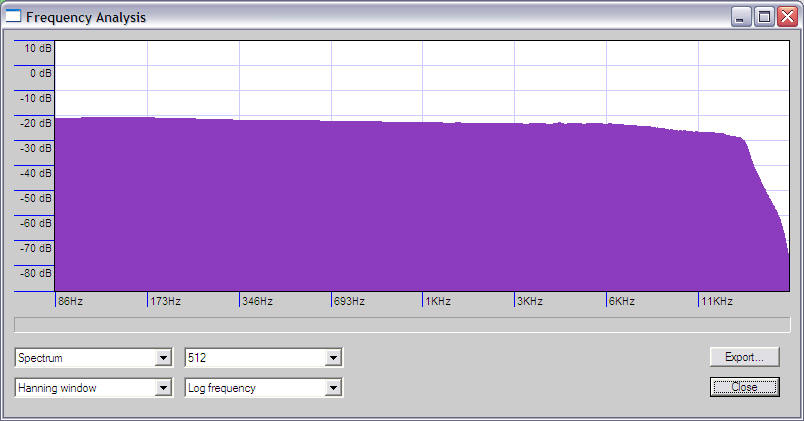
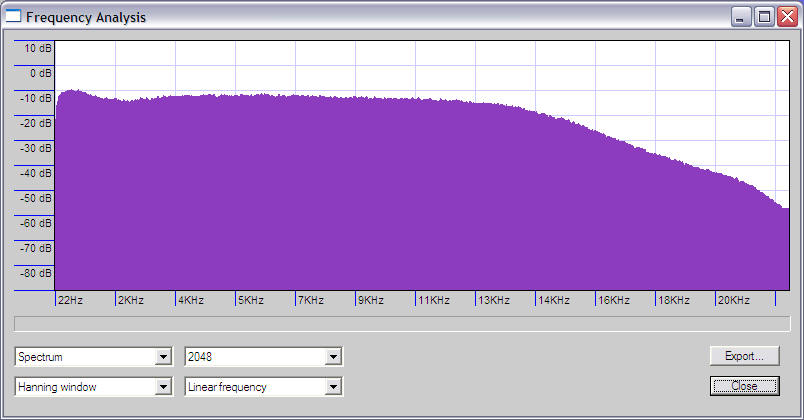
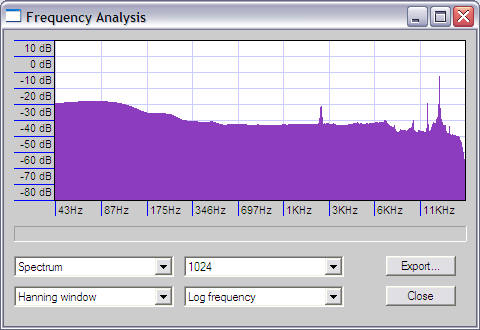
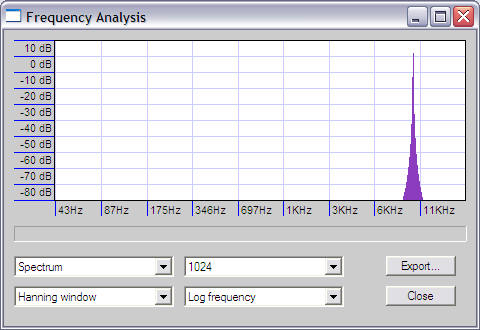
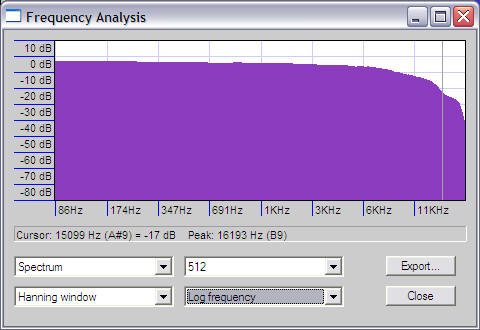
Spectrum of resulting recording after white noise was fed directly from speaker out into mic in and recorded.
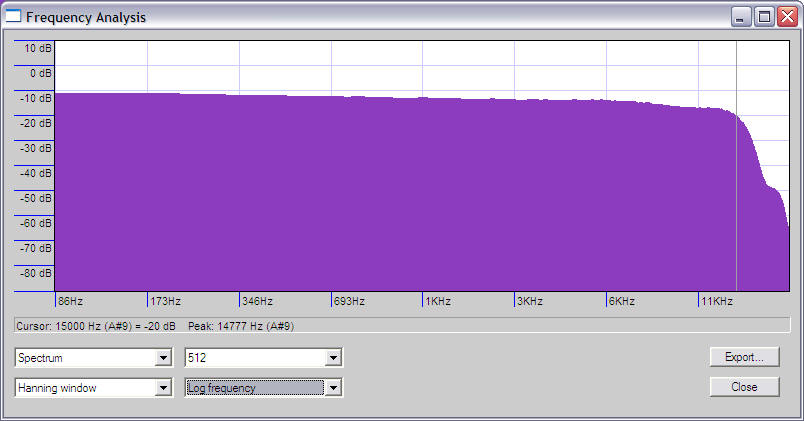
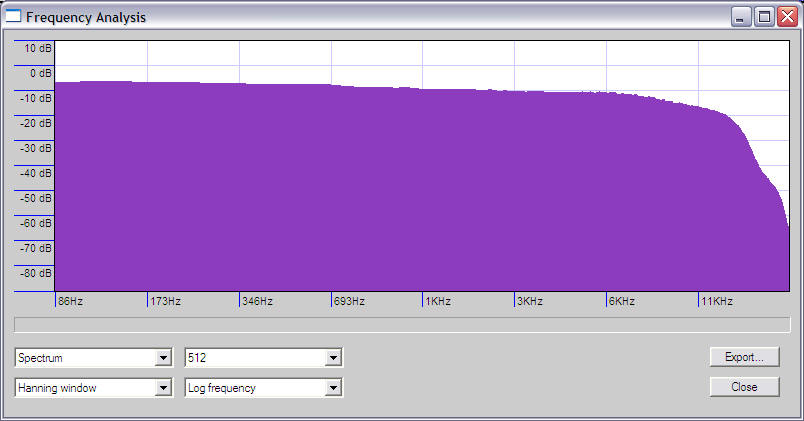
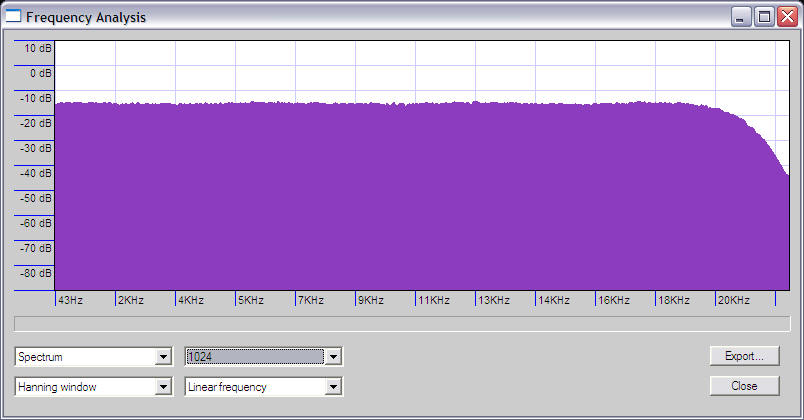
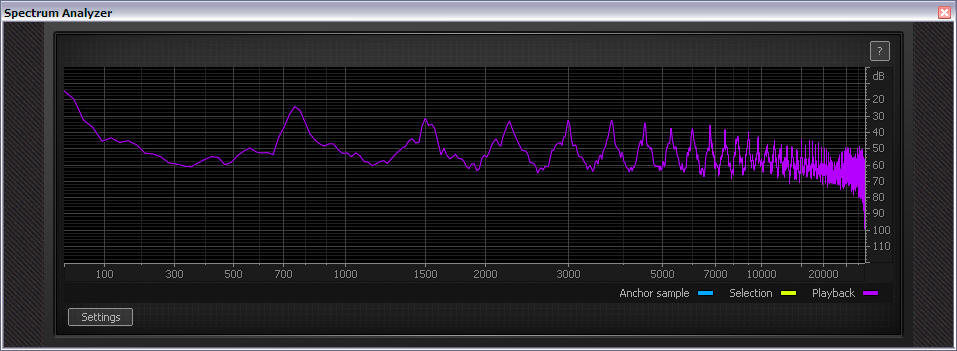
Spectrum of resulting recording after white noise was fed from my sound card speaker out and recorded by my Yamaha KX-150 onto Philips chrome tape. The resulting tape recording was then played into the mic input and digitally recorded.
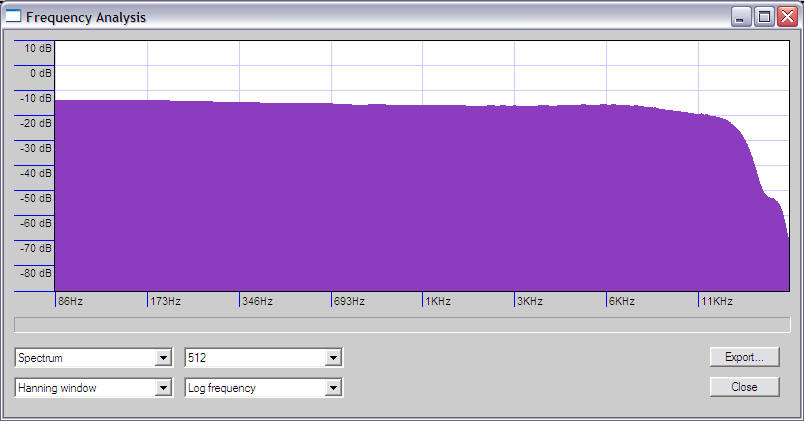
Spectrum of resulting recording after white noise was fed from my sound card speaker out and recorded by my Yamaha KX-150 onto TDK iron oxide tape. The resulting tape recording was then played into the mic input and digitally recorded.
TDK Normal Position tape used
22 November 2008 My Sony tape deck has developed a fault. It's not erasing the old recording. Sigh...This puts an end to my testing. For now.
21 November 2008 The usable bandwidth on a typical audio cassette is about 15kHz. The bandwidth of a NBTV signal at 32 lines is about 10kHz. It may be possible to amplitude modulate the video signal onto a carrier, but this will produce a total bandwidth of 20kHz which may be too much for audio tape to handle. If we modulate a carrier at 10kHz with the video signal we may end up with something like this:
The yellow line represent the response of the audio cassette. A portion of the upper side band is lost. This might be OK as the resulting signal is then essentially vestigial sideband AM. Using this method, the DC information of the video signal (sync pulses, black level) can be preserved solving the problems explained below. Using post-processing of the tape signal it may be possible to re-create the full USB.
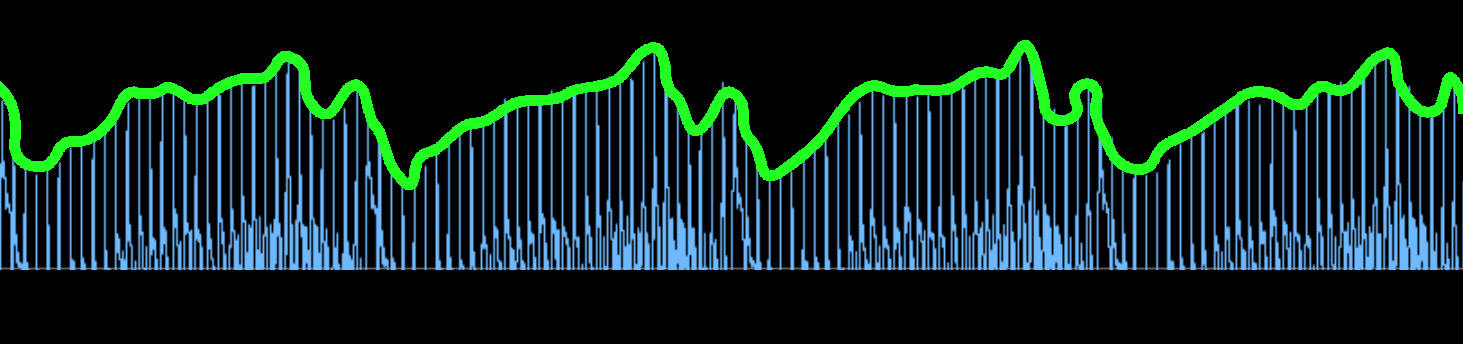
20 November 2008 It occurred to me that the sync tip amplitude level fluctuations is just a type of amplitude modulation (AM) caused by variations in scene brightness. In the picture below the signal from the tape is inverted to have sync tips at the top. Using an AM detector circuit, the negative half cycle is removed with a diode. A capacitor is then used to create the green signal from the envelope of the sync tips. The green signal can then be used as a correction signal to restore the sync tips back to a set level.
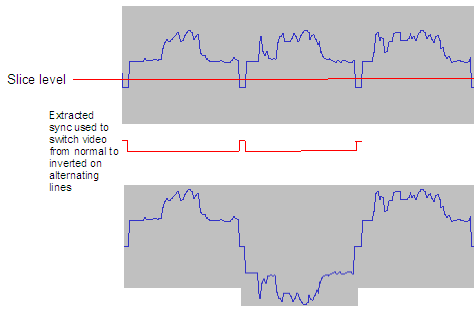
UPDATE: 3 May 2009 I devised a method to allow recording of 30/60 line TV on tape. The problem is varying DC offset in the signal played back from tape. The solution is to make the signal to be recorded more symmetrical ie remove as much of the DC component as possible so that AC coupling won't be a problem anymore. In the diagram below, a 60 line video signal is shown. The video is sliced at a level that'll allow removal of the sync. This sync can be used to invert the video signal on alternating lines, creating a more symmetrical signal (next picture in diagram). The now more symmetrical signal is then recorded to tape. Full-wave rectification of the signal upon playback should "flip" the inverted video portion back up again. This method is similar to the method used by VinylVideo. The circuit should be simple.
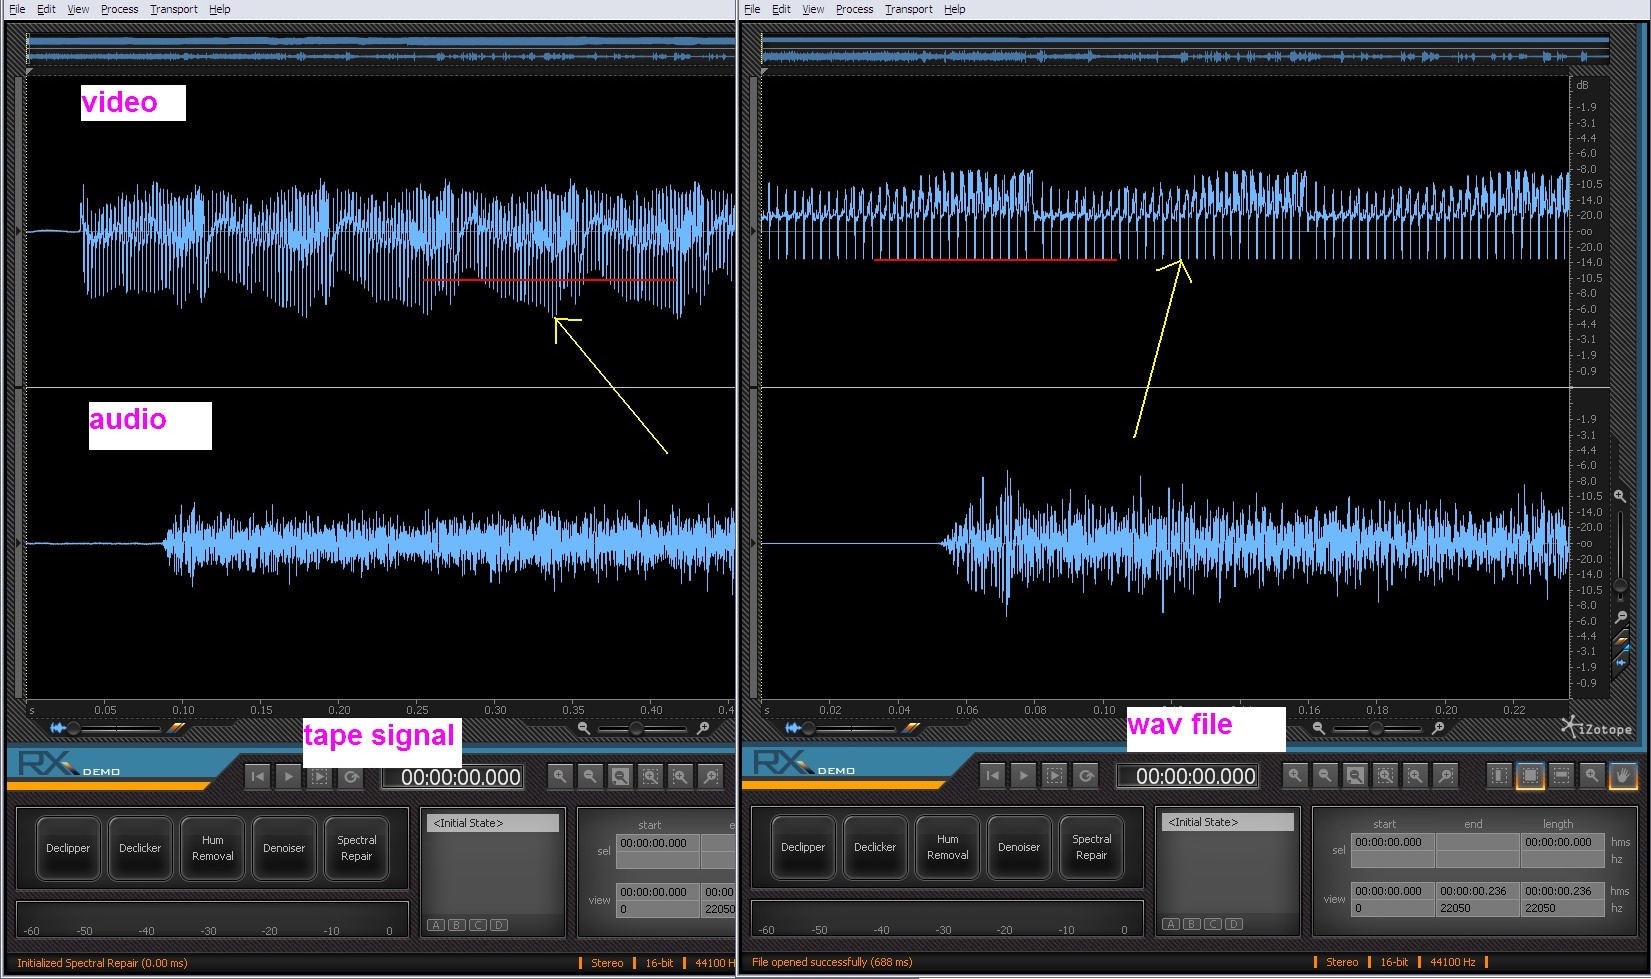
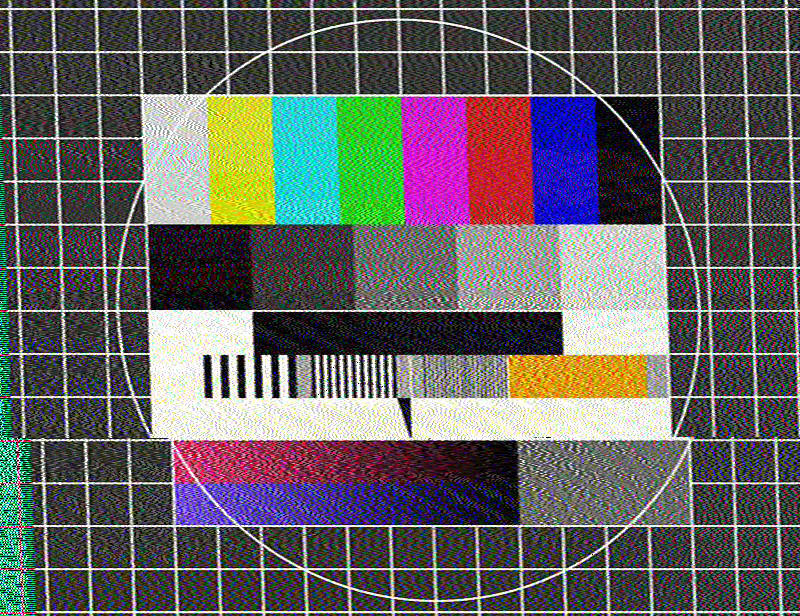
19 November 2008 Why you cannot record 32 line TV onto audio tape, and expect great results. I made some experiments to see if I can record 32 line TV onto audio cassette and play it back. The results were disappointing. It was near impossible to get a stable picture. On closer inspection I found the reason:
click for larger version In the above diagram, the 32 line signal from the tape (left) is compared to the original wav file on the right. On closer inspection you'll see that the sync tips (yellow arrows) of the tape recorded video is no longer at a set level, but varies all over the place. The result is that there is no fixed trigger level for initiating line scanning anymore. I'm using a SONY TC-FX510R HI-FI Stereo tape deck. This problem is caused by AC coupling of the signal. Variations in scene brightness will change the average level of the signal and vary the level of the sync tips too. For proper playback, the sync tips must be restored back to their proper level. Similar problems exists in regular PAL/NTSC TV also necessitating DC restoration and sync tip clamping of the video signal. 32 Line TV should not be shunned as old, inferior or obsolete. It is still a useful teaching and learning tool when it comes to signal processing and its' use should be encouraged in tertiary environments.
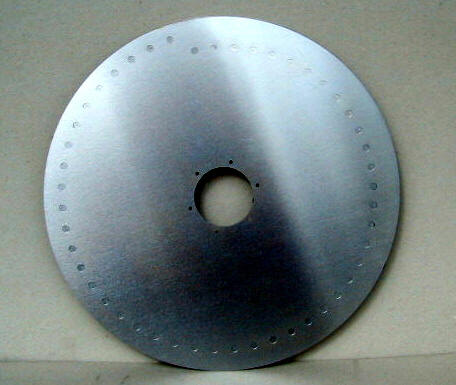
Different methods of scanning mechanical television exists. The most popular is the the Nipkow disc, but other methods such as the mirror drum also exist. I'm not a huge fan of the Nipkow disc. It's beautiful in its' simplicity, but it produces arced scan lines as opposed to straight lines. The disc also need to be quite large to get enough scan lines. One can also use a mirror drum. The mirror drum produces straight scan lines, but needs to be precision built for best results. The forces on the mirrors during operation is also considerable. Another unusual scanner is the mirror screw.
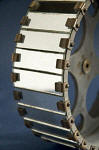
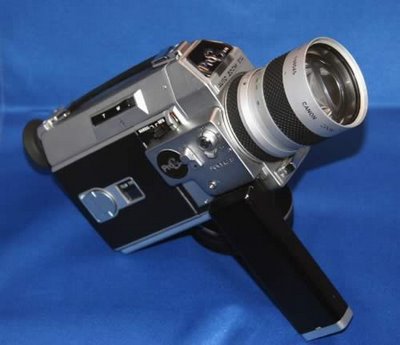
Left to right, a Nipkow Disc, mirror drum and screw scanner I would like to propose that it may be possible to convert a movie camera into a mechanically scanned TV camera using what I like to call film-strip scanning. Consider Super 8mm film, using photographic means one can place small clear dots onto an otherwise black film. If this film strip is pulled through the camera rapidly, mechanical scanning should result. This is the closest reference I could find to something vaguely similar.
A section of 8mm film with clear scanning dots. The possibility exist now to convert any 8mm, 16mm or even 35mm film camera into a mechanically scanned TV camera provided one load it with the appropriate scanning film and provide the camera with a light sensor. The camera won't need a shutter and you have the advantage of high quality optics. Experimentation would determine if it would be necessary to disable the camera shutter. The film transport/gate might also need tweaking for high speed operation. Fortunately the film does not need to be stopped for exposure, but can simply run continuously at high speed.
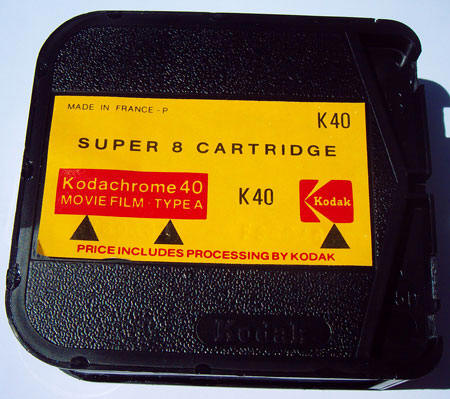
I foresee the following limitations: The frame rate is limited only by the speed at which the scanning film can be pulled through the camera. The number of lines is limited by the resolution of the film (dot size) and the sensitivity of the light sensor. If film in a closed loop is used in the camera, the number of lines would also be limited by how much film one can fit into the camera. As a rule of thumb, one film frame is needed per line. So if you want to scan 100 lines, you would need a scan film length equivalent to 100 film frames. Also keep in mind though that if you were to scan 100 lines, then 100 frames worth of film would have to pulled through the camera at least 12.5 times a second for a decent frame rate. All this is theoretical and I would encourage someone to build a working unit. The NBTVA uses a 32 line standard at 12.5 frames/second. Super 8mm has a frame size of 4.22 x 5.63mm. This means one video frame will need film equal to 4.22 x 32 = 135.04mm or 66.6 ips!
Super 8 frame Using regular 8mm film with its' dimensions of 3.68 x 4.88mm, one video frame would require 117.76mm of film.
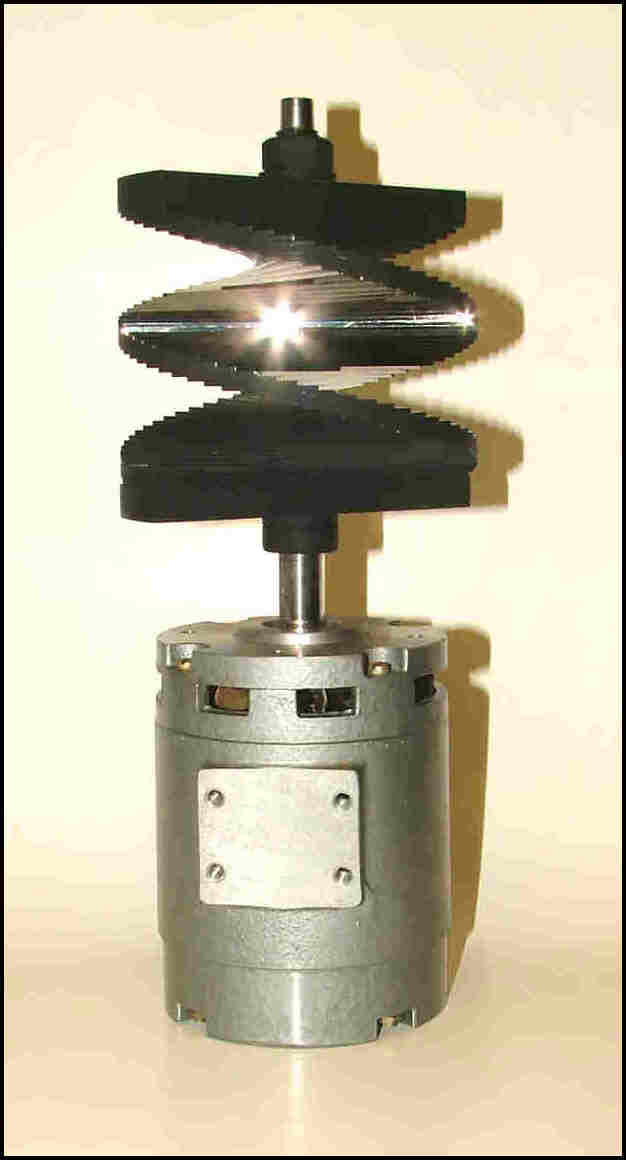
Regular 8mm frame The greatest challenge would be the speed the film has to travel at. I would recommend that the sprocket holes not be used. At these speeds they're likely to tear. Since the frame does not have to stay still during exposure, rubber capstan rollers can be used to drag the film past the film gate. It is conceivable to fit the scan film, light sensor and electronics into the shell of a Super 8mm film cartridge. The scan film can be produced by photographing single frames of black squares on a white background and placing the negative into the camera. There should be no frame borders visible on the negative. Optical markers can be placed onto the film to be picked up by sensors for sync pulse generation. Using color film to make colored scanning dots, it would be possible to realise a frame sequential color scanner.
16 November 2008 I've discovered narrow band television (NBTV). It refers to television with a bandwidth lying in the audio frequency band. This type of television is often displayed using mechanical displays such as the Televisor. The NBTVA have a 32 line video standard with a maximum bandwidth of 10kHz and a frame rate of 12.5 pictures/second. At 32 lines, one video line occupies 2.5ms. Line scan rate is 400Hz. Hobbyists still build mechanical displays for narrow band TV. Another popular system uses 60 lines where one line occupies about 1.33ms for a frame rate of ~12.5. Line scan rate is 750 Hz. Below is a comparison.
In the above video, a Nipkow disk is used to produce a very nice mechanically scanned picture.
Time domain comparison of 32-and 60 line NBTV
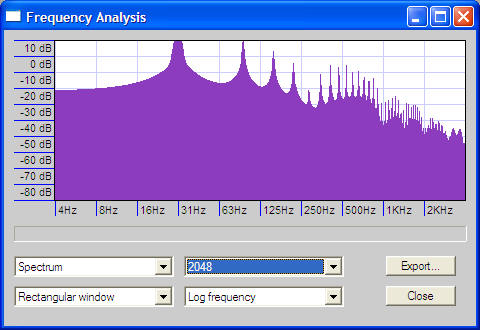
Spectrum view of 32 line NBTV. Notice peak at line scan frequency of 400Hz
Spectrum view of 60 line NBTV. Notice peak at line scan frequency of 750Hz
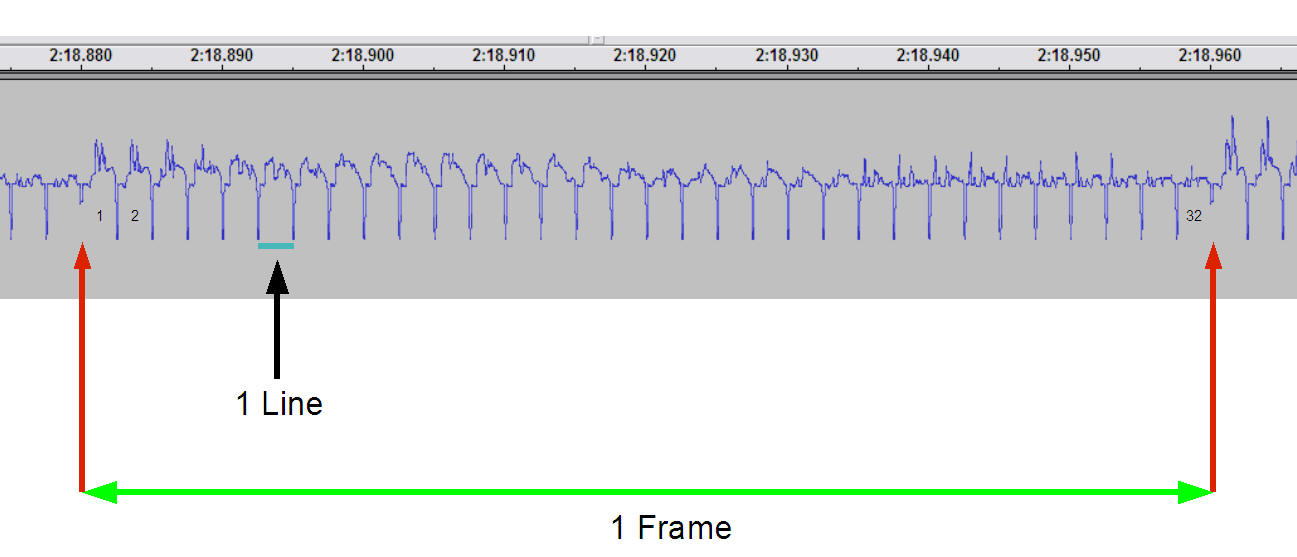
Anatomy of a 32 line video signal (above). Notice how the absence of a sync pulse indicates the start of a new frame. Lines 1,2 and 32 are indicated.
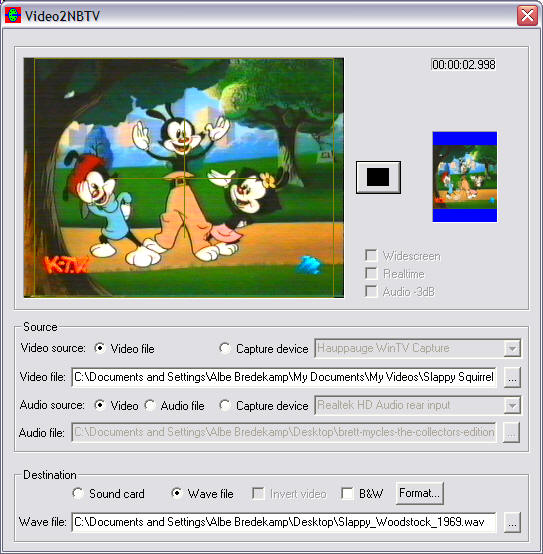
Video2NBTV allows for easy conversion from AVI to NBTV
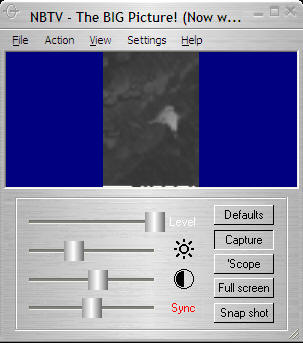
NBTV - The BIG Picture allows for easy viewing of 32 line material.
14 November 2008 The question is: Given a channel bandwidth of 15kHz, what would be the best strategy to fit as many SSTV pictures as possible into a tape playing time of 60 minutes. The SSTV picture is FM modulated and occupies a 3kHz bandwidth. This was done to allow it to fit into a HAM voice channel. Using this encoding method as-is would be wasteful of the available bandwidth on our tape recorder. Time compression using Audacity Using time compression to speed up the wav file, before recording onto tape, is a possible option. Upon playback the captured wav file is played back at half speed for decoding by MMSSTV. This seems to work very well. Instead of a PD290 encoded picture occupying 290s on the tape, it only occupies 145s. Time compression (2x speed playback) appears to have the effect of doubling the carrier frequency and bandwidth.
Frequency Division Multiplexing using Audacity
FDM did not produce the desired result. Perhaps if I had something like MATLAB I could do more. It was still fun though. See results below
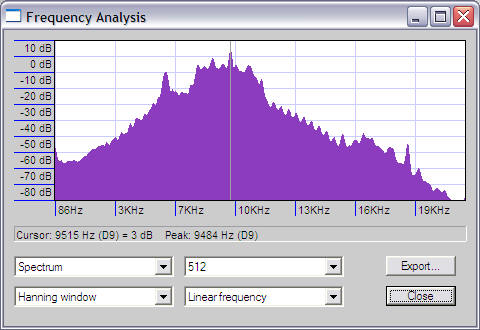
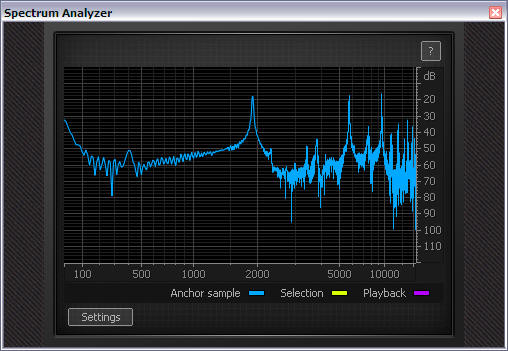
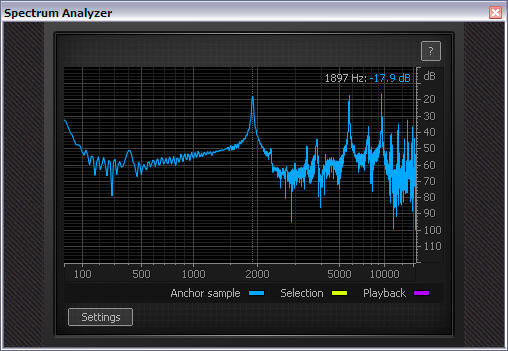
Three FM modulated carriers in a single wav file
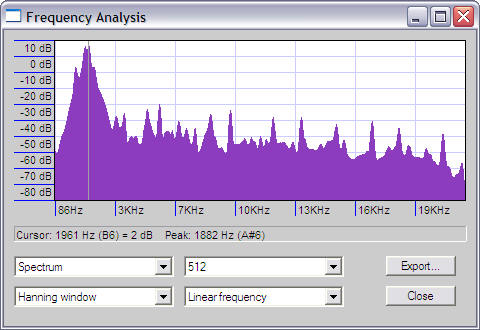
Picture 1 carrier at ~1897Hz
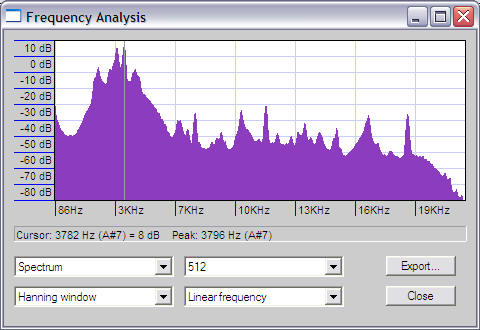
Picture 2 carrier at ~5722Hz
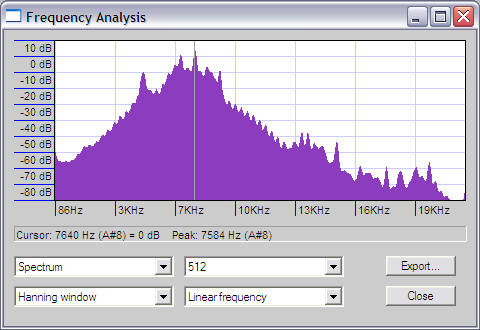
Picture 3 carrier at ~9459Hz
To retrieve the pictures, use the pitch tool in Audacity again to shift the carriers down to the location where MMSSTV expects it, ie 1900Hz. Judging from the pictures below, the results are not perfect, but there is still tweaking to do. Picture 2s' carrier is at 5722Hz and Picture 3s carrier is at 9459Hz. The difference is 3737Hz. There are obviously issues with noise and the wide FM bandwidth. With better software I'd be able to do more.
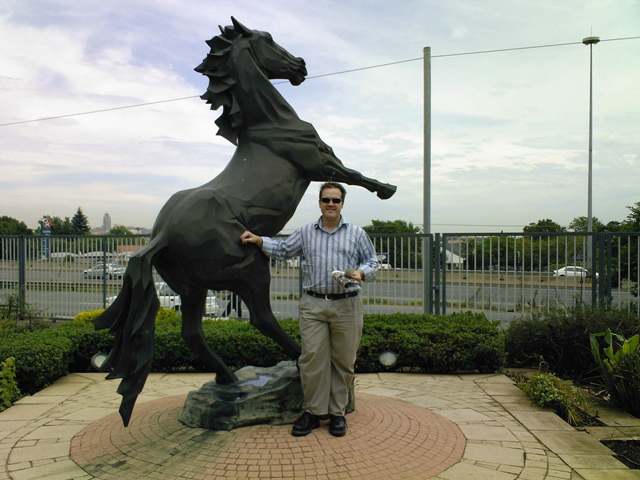
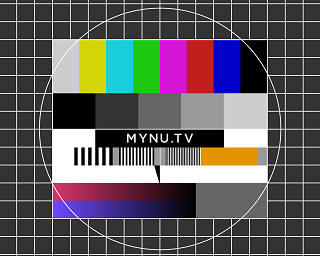
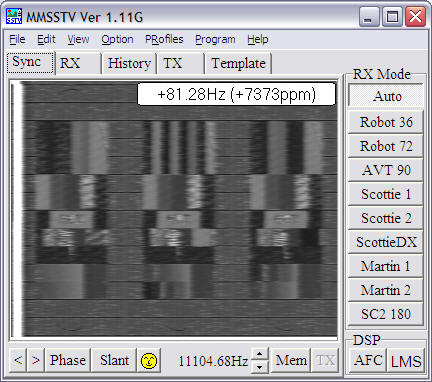
You all know that from time to time I just write about whatever I find interesting. Today I had great fun playing with slow scan television or SSTV. The software I'm using is called MMSSTV. It is normally used by radio hams to transmit pictures with their callsigns. The software produces FM modulated tones with a bandwidth of no more than 3kHz which can fit into a ham voice channel. I simply fed the output to a portable tape recorder. Storing images on audio tape is so delightfully retro.
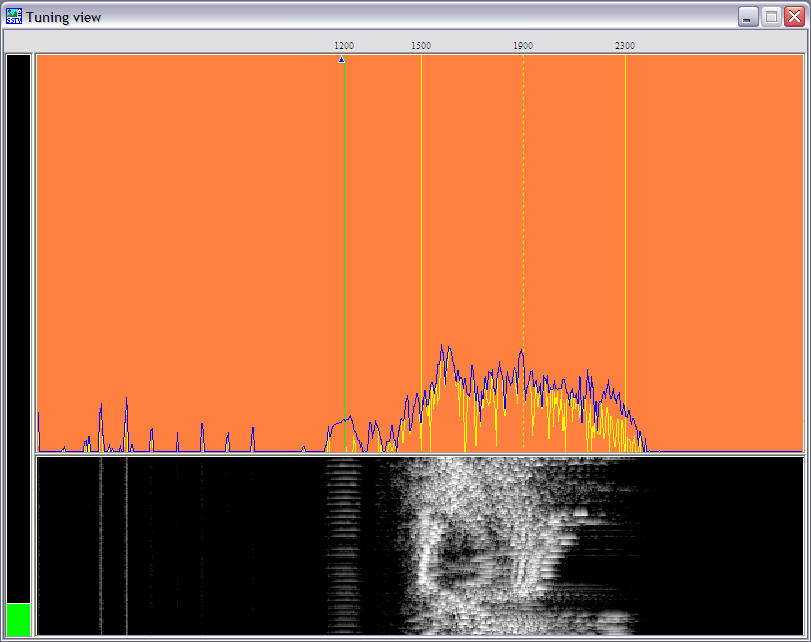
Sonogram and spectrum view in MMSSTV. The repeating pattern at 1200 Hz is a sync signal. Analogue FM modulated image information is to the right. The two lines on the far left is some kind of mystery noise from the recorder not related to the image.
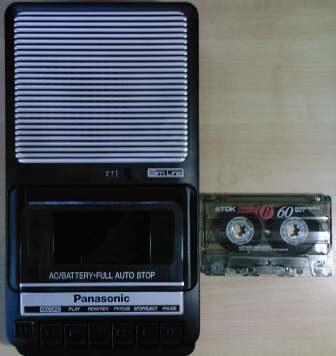
The storage device
|
|||||||||||||||||||||||||||||||||||||||||||||||||||||||||||


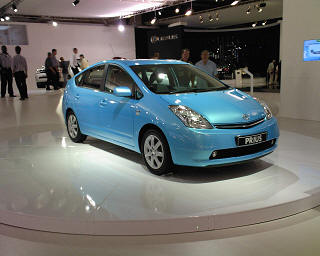
 The high resolution image.
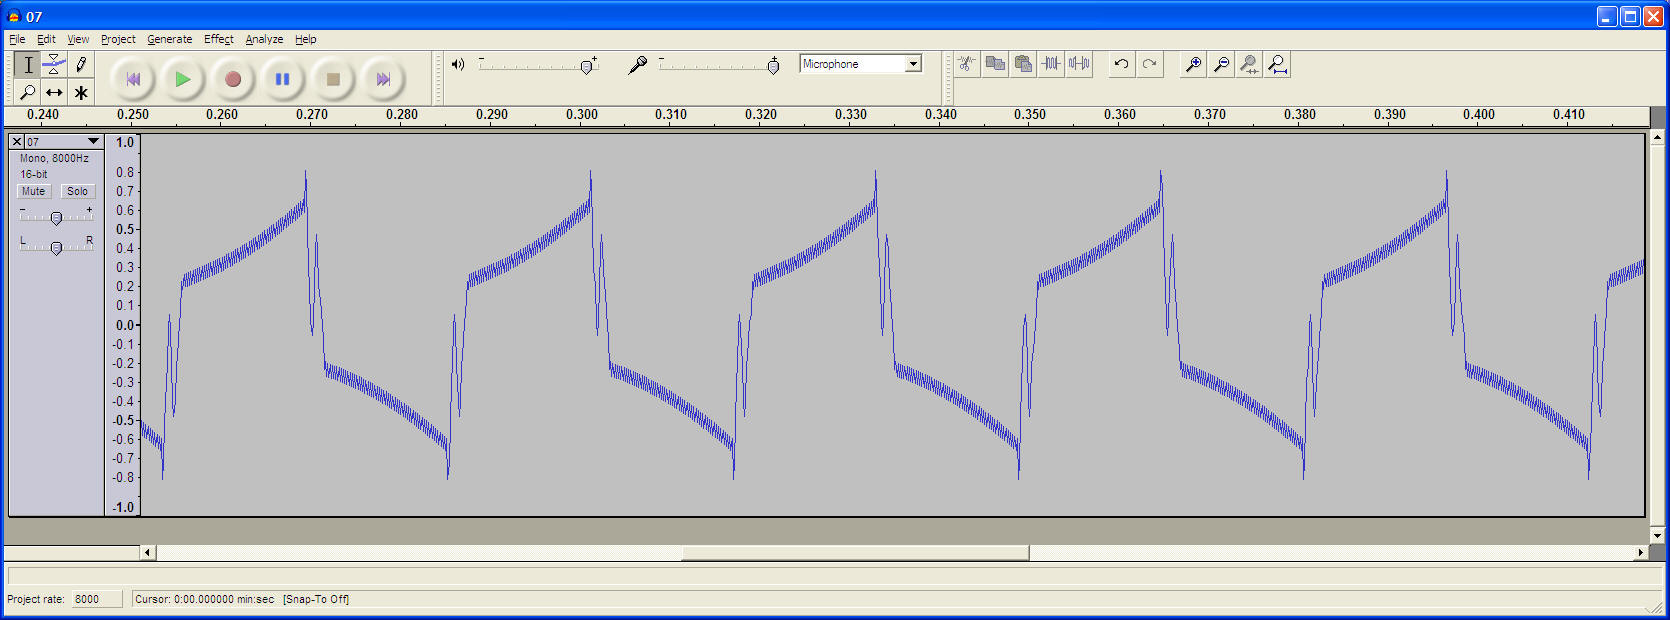
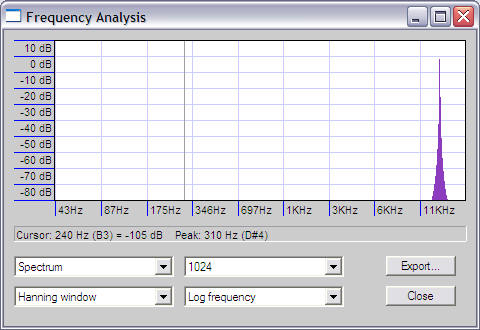
 Spectrum view of waveform above. Notice the high peak at 30Hz